# Global and European setting
* [*1 Global economy held up quite well despite array of burdens*](#tar-1 "1 Global economy held up quite well despite array of burdens")
* *[*1.1 Economic lull in China*](#tar-2 "1.1 Economic lull in China")*
* **[*1.2 Subdued economic developments in other major emerging market economies*](#tar-3 "1.2 Subdued economic developments in other major emerging market economies")**
* ***[*1.3 US economic activity remains robust, inflation still elevated*](#tar-4 "1.3 US economic activity remains robust, inflation still elevated")***
* ***[*1.4 Japanese economy defies rise in energy prices*](#tar-5 "1.4 Japanese economy defies rise in energy prices")***
* ***[*1.5 United Kingdom economic activity remains on upward trajectory*](#tar-6 "1.5 United Kingdom economic activity remains on upward trajectory")***
* ***[*1.6 Renewed increase in economic output in Poland*](#tar-7 "1.6 Renewed increase in economic output in Poland")***
* ***[*Convergence of EU Member States in central and eastern Europe progressing at a slower pace*](#tar-8 "Convergence of EU Member States in central and eastern Europe progressing at a slower pace")***
* ***[*2 Euro area activity surprisingly robust*](#tar-9 "2 Euro area activity surprisingly robust")***
* ***[*The instability of Irish GDP growth rates and its impact on the euro area economic analysis*](#tar-10 "The instability of Irish GDP growth rates and its impact on the euro area economic analysis")***
* ***[*List of references*](#tar-11 "List of references")***
****Non-final working translation****{#par-o1576u}
***1 Global economy held up quite well despite array of burdens*** {#tar-1}
---------------------------------------------------------------------------
*****The global economy remained resilient in the second quarter of 2026.** In the United States, the overall economic upturn continued in the second quarter, more or less maintaining its previous pace. Growth strengthened in the euro area after being dampened in the first quarter by the sharp decline in Irish . Excluding Ireland, economic output rose moderately again in the euro area. In China, growth slowed markedly in the second quarter, but given the ongoing export boom the underlying economic dynamics are likely to have performed better. Overall, the global economy has thus far held up quite well despite the burdens arising from higher energy prices and ongoing trade and geopolitical tensions.***{#par-a9o4i3}
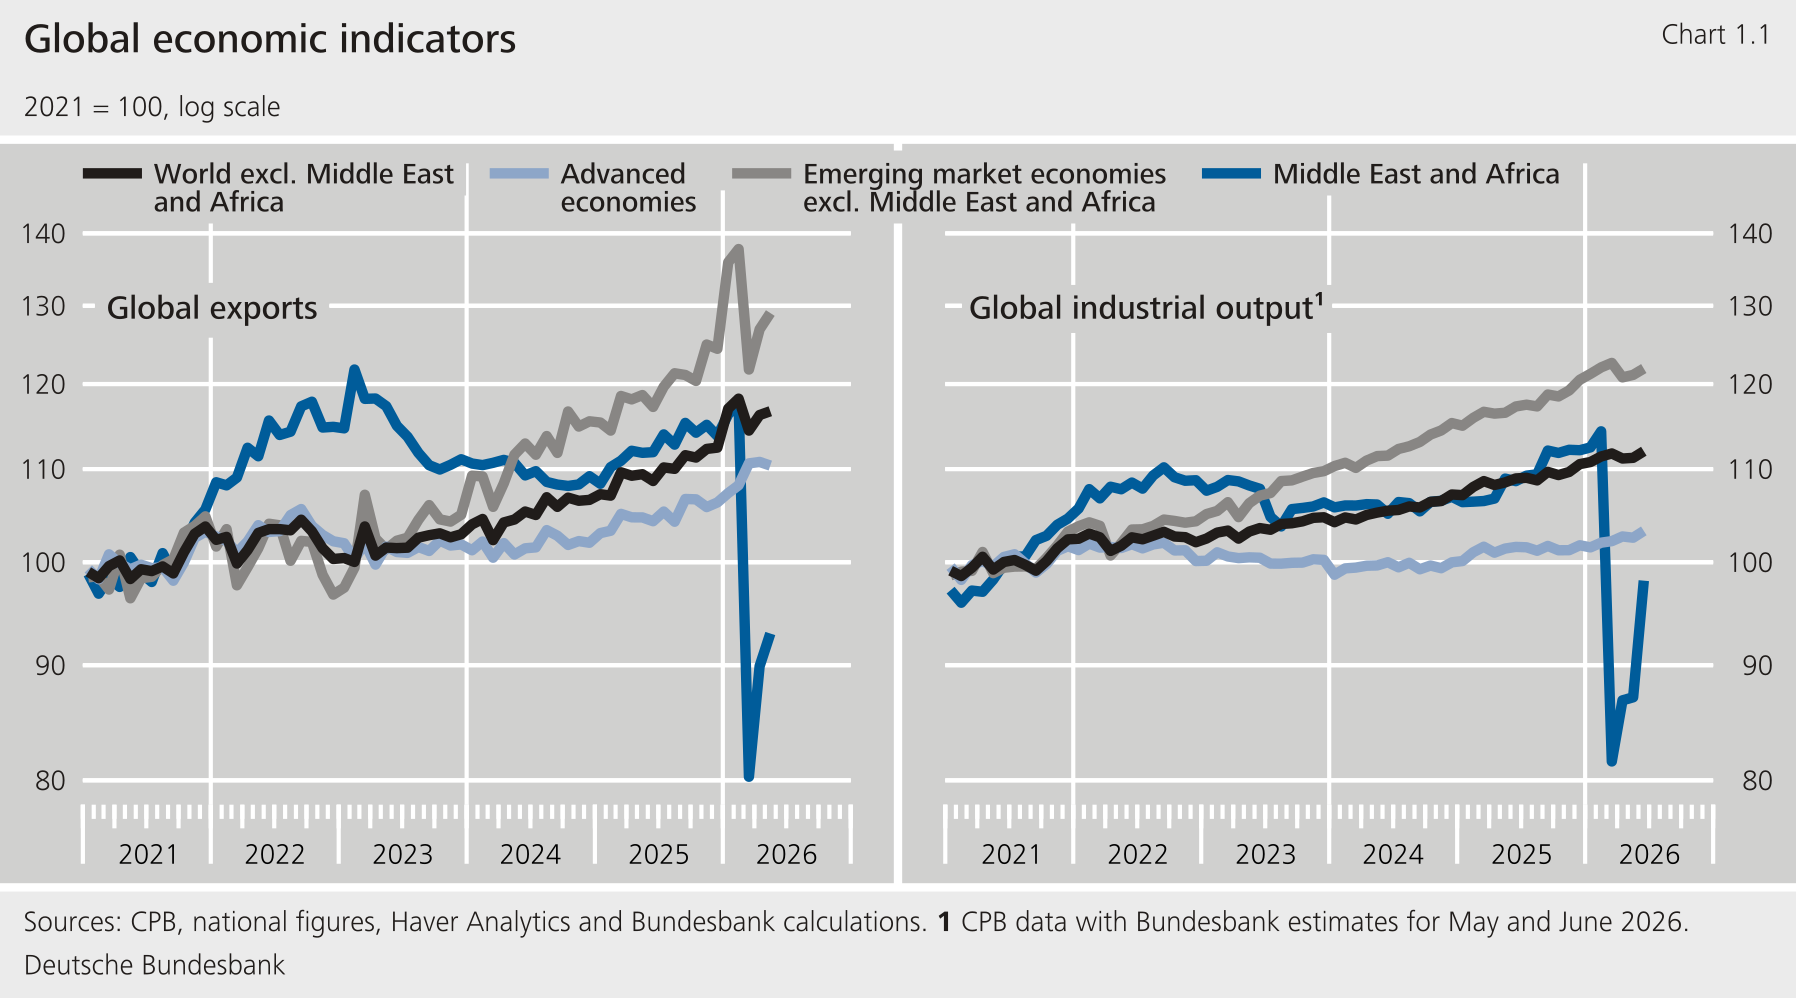
*****The burdens on industrial production and global trade stemming from the conflict in the Middle East have so far remained confined to specific regions.** Although industrial production fell sharply in the oil-exporting economies of the Gulf region as a result of military conflict, industrial production and exports of goods continued to increase in the advanced economies. They were mainly supported by persistently buoyant global investment demand in connection with high-tech and applications. In addition, a precautionary build-up of inventories in anticipation of potential supply chain disruptions due to the blockade of the Strait of Hormuz is likely to have supported industrial activity and global trade at times. The latest sentiment indicators suggest that economic activity in advanced economies has been robust of late. However, the geopolitical situation in the Gulf region remains highly strained. Any extension or broadening of the conflict poses significant downside risks to the global economy.***{#par-ae568i}
{#par-i598io}
******
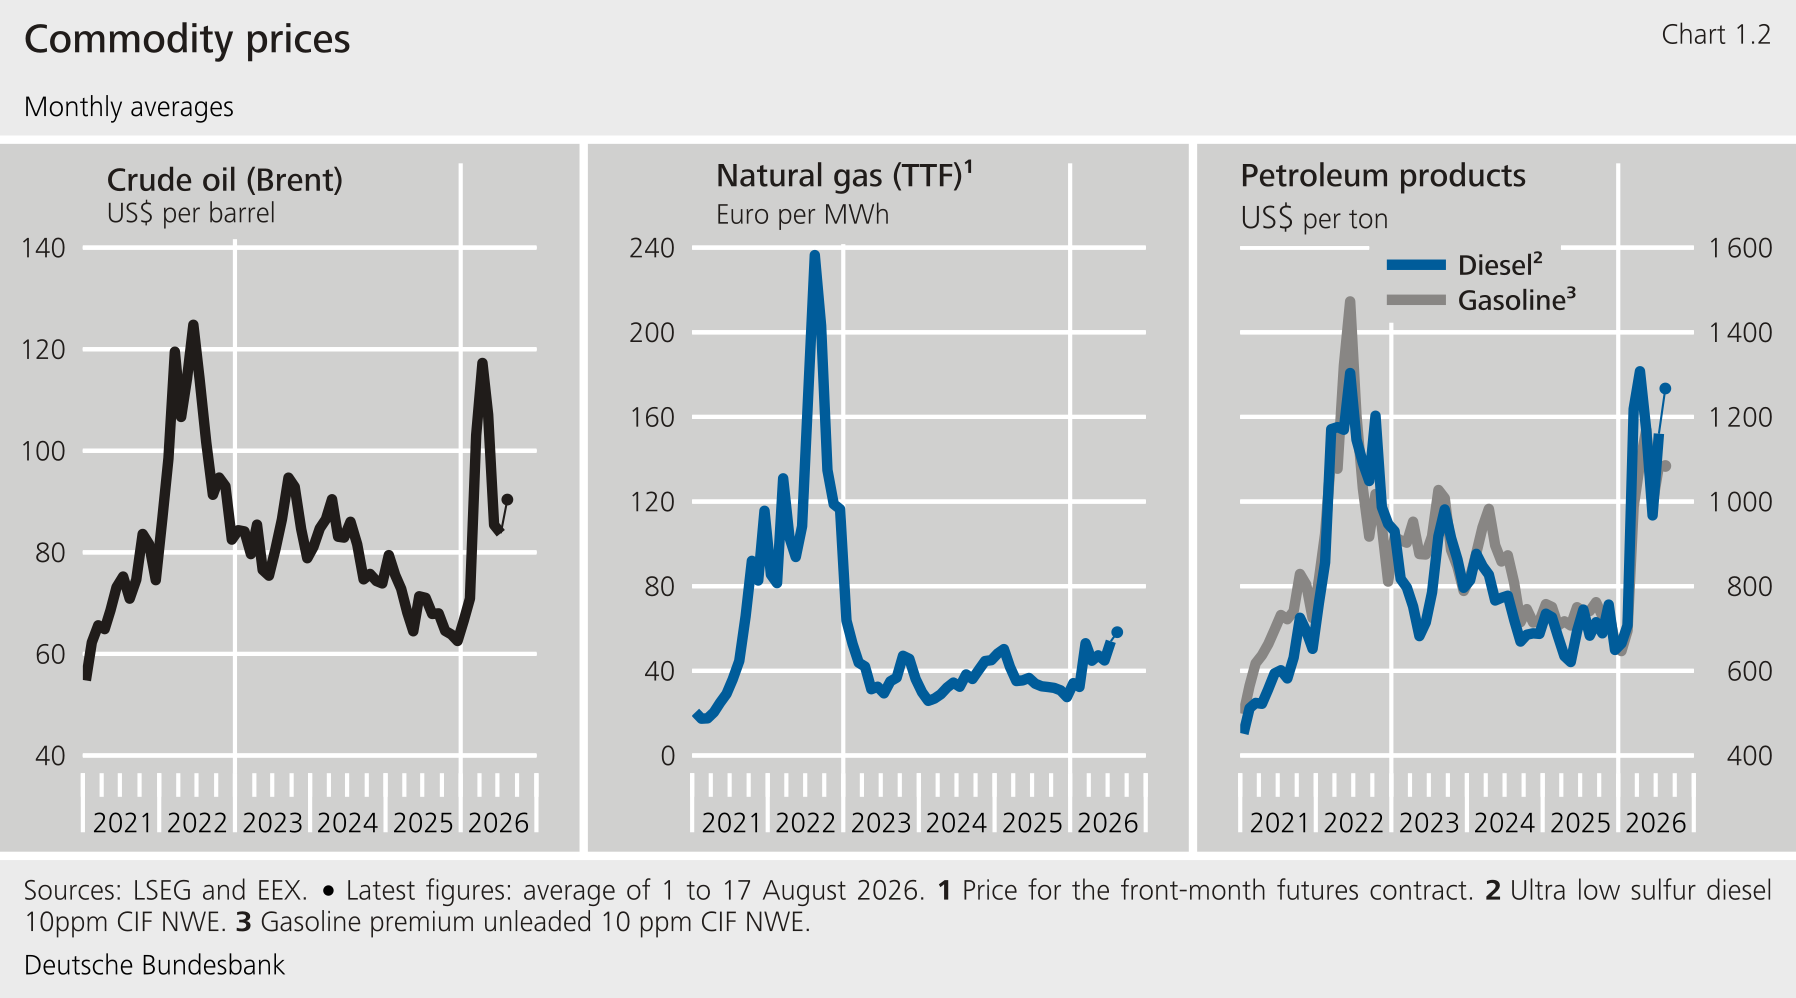
*****Energy commodity prices have remained significantly elevated recently, given the volatile geopolitical situation.** Oil prices fell sharply in June after the United States and Iran agreed on a memorandum of understanding and shipping via the Strait of Hormuz resumed temporarily. In July, however, prices picked up again as a result of new military strikes and the renewed blockade of the Strait. At last report, Brent crude oil cost $92 per barrel, around 29 % more than before the war began. Forward quotations suggest that prices will fall slightly by the end of the year. However, the upside risks remain considerable given reduced global inventories and possible further supply outages in the event of a regional expansion of the conflict. This is particularly true of the prices of many petroleum products. The global supply of these products has also contracted in recent months due to Russian refineries suffering war-related production losses. Accordingly, prices for kerosene, heating oil, gasoline and diesel continued to significantly exceed their pre-crisis levels in many regions. The European gas price also picked up more strongly again, standing at €62 per megawatt hour, around twice its pre-war level. This was mainly due to longer-term damage to production facilities and low European storage levels.***{#par-ai52ei}
{#par-a7o2u2}
******
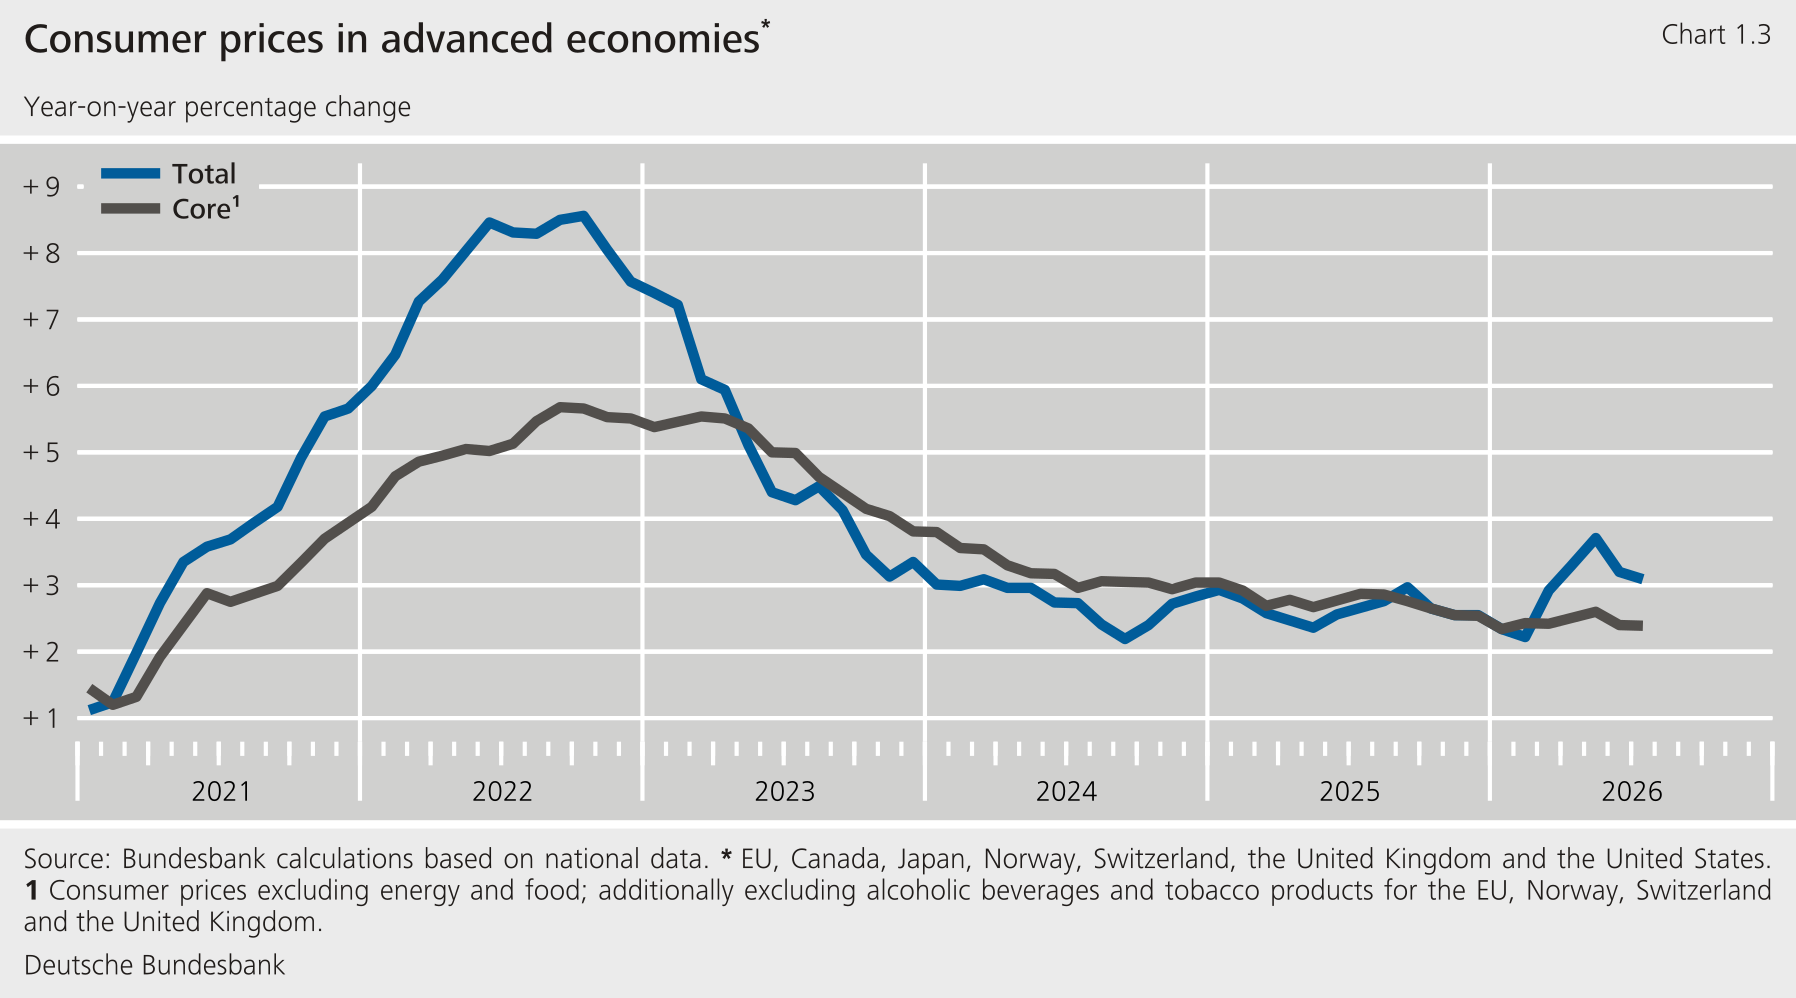
*****Energy prices continued to drive inflation in advanced economies.** The year-on-year increase in consumer prices amounted to 3.1 % in July. It had temporarily risen to 3.7 % in May, up from 3.3 % in April. The rate excluding energy and food stood at 2.4 % in July, slightly below its April level. If energy commodity prices remain elevated for longer, enterprises are likely to increasingly pass on the associated costs to consumers. In addition, the global investment boom in artificial intelligence is increasingly driving up the prices of individual goods. Prices not only for intermediate products such as semiconductors and memory modules but also for computers and software and accessories have recently risen significantly. Although their contribution to consumption inflation is likely to be limited due to their low weight in the baskets of goods, they could further amplify underlying cost and price pressures.***{#par-i41i23}
{#par-o7uu38}
******
*****In its regular July update of the World Economic Outlook,** **staff left its global growth forecast broadly unchanged compared with April.** For 2026, it lowered it by 0.1 percentage point to 3.0 %, and for 2027 it raised it by 0.2 percentage point to 3.4 %. According to the , the burdens from the conflict in the Middle East would be partly offset by strong investment and export dynamics in the high-tech sector. At the same time, the raised its inflation forecast for the group of advanced economies for 2026 and 2027 by 0.2 percentage point each -- to 3.0 % and 2.4 % respectively. It noted that while the risks to the global economic outlook were more balanced than in April, they remained tilted to the downside. In particular, a renewed escalation in the Middle East, rising trade disputes or a correction of high expectations for productivity gains and earnings from artificial intelligence could weigh on the global economy.***{#par-a9u1e1}
### ***1.1 Economic lull in China*** {#tar-2}
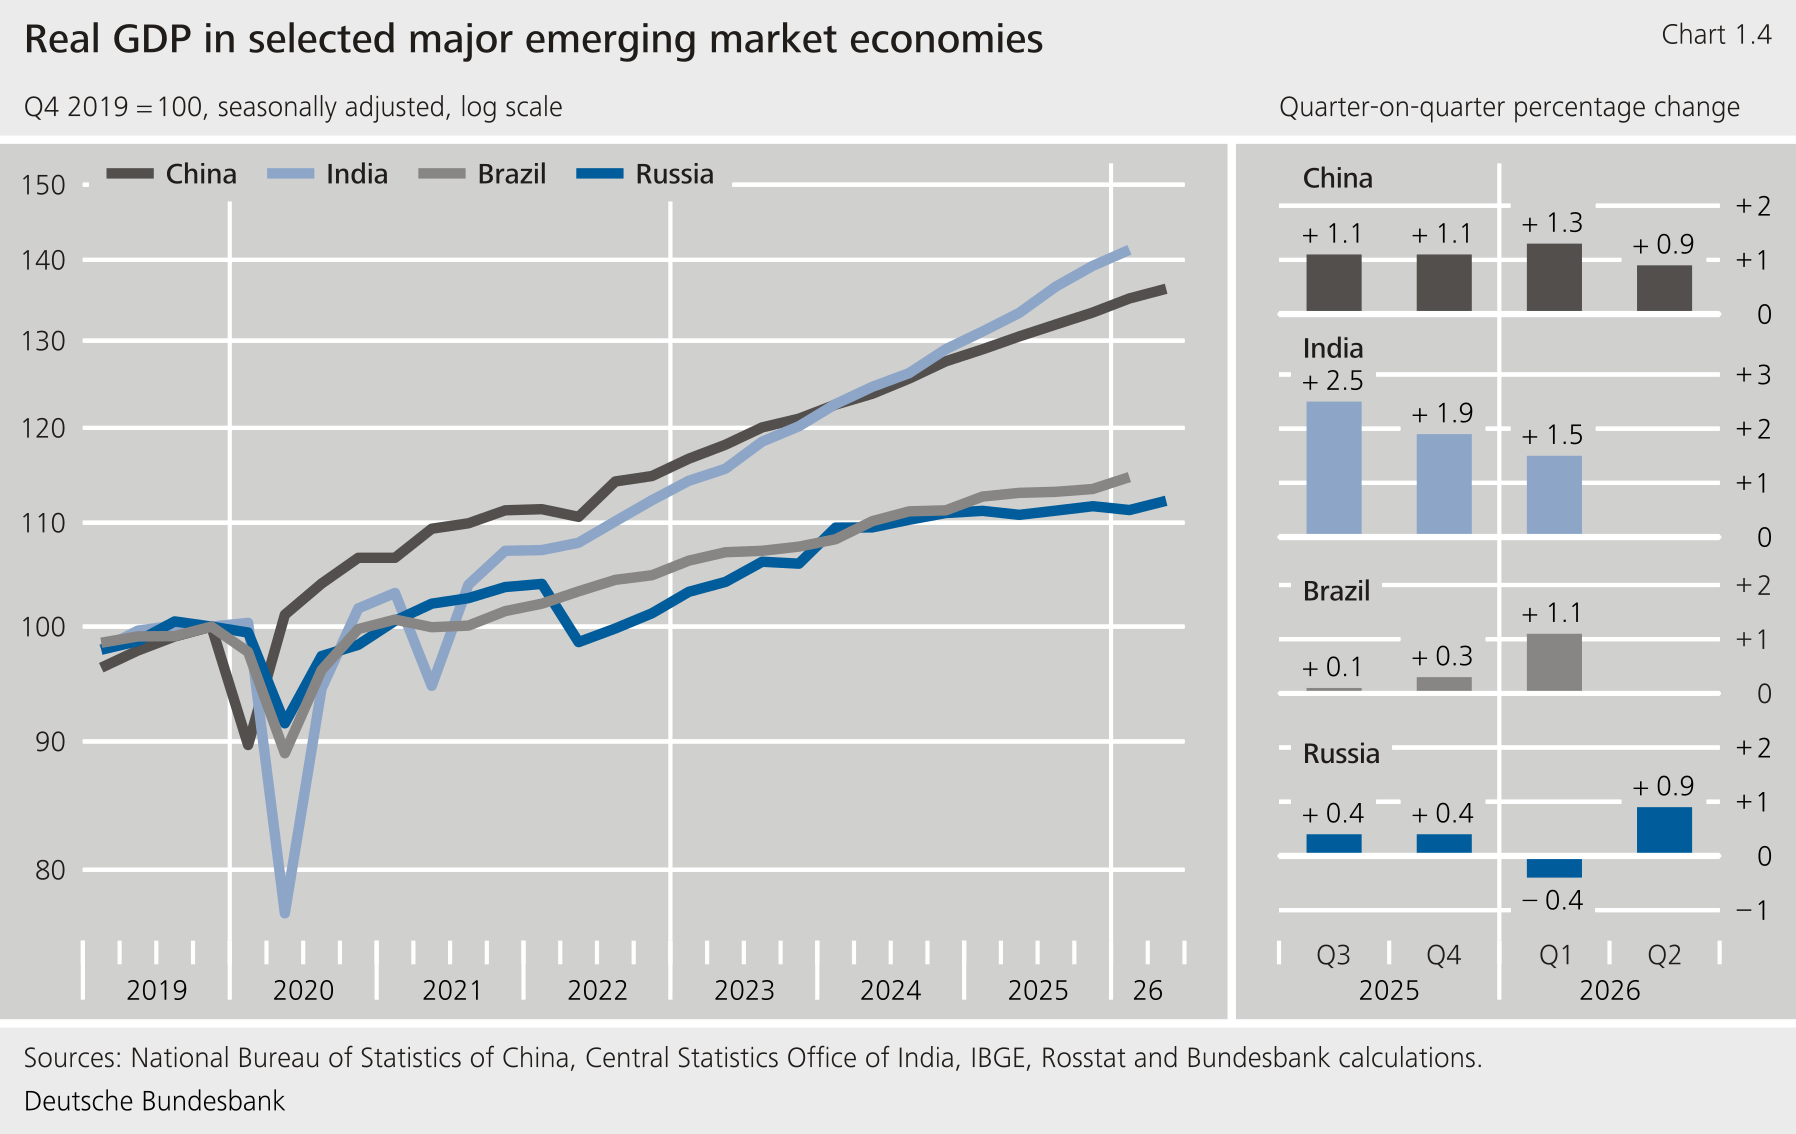
*****The Chinese economy lost significant momentum in the second quarter of 2026.** With a year-on-year increase of 4.3 %, China recorded its lowest economic growth since the ‑19 pandemic. The slowdown was broad-based and was accompanied by lower growth rates for industrial production, retail sales and the services sector. There was a significant decline in fixed investment. The real estate crisis continued. After consumer price inflation had picked up somewhat over a few months as a result of the war in Iran, the annual rate of inflation in the consumer price index fell again significantly to 0.5 % in July. The core rate excluding energy and food also fell slightly to 0.9 %.***{#par-oeo78u}
*****Domestic demand and foreign trade continued to diverge.** Chinese exports of goods rose sharply again in terms of value. The increase was just over 20 % in dollar terms compared with the same period the previous year. Going by sector, exports increased strongly in electronic products, integrated circuits and motor vehicles in particular. Above all, the considerable price increases for some -related goods were a key driver of trade growth. Exports are likely to remain a pillar of China's economy. At the same time, the Chinese government announced measures to strengthen private consumption.[\[1\]](#_ftn_root_1) Whether this will have a greater impact on the reduction of imbalances than previous initiatives remains to be seen.***{#par-uaii4i}
{#par-u9i6e7}
****
### **1.2 Subdued economic developments in other major emerging market economies** {#tar-3}
****India's economy is increasingly facing headwinds.** In the first quarter of 2026, real had risen by 7.8 % on the year, despite the high dependence on energy and fertiliser supplies from the Gulf region. While supply bottlenecks in the energy sector were mitigated by an expansion of domestic electricity and natural gas production, unusually low rainfall at the start of the monsoon season weighed on agriculture in the second quarter. Consumer price inflation increased by 0.8 percentage point to 3.9 % in the second quarter. This was mainly due to a marked rise in prices for food and beverages. In July, inflation stood at 4.5 %. Nonetheless, the central bank chose to leave its key interest rate unchanged at 5.25 %.**{#par-e41uae}
****In Brazil, growth continued to lack any clear stimulus.** growth was 1.8 % on the year in the first quarter of 2026, about as strong as it had been before. This was mainly driven by the rise in global energy prices, from which Brazil benefited as a net energy exporter. This development may have continued in the second quarter. The additional tariffs imposed by the United States on imports from Brazil could have a negative impact later in the year. However, Brazil already diversified its trade relations last year, increasing trade with China in particular. Consumer price inflation increased by 0.5 percentage point to 4.6 % in the second quarter and was 4.4 % in July. This put the inflation rate at the top edge of the central bank's target corridor. Despite this, the central bank lowered its key interest rate by 25 basis points in both June and August, reaching 14 %.**{#par-o16ei5}
****Russia saw a surprisingly strong economic upturn.**According to preliminary data from the national statistical office, rose by 1.3 % on the year in the second quarter of 2026, after falling by 0.2 % in the previous quarter. The Russian economy is likely to have benefited from higher energy prices, while ongoing Ukrainian drone attacks on refineries have hampered domestic fuel production. The main reason for growth, however, was probably a significant increase in private consumption, to which car purchases made a marked contribution. By contrast, real interest rates -- which remain high -- are likely to have had a negative impact on investment. The government budget situation deteriorated further in view of the high military spending. Despite higher fuel prices, consumer price inflation has remained virtually unchanged in recent months, standing at 6 % in July according to data from the national statistical office. The central bank continued its monetary easing cycle, most recently reducing its key interest rate to 14 %.**{#par-ee3984}
### **1.3 economic activity remains robust, inflation still elevated** {#tar-4}
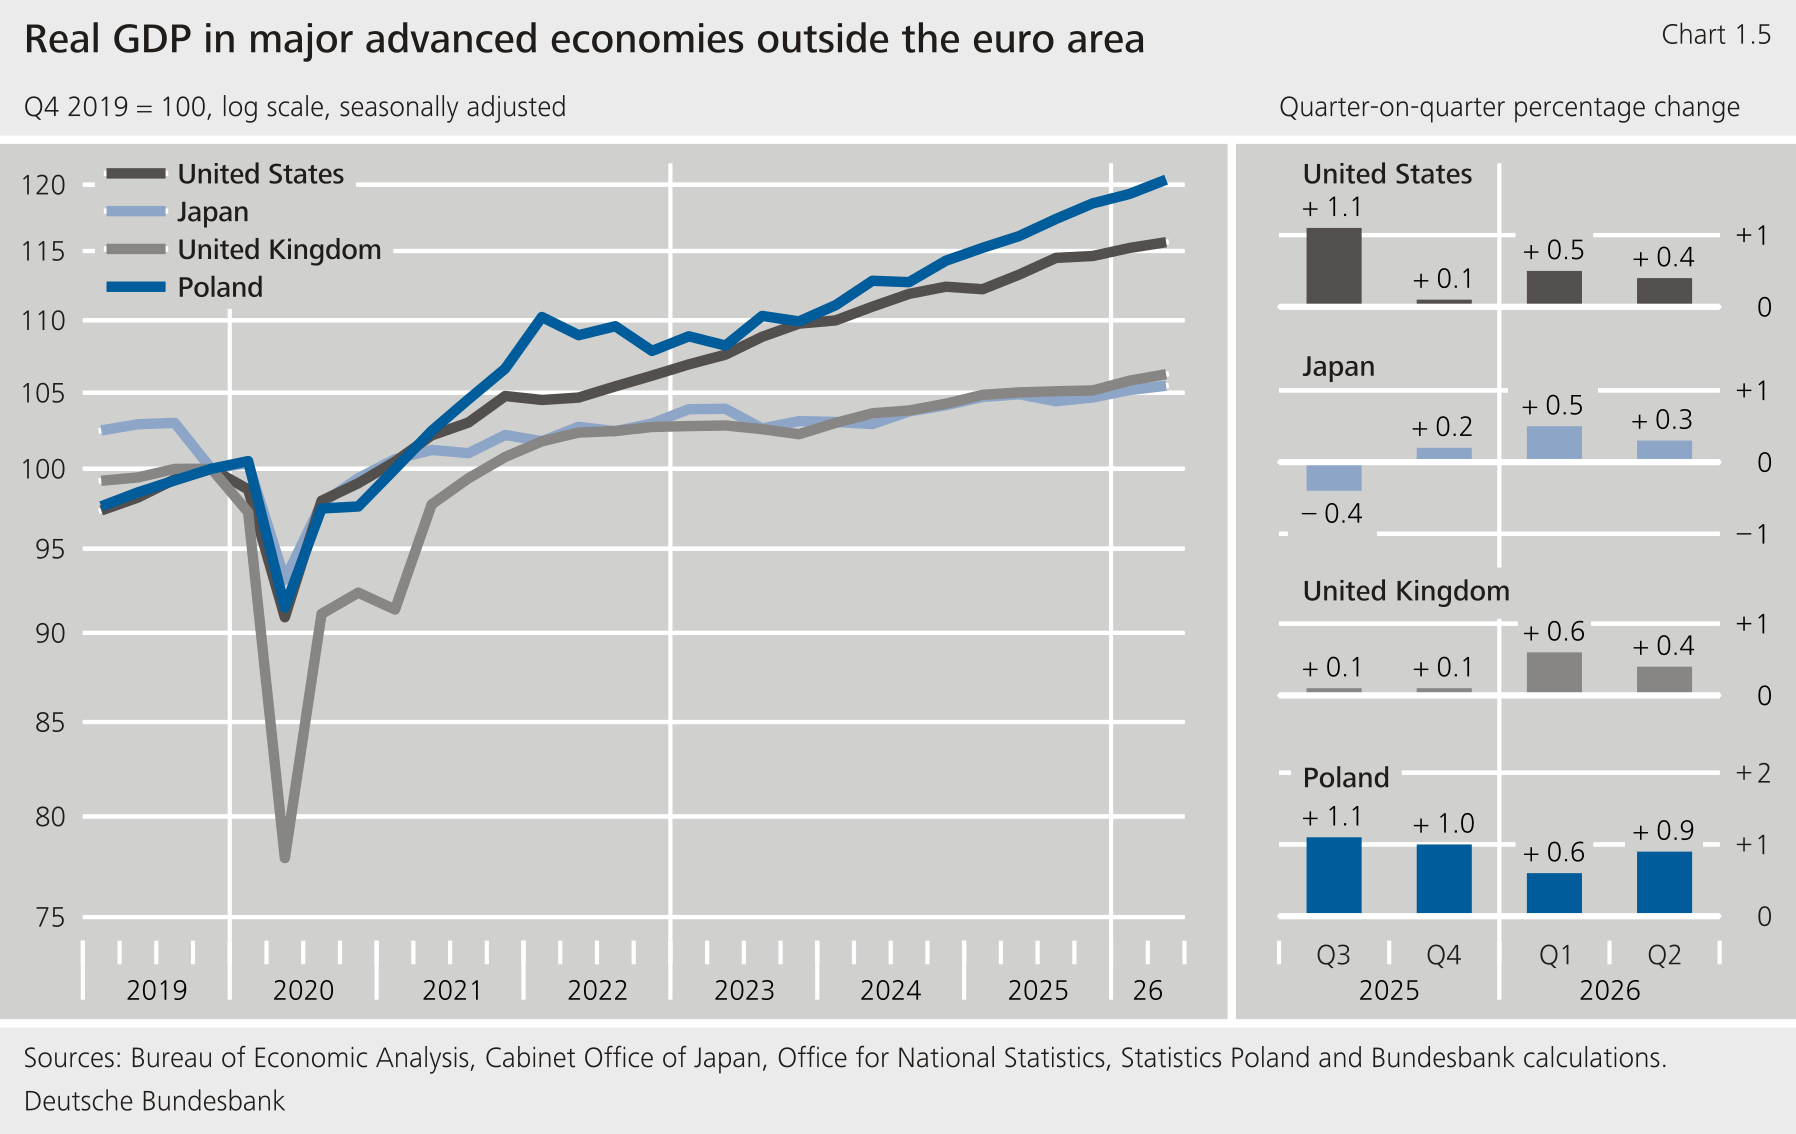
****The** **economy remained in good shape in the second quarter.** Real rose by 0.4 % on the quarter in seasonally adjusted terms. Private final domestic demand grew even more vigorously. enterprises continued to up their investment in machinery and equipment substantially, broadening the upswing outside the high-tech segment. Households also increased their spending significantly. Fiscal relief as a result of the tax reform of the previous year is likely to have contributed to this. The reform helped households cope with losses in purchasing power caused by higher energy prices. At the same time, the United States increased its energy exports considerably. This was however accompanied by a significant reduction in inventories. Imports were again buoyant.**{#par-i39eu5}
****There are no signs of a slowdown in growth in the United States so far, and underlying inflation remains high.** Sentiment in business surveys continued to brighten in July, while employment growth weakened significantly. The weakness in the labour market is also likely to be attributable to the limited labour supply and therefore does not necessarily contradict the continued robust aggregate demand. Underlying price pressures are therefore likely to remain elevated. There are also no signs of consumer relief coming from tariff policy.[\[2\]](#_ftn_root_2) The latest trade policy measures barely changed the effective average tariff rate. Ongoing investigations could even lead it to increase further.[\[3\]](#_ftn_root_3) The current boom has also recently intensified price pressures. For consumers, this has so far been mainly reflected in prices for computer accessories and other selected high-tech products, some of which have risen sharply. Higher costs at upstream stages of production suggest that prices could also rise more strongly in other areas in future. Despite a decline in July, energy prices were still just under 15 % above their previous year's level. The annual rate of inflation in the consumer price index therefore remained elevated at 3.4 % in July. Excluding energy and food, it dropped slightly to 2.5 %. Despite high inflation, the central bank has so far refrained from raising interest rates. It also left the target corridor for its key interest rates at 3.5 % to 3.75 % in July.**{#par-eo2ii7}
{#par-aa3u72}
****
### **1.4 Japanese economy defies rise in energy prices** {#tar-5}
****Japanese economic output continued its moderate recovery in the second quarter.** According to the initial estimate, Japan's recorded seasonally and price-adjusted growth of 0.3 % in the second quarter compared with the previous quarter. In arithmetical terms, this was mainly due to foreign trade. While exports rose moderately, imports fell significantly. Domestic private demand, by contrast, remained weak. Private consumption stagnated and commercial fixed capital formation declined again. Although government consumption rose steeply, there was a considerable reduction in government crude oil inventories at the same time. The Japanese labour market remained tense. The unemployment rate fell to 2.5 % by June, and wages continued to rise steeply. Consumer price inflation strengthened only moderately in the second quarter. Annual consumer price inflation increased to 1.6 % in June from 1.4 % in April, while core inflation excluding food and energy rose slightly to 1.2 % in June. Government measures to cushion higher energy costs had a dampening effect. Against the backdrop of higher inflation expectations and persistently strong wage growth, the Bank of Japan raised its key interest rate to 1.0 % in June. In July, it also made greater reference to upside risks to inflation.**{#par-o88968}
### **1.5 United Kingdom economic activity remains on upward trajectory** {#tar-6}
****The economic upswing in the United Kingdom continued.** Real rose by a seasonally adjusted 0.4 % in the second quarter compared with the previous period, following even stronger growth at the beginning of the year. Significant growth impulses came mainly from the manufacturing sector, but the economically significant services sector and construction also saw marked expansion. So far, the labour market has hardly benefited from favourable macroeconomic developments. Employment remained broadly stable and the unemployment rate remained at 4.9 %. Wage growth has not weakened any further of late. Although consumer price inflation eased in June and the annual Harmonised Index of Consumer Prices () rate fell to 2.6 %, underlying price pressures remained elevated. In addition, the increase in the government energy price ceiling and indirect price-increasing effects of the energy price shock are likely to amplify price pressures again in the third quarter. Against this backdrop, the Bank of England has kept its key interest rate at 3.75 % since the end of last year.**{#par-ie1ei3}
### **1.6 Renewed increase in economic output in Poland** {#tar-7}
****In Poland, economic growth picked up again in the second quarter of 2026.** According to preliminary data, real rose by 0.9 % compared with the previous quarter, up from 0.6 % in the first quarter. Construction output recovered from the decline at the beginning of the year, which was mostly due to weather conditions, and rose steeply in the second quarter. This was partly due to the use of funds from the Recovery and Resilience Facility. Industrial output rose markedly in the second quarter. The services sector also held up well. Poland made further progress towards convergence owing to its continued robust growth (see the supplementary information entitled "Convergence of Member States in central and eastern Europe progressing at a slower pace"). Private consumption may have remained weak in the second quarter. This is indicated by the slight decline in retail sales. The deterioration in real income growth is likely to have contributed to this. At 5.8 %, gross wages in the corporate sector rose somewhat less substantially on the year than before. Despite temporary extensive government relief measures, consumer price inflation picked up in the second quarter to 3.2 %. In July, inflation stood at 3.1 %. The Polish central bank left its interest rate unchanged at 3.75 %.**{#par-oa938u}
**Convergence of Member States in central and eastern Europe progressing at a slower pace** {#tar-8}
----------------------------------------------------------------------------------------------------
****In the central and eastern European** **Member States,** [\[1\]](#_ftn_4d56b8e1_1)**the economic recovery gained some momentum in 2025. Convergence towards the** **average continued, albeit at a slower pace since the** **‑19 pandemic.** Last year, the economic growth of the central and eastern European Member States was driven mainly by robust domestic demand. Gross fixed capital formation, in particular, grew strongly after falling in 2024. This was mainly due to improved financing conditions and the use of financial resources from funds and the NextGenerationEU () recovery instrument. Investment in machinery and equipment rose steeply, while construction investment grew moderately. Household consumption evolved somewhat less forcefully than in 2024, mainly because inflation was up whilst employment was treading water. Government consumption also increased less steeply. Foreign trade picked up significantly. As demand from the euro area grew, exports of goods and services rose considerably. Imports saw even stronger growth. Overall, the real gross domestic product () of the central and eastern European Member States rose by 2.4 % in 2025, compared with 2.0 % a year earlier and 1.5 % in the as a whole. This group of countries therefore continued to converge in real terms, albeit more slowly than in the pre-‑19 pandemic period.**{#par-oa3i3i}
{#par-e8o456}
**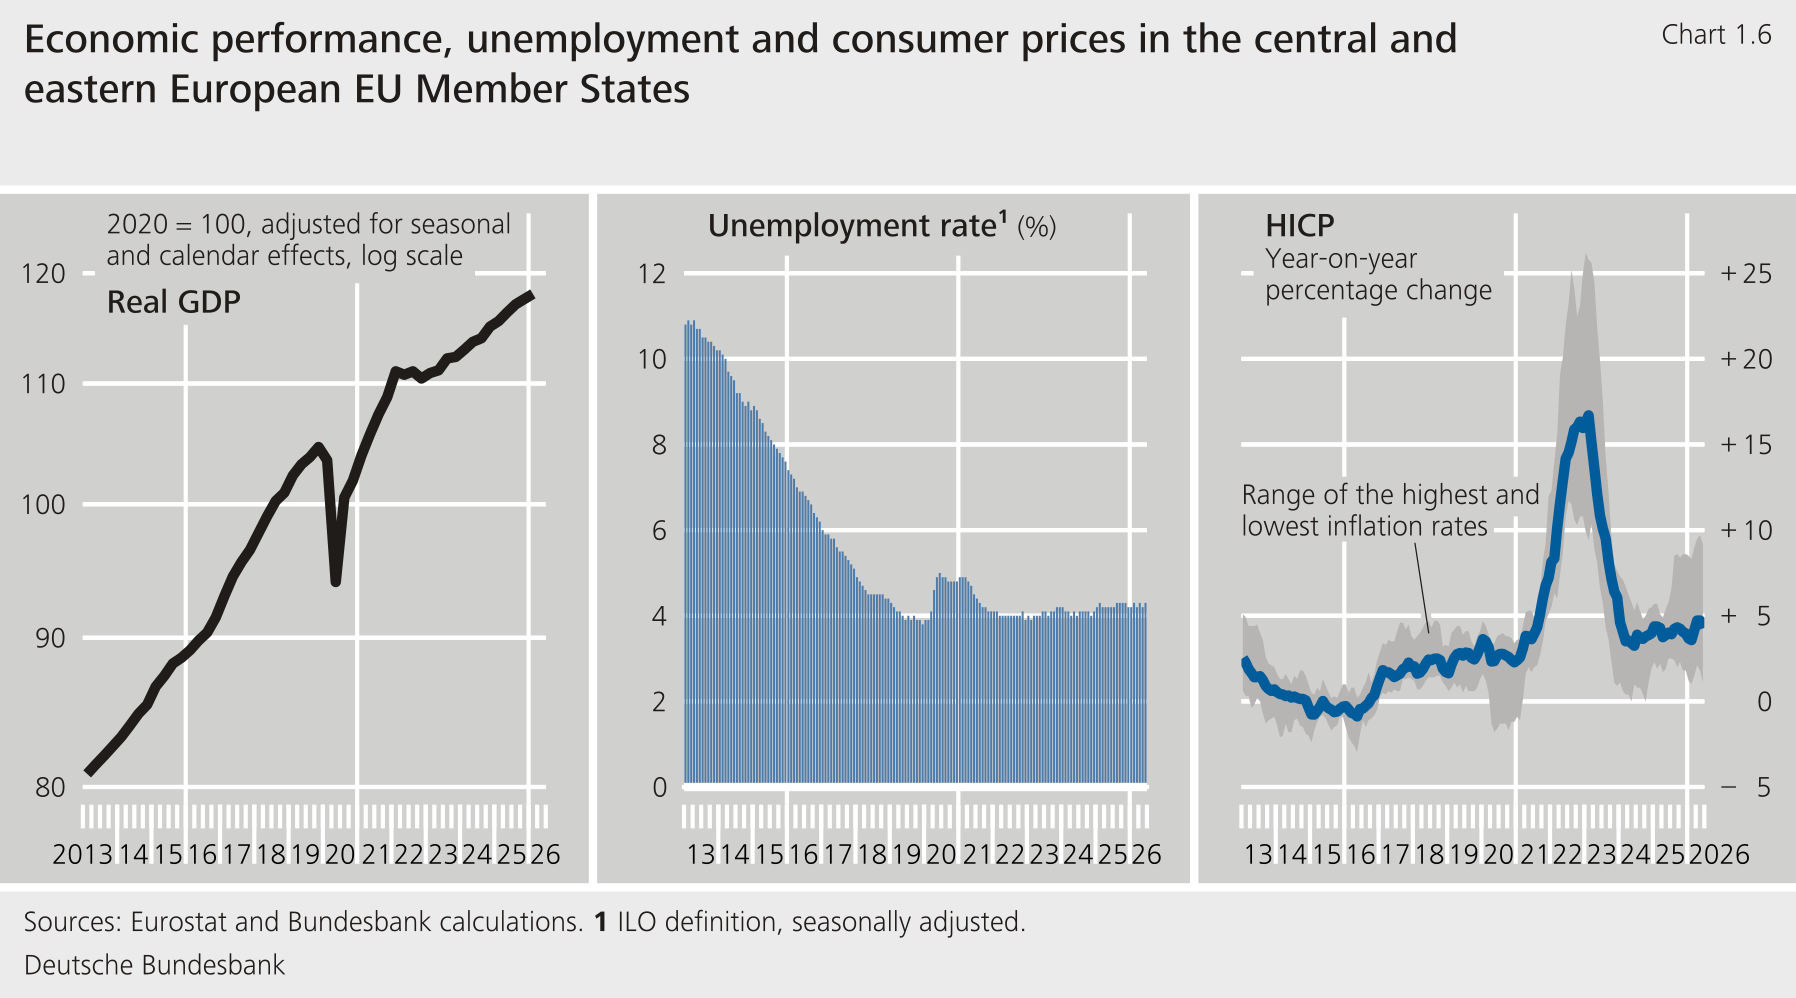**
****In regional terms, the stronger growth was mainly driven by an economic upturn in Poland and the Czech Republic.** In Poland, where growth had already been robust, the economy continued to accelerate, driven by domestic demand. Investment in machinery and equipment rose particularly strongly. In the Czech Republic, growth likewise accelerated significantly, driven by higher fixed investment and private consumption. Aggregate economic activity in Latvia again rose moderately. In Estonia, real recorded minor growth for the first time since the start of the war in Ukraine. In Bulgaria and Croatia, economic output grew at a broadly similar pace to that seen in 2024. Lithuania, too, roughly maintained the previous year's growth rate. Other countries saw weaker growth. Household and government consumption in Slovenia and Slovakia rose markedly less strongly than in 2024. In Romania and Hungary, too, was up only slightly from the previous year's level. In Romania, fiscal consolidation weighed on economic activity. Hungarian growth was dampened by the continued sharp decline in fixed investment.[\[2\]](#_ftn_4d56b8e1_2)**{#par-a99eio}
| Table 1.1: Economic performance, unemployment and consumer prices in the central and eastern European Member States |||||||
| % |||||||
| | **growth** || **Unemployment rate^1^** || **Inflation rate** ||
| | **2024** | **2025** | **2024** | **2025** | **2024** | **2025** |
|----------------|----------|----------|----------|----------|----------|----------|
| **11 average** | 2.0 | 2.4 | 4.1 | 4.2 | 3.8 | 4.1 |
| **Euro area Member States** |||||||
| Bulgaria | 3.2 | 3.2 | 4.2 | 3.5 | 2.6 | 3.5 |
| Estonia | − 0.1 | 0.6 | 7.6 | 7.5 | 3.7 | 4.8 |
| Croatia | 3.8 | 3.4 | 5.1 | 4.9 | 4.0 | 4.4 |
| Latvia | − 0.3 | 2.1 | 6.9 | 6.9 | 1.3 | 3.8 |
| Lithuania | 3.0 | 2.9 | 7.1 | 6.8 | 0.9 | 3.4 |
| Slovakia | 1.9 | 0.8 | 5.3 | 5.4 | 3.2 | 4.2 |
| Slovenia | 1.7 | 0.9 | 3.7 | 3.9 | 2.0 | 2.5 |
| **Member States not in the euro area** |||||||
| Poland | 3.1 | 3.6 | 2.9 | 3.1 | 3.7 | 3.3 |
| Romania | 0.9 | 0.7 | 5.5 | 6.1 | 5.8 | 6.8 |
| Czech Republic | 1.2 | 2.7 | 2.8 | 2.9 | 2.7 | 2.3 |
| Hungary | 0.7 | 0.4 | 4.4 | 4.4 | 3.7 | 4.4 |
{#par-e5864o}
****In the labour markets, the previous year's slump continued to have an impact.** The unemployment rate rose slightly to 4.2 %, but remained low. The annual average number of persons in employment did not increase any further. Only in the second half of the year did demand for labour pick up in some countries, consistent with the revival of economic activity; Poland, the Czech Republic and Latvia were some examples. Romania, Slovakia and the Baltic countries continued to have comparatively high unemployment rates.**{#par-eo9346}
****The previously very strong wage growth subsided.** Annual growth in compensation per employee decreased in 2025 to 8.1 % from 12.0 % in 2024. Wage growth declined, especially in the non-euro area countries. By contrast, compensation grew at a virtually unchanged pace in the central and eastern European euro area Member States. Wage growth, which remains very strong, is related to the labour market conditions, which were in some cases tight. As wages rose significantly more strongly than labour productivity in many countries, unit labour costs rose markedly. This could impair the price and cost competitiveness of the central and eastern European Member States.**{#par-u5e44e}
****In the central and eastern European** **Member States, inflation remained above the euro area average in 2025.** Consumer price inflation in this group of countries rose to 4.1 % in 2025, as against 3.8 % in the previous year. In this region's euro area Member States, annual inflation rose. Elsewhere, however, developments were uneven. In Poland and the Czech Republic, inflation eased slightly as the domestic currency appreciated. By contrast, price pressures picked up in Hungary and Romania. The rise in consumer prices was partly attributable to sharply rising food prices. Excluding food and energy, the inflation rate in the group of countries under review fell from 4.8 % in 2024 to 3.9 % in 2025.**{#par-ui13u3}
****In the first half of 2026, inflation increased markedly.** This was mainly due to rising energy prices caused by higher crude oil prices following the escalation of the conflict between the United States and Iran. In the group of countries under review, the inflation rate rose markedly to 4.7 % in April and May. After the price of crude oil declined, it went back down slightly to 4.0 % in July. Core inflation (excluding energy and food) gained 0.6 percentage point since February, bringing it to 4.2 % in July. In Bulgaria, the conversion of prices to euro following the introduction of the euro on 1 January 2026 also fuelled inflation. This probably resulted in a short-term inflation effect of 0.3 to 0.4 percentage point.[\[3\]](#_ftn_4d56b8e1_3)**{#par-oi46e1}
****In the course of 2024, the central banks of the central and eastern European** **Member States outside the euro area initially continued the cycle of interest rate cuts they had started in 2023.** This was motivated chiefly by the return of lower inflation rates over the course of the year. From May 2025, the National Bank of Poland lowered its key interest rate in six steps by a total of 175 basis points to 4.0 % in December. In March 2026, the policy rate was cut further to 3.75 %. The Czech National Bank reduced its policy rate in 2025 in two steps by a total of 50 basis points to 3.5 %. In June 2026, it raised it again to 3.75 % amid persistently elevated core inflation and expectations of rising headline rates. The Magyar Nemzeti Bank () kept its policy rate unchanged in 2025 at 6.5 %. Given the significant fall in inflation, in 2026 it lowered it by 25 basis points in three steps to 5.75 %. The National Bank of Romania left the key interest rate at 6.5 % in 2025 against the backdrop of the resurgence in inflation since the middle of the year. No interest rate moves took place in 2026, either.**{#par-i1i929}
****Public finances deteriorated markedly in most countries.** Hungary had by far the highest government debt ratio in 2025, at 75 %. In Slovenia and Slovakia, debt in 2025 exceeded the 60 % mark laid down in the European fiscal rules; in Estonia and Bulgaria it was below 30 % in the same year. Almost all countries are likely to see their debt ratios rise further in 2026. Romania and Poland are also expected to exceed the reference value in 2026. The unfavourable debt dynamics are being driven by persistently high fiscal deficits. Romania and Poland had deficit ratios of over 7 % in 2025; several other countries ran deficits in excess of the 3 % reference value. Deficit ratios are likely to rise further in most countries this year and next. Only the Czech Republic, Lithuania and Croatia are likely to consistently comply with the 3 % reference value for the deficit ratio under the fiscal rules. Higher interest expenditure weighed on the budgets of many countries. Interest expenditure as a percentage of was particularly high and rising in Poland and Romania; in Hungary, it remained very high despite declining in 2025. This is due to the high interest rates, in addition to the size of debt. Excessive deficit procedures have been in place against Romania since 2020, against Hungary, Poland and Slovakia since 2024 and against Bulgaria since 2026.[\[4\]](#_ftn_4d56b8e1_4)**{#par-a5uiu8}
****The economic convergence of the central and eastern European** **Member States has resumed its progress as they recovered from the disruptive effects of Russia's war of aggression against Ukraine.** These countries' per capita in purchasing power parities reached 81 % of the average in 2025. Marked progress was made last year, especially in the Czech Republic and Poland. Latvia and Bulgaria also continued to catch up. Progress was small in Hungary, Slovenia and Croatia, whereas Lithuania diverged slightly further from the average.**{#par-i173e7}
{#par-e16633}
**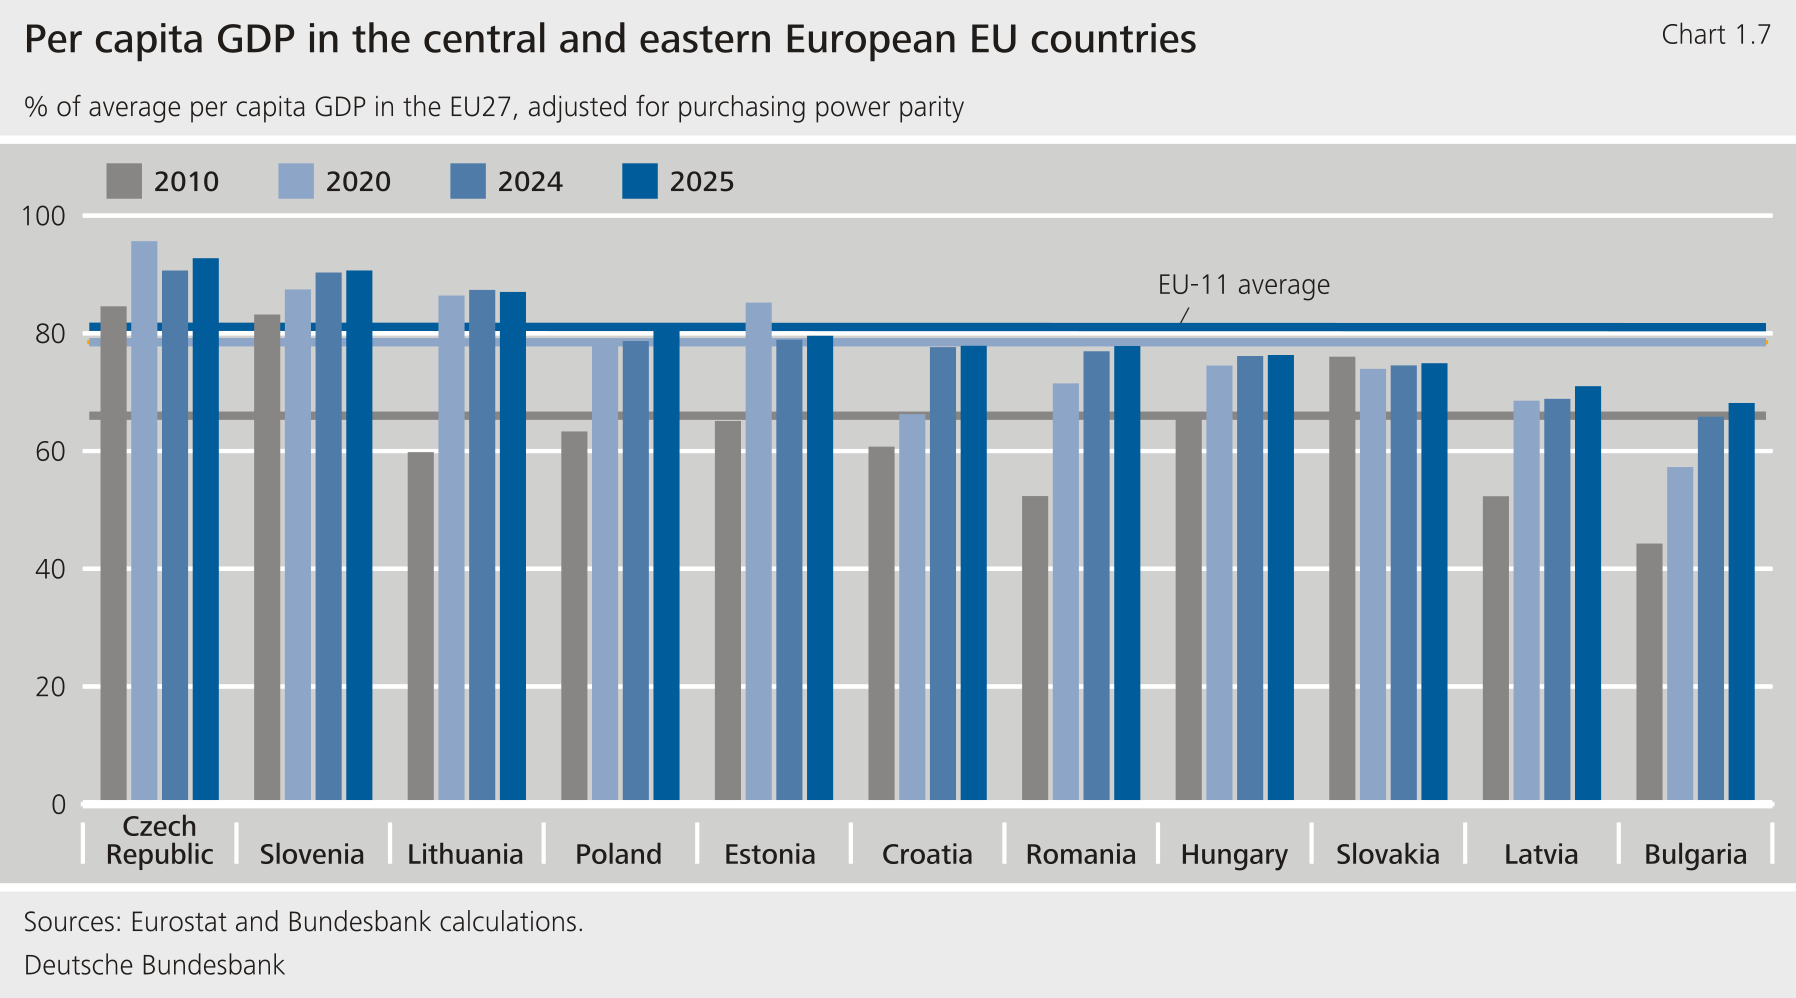**
****Viewed over the longer term, economic convergence slowed markedly.** Between 2020 and 2025, the central and eastern European Member States converged by just 2.6 percentage points towards the average, compared with 7.9 percentage points from 2015 to 2020 and 4.5 percentage points from 2010 to 2015. The reduced convergence progress can be explained in part by the specific burdens encountered in the years since 2020, particularly as a result of Russia's war against Ukraine. This event affected the central and eastern European countries more severely than, say, southern European countries. Another likely explanation is that some countries have made a great deal of progress in convergence. For example, per capita adjusted for purchasing power parities in the Czech Republic and Slovenia now roughly corresponds to that of Spain, a longtime Member State.**{#par-ie4473}
****Structural barriers are likely to have contributed to the weakening of convergence in several central and eastern European** **Member States**. These include, in particular, weak productivity growth and a lack of skills, both of which make labour shortages worse. Deficiencies in the capacity of public administration, the institutional framework and the corporate environment are also restricting growth potential. At the same time, adapting economic structures to the green and digital transformation poses considerable challenges for many countries. In addition, there are heightened geopolitical and trade policy uncertainties and, in some cases, considerable fiscal burdens.**{#par-ouie6i}
****External factors could weigh on economic activity in the central and eastern European** **Member States this year.** The countries in this region were particularly affected by the rise in crude oil prices in the wake of the ‑Iran war, as energy is a comparatively large component of their private consumption. Rising energy prices therefore constrain consumption opportunities to a greater extent than the average. Disruptions to global value chains are another risk. Several countries in the region, especially Slovakia and Slovenia, are internationally highly interconnected. The economic development of these countries depends to a considerable extent on global economic activity and key trading partners' specific economic developments.**{#par-o75o96}
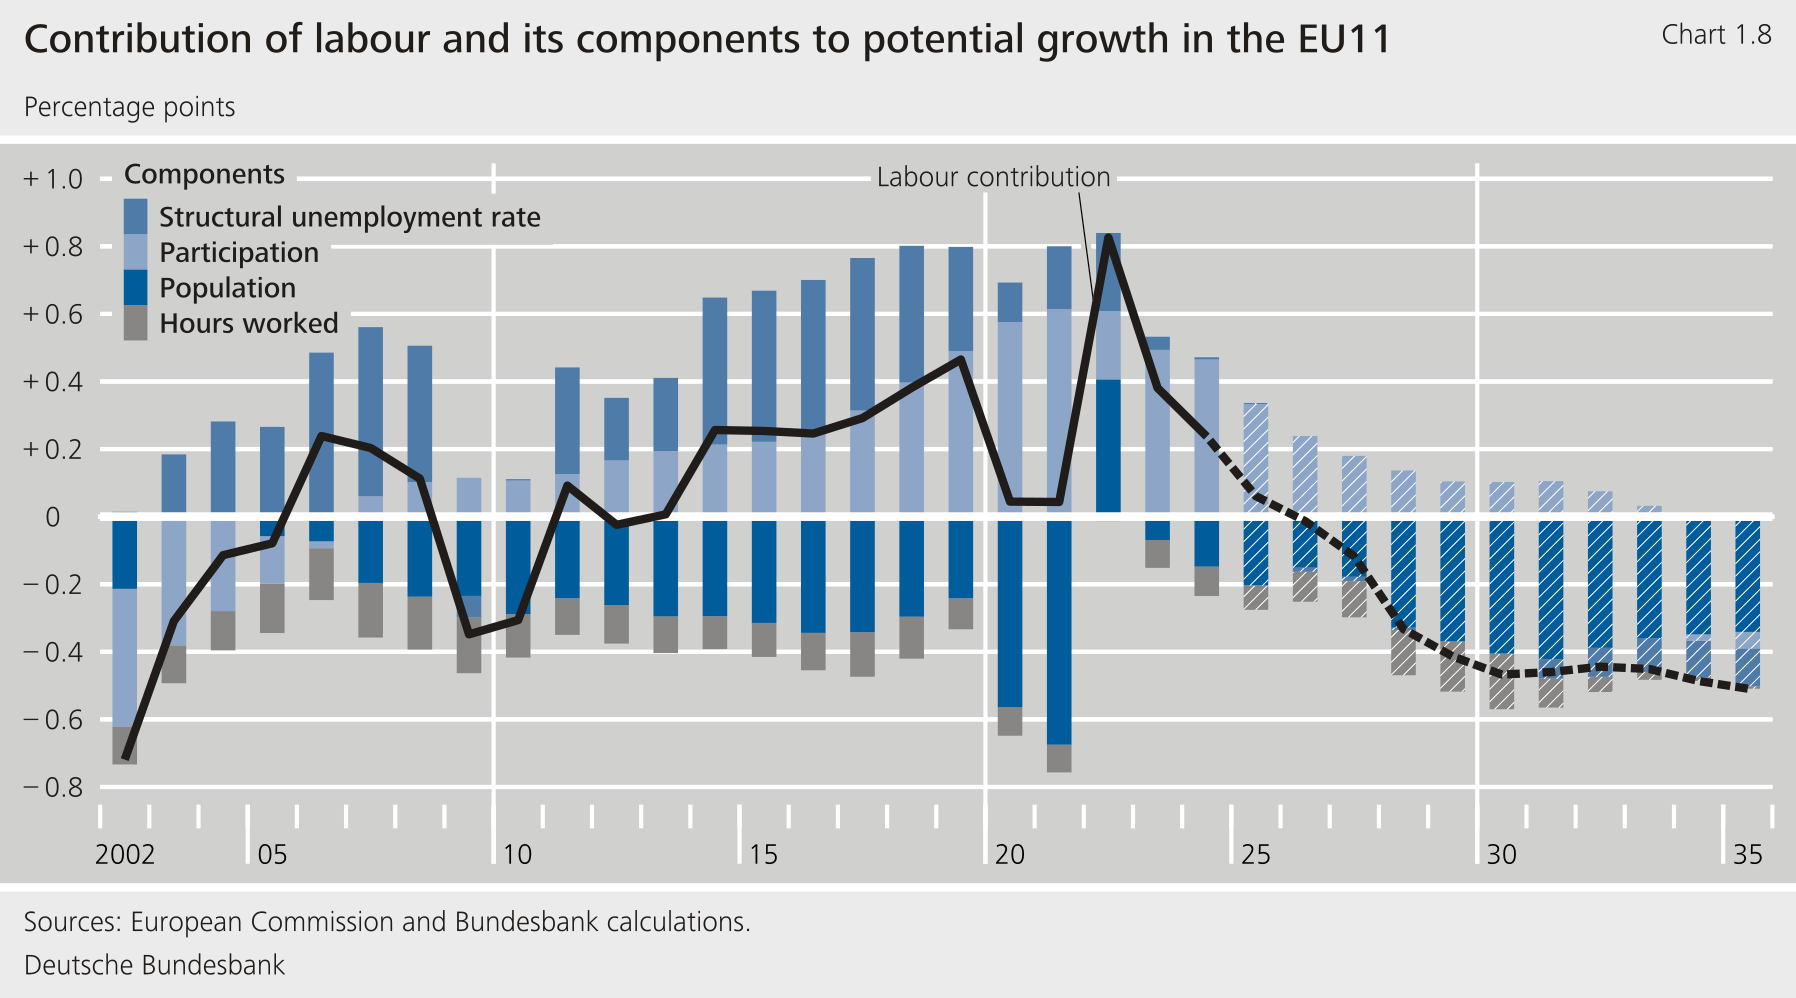
****Over the medium term, demographic developments will weigh substantially on the growth of the central and eastern European** **Member States.** In recent years, falling structural unemployment and higher labour market participation were still able to cushion the decline in the working-age population. The positive and negative contributions of labour supply to growth are expected to more or less break even this year. Demographic pressures are then likely to predominate significantly in the coming years. Rising labour market participation or a further decline in structural unemployment are not expected to provide any growth impulses.[\[5\]](#_ftn_4d56b8e1_5) In addition, ageing of the population will also affect growth indirectly, for example through its impact on productivity.[\[6\]](#_ftn_4d56b8e1_6)**{#par-oo8984}
****Against this backdrop, the European Commission recommends that many central and eastern European** **Member States step up their reform efforts.** [\[7\]](#_ftn_4d56b8e1_7) Measures to increase productivity and innovation, as well as to improve human capital, are the primary focus. In addition, the European Commission is advocating for more efficient public administrations, more reliable institutional frameworks and a more favourable business environment. Improved knowledge and technology transfer between academia and the corporate sector and easier access to financing for innovative firms could also help to increase the growth potential.**{#par-a6o48a}
{#par-io18ui}
****
1. **{#_ftn_4d56b8e1_1} Bulgaria, Croatia, the Czech Republic, Estonia, Hungary, Latvia, Lithuania, Poland, Romania, Slovakia and Slovenia.**
2. **{#_ftn_4d56b8e1_2} Since 2021, the has been withholding funding payments to Hungary for violations of the rule of law. This also includes financial resources to promote investment under the programme. In May 2026, the European Commission announced that it would potentially release €16.4 billion of the previously withheld funds. See European Commission (2026a).**
3. **{#_ftn_4d56b8e1_3} See Aguiari et al. (2026). However, this price effect of the changeover was more than offset by the unwinding of base effects.**
4. **{#_ftn_4d56b8e1_4} See Council of the European Union (2026).**
5. **{#_ftn_4d56b8e1_5} See the European Commission's estimate of potential output in European Commission (2026b).**
6. **{#_ftn_4d56b8e1_6} See, for instance, Aiyar et al. (2016). These indirect effects comprise changes in business dynamics caused by demographic change (see Pugsley and Șahin (2019) and Falck et al. (2024)), which can impair the allocation of resources (see Deutsche Bundesbank (2024)).**
7. **{#_ftn_4d56b8e1_7} See European Commission (2026d).**
**2 Euro area activity surprisingly robust** {#tar-9}
-----------------------------------------------------
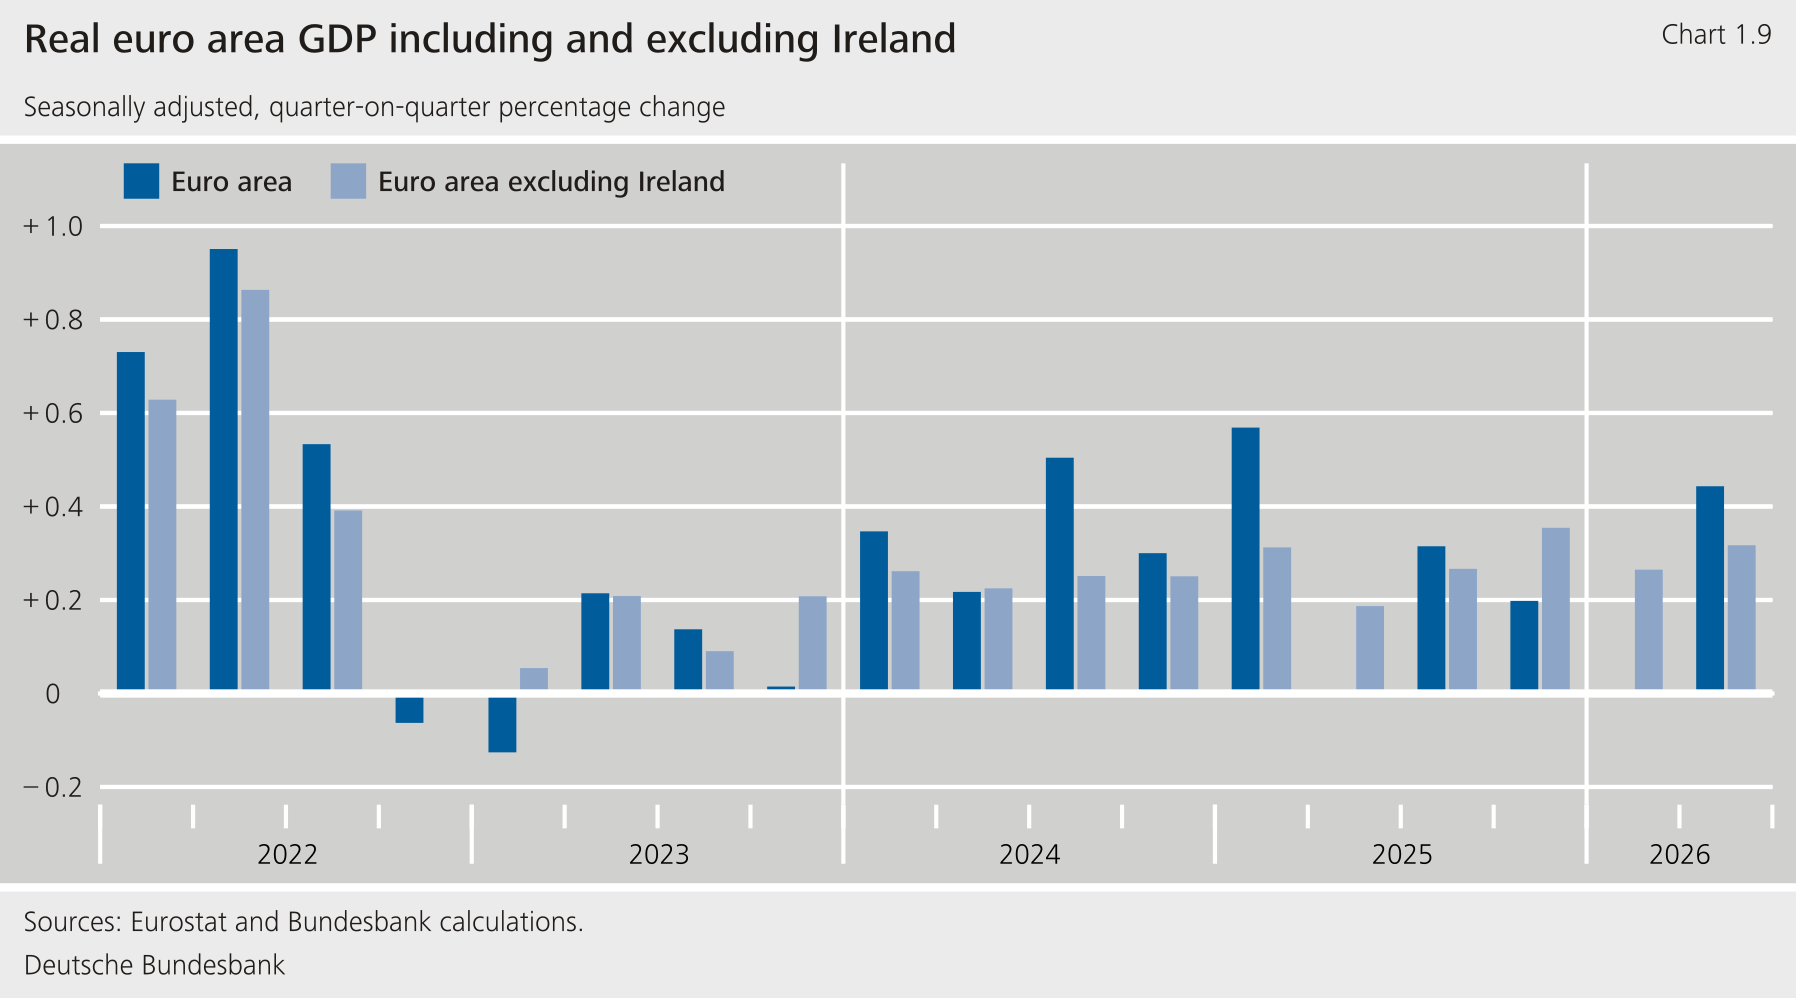
****Economic activity in the euro area held up better than expected in the second quarter of 2026.** According to Eurostat's flash estimate, real in the euro area increased by 0.4 %, having stagnated in the first quarter. Excluding Ireland from the calculations, which may make the results more meaningful (see the supplementary information entitled "The instability of Irish growth rates and its impact on the euro area analysis), growth was roughly the same as in the previous quarter, at 0.3 %. After the blockade of the Strait of Hormuz sent oil prices sharply upward, growth in the euro area was expected to weaken markedly, as also suggested by the surveys. There are a number of reasons for the unexpectedly sound growth. First, oil prices did not rise quite as sharply or for as long as initially feared. Second, orders were brought forward in various sectors in anticipation of rising prices. Competitive pressure from Asia eased temporarily as producers there had to scale back their output in some cases owing to supply outages from the Middle East. These developments mainly benefited the manufacturing sector, but also business-related services. By contrast, consumer restraint owing to higher energy prices primarily affected consumer-related service providers, although fiscal measures cushioned the impact somewhat here. In the second half of the year, government programmes to modernise public infrastructure and defence should continue to support economic growth. Consumer confidence also brightened perceptibly in July. However, the outlook for the rest of the year will depend largely on the further developments in the Persian Gulf.**{#par-e3ui77}
**The instability of Irish growth rates and its impact on the euro area economic analysis** {#tar-10}
-----------------------------------------------------------------------------------------------------
****Estimates of euro area real** **growth for the first quarter of 2026 fluctuated considerably between the preliminary and the current official data.** While the flash estimates initially showed a 0.1 % quarter-on-quarter increase in real after adjustment for seasonal and calendar effects, a decline of 0.2 % was reported following the subsequent publication of a more comprehensive dataset. According to current data, euro area stagnated in the first quarter.**{#par-oe2ao2}
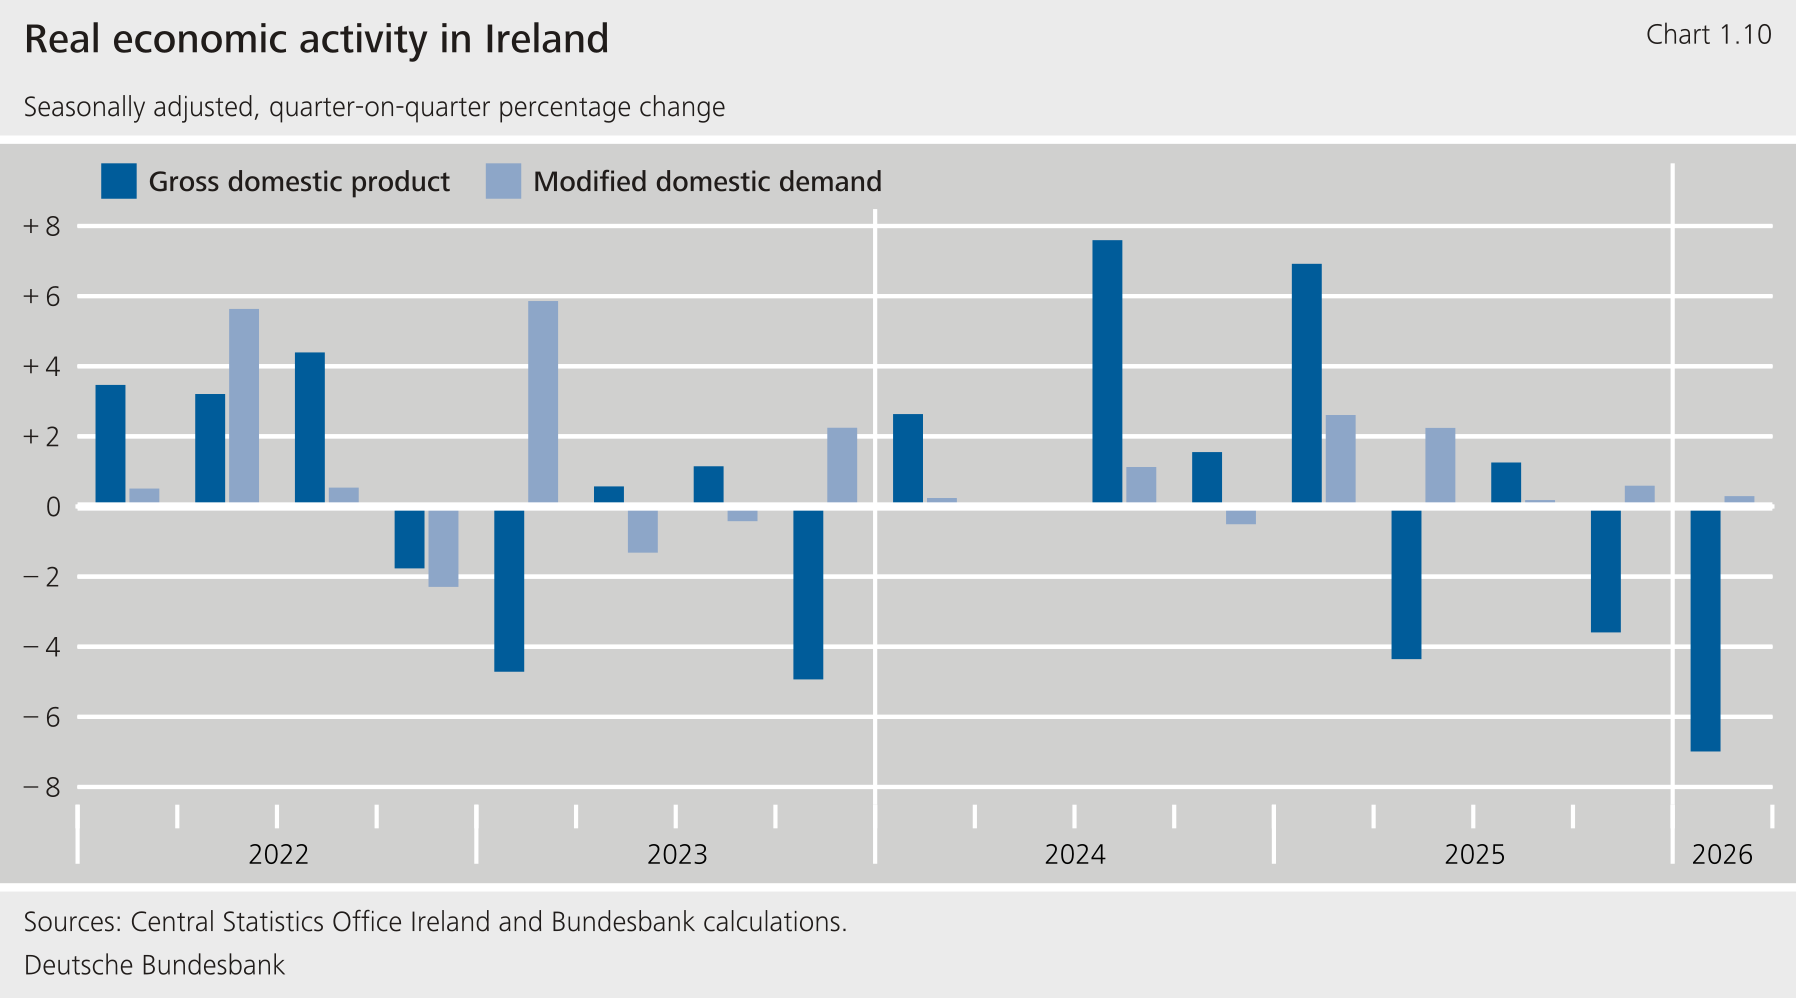
****The significant revisions to euro area** **in the first quarter of 2026 were driven by the exceptional instability of** **estimates by Ireland's Central Statistics Office.** According to the end-April preliminary estimate, Irish in the first quarter fell by a seasonally adjusted 2.0 % from the previous quarter. The early-June estimate put the decline at 12.1 %. The third estimate in early July reduced the decline to 7.0 %. By contrast, the rate of change in euro area excluding Ireland has only been revised up slightly to 0.3 % since the end of April. It therefore consistently showed growth that was broadly in line with estimated potential growth. Consequently, official data for the euro area as a whole fluctuated between a slight expansion and a decline, eventually indicating stagnation.**{#par-o67a82}
{#par-oa4o1a}
****
****Irish** **figures have been unusually volatile and subject to marked revision for several years now.** The volatility of Irish growth rates is significantly higher than that of other Member States. The standard deviation of quarterly rates has been 4.9 percentage points for Ireland since 2013, compared with 0.4 percentage point for the euro area excluding Ireland and 0.5 percentage point for Germany.[\[1\]](#_ftn_4d56b8f2_1) In addition, Irish growth rates were already heavily revised in the past. For the first quarter of 2025, for example, the flash estimate reported quarterly growth of 3.2 %. A month later, it was 9.7 %. According to the latest data, was up by 6.9 % over that period. Between January and July of this year, the 2025 annual result was revised downwards by around 5 percentage points (to 8.1 % instead of 13.3 %). No other euro area Member State had revisions on that scale.**{#par-eo2637}
****The expenditure components likewise testify to the high volatility and susceptibility to revision of Irish** **data.** This is particularly true of exports, imports and investment. Gross fixed capital formation was exposed to particularly strong swings. According to current data, for example, it went up by a price-adjusted 144 % in the third quarter of 2024, after declining by 36 % and 56 % in the two preceding quarters. The high volatility and susceptibility to revision of the Irish components also affects the corresponding euro area aggregates and makes them more difficult to interpret. In the euro area excluding Ireland, gross fixed capital formation fell steadily at a moderate pace from the fourth quarter of 2023 to the third quarter of 2024. In the euro area as a whole, by contrast, investment fell sharply in the first half of 2024 owing to the aforementioned very strong fluctuations in Ireland, but rose again significantly thereafter.**{#par-ou5uu7}
****The sharp swings and revisions in Irish** **figures since the beginning of 2025 are likely to be attributable to the manufacturing sector.** The strong growth at the beginning of 2025 was initially associated with high exports of pharmaceutical products.[\[2\]](#_ftn_4d56b8f2_2) Anticipatory effects in expectation of higher trade barriers vis-à-vis the United States, but also the expansion of production capacities in Ireland, were probably factors.[\[3\]](#_ftn_4d56b8f2_3) According to preliminary data, value added in the manufacturing sector also rose very sharply at the beginning of 2025. However, both the increase in exports as defined in the national accounts and the increase in value added in the manufacturing sector have recently been revised downwards markedly. In addition, in the first quarter of 2026, both categories saw a sharp decline that was significantly stronger than suggested by industrial production or goods exports. The Central Bank of Ireland therefore believes that the sharp fluctuations are likely to be attributable not only to production activities in the pharmaceutical industry in Ireland, but also to other activities of multinational manufacturing companies, particularly merchanting and contract manufacturing abroad.[\[4\]](#_ftn_4d56b8f2_4)**{#par-ui5ooa}
****Multinational enterprises are playing an increasingly important role in the Irish economy.** Many multinational companies are domiciled in Ireland for tax and regulatory reasons or manage their European business from Ireland. According to Ireland's Central Statistics Office, in 2024 almost half of total gross value added was attributable to sectors dominated by multinational enterprises. These include the chemical and pharmaceutical industry, the manufacture of computers and electronic and optical devices, publishing and services.[\[5\]](#_ftn_4d56b8f2_5) Whilst activities in Ireland were mainly administrative activities, in particular hubs for business activities in the , and innovation centres (research and development), pharmaceutical groups have major manufacturing plants in Ireland. Multinational enterprises employ just over one-fifth of Ireland's workforce[\[6\]](#_ftn_4d56b8f2_6) and account for around one-third of wage income.[\[7\]](#_ftn_4d56b8f2_7) In addition, they accounted for 87 % of corporation tax in 2025, and thus 22 % of total tax revenue.[\[8\]](#_ftn_4d56b8f2_8)**{#par-u417i9}
****The adequate statistical classification of multinational enterprises' cross-border activities poses major problems for national economic statistics.** Multinational enterprises regularly operate across national borders, and many cross-border transactions take place within these enterprises. This poses particular challenges for the national statistical offices in obtaining, classifying and assessing the relevant information. To accomplish this in a reasonably consistent manner, international standards exist for the accounting of such activities in the balance of payments and in the national accounts.[\[9\]](#_ftn_4d56b8f2_9) For the , these requirements were fleshed out in 2010.[\[10\]](#_ftn_4d56b8f2_10)**{#par-a46eae}
****Ownership rights "in the economic sense", i.e. the responsibility of an organisational unit for the benefits and risks arising from economic activity, are crucial for classifying value added in the national accounts.** Although economic and legal property may differ, in statistical practice, it will probably be hard to disentangle the two concepts. Nevertheless, the legal form is likely to be crucial for classification.[\[11\]](#_ftn_4d56b8f2_11) With regard to the definition of trade in goods in the national accounts, it follows from the ownership principle that imports and exports are defined as transactions where economic ownership is transferred between a resident and a non-resident unit. The physical crossing of borders by the goods is neither a necessary condition nor a sufficient condition. In line with this principle, special purpose vehicles () that are subordinate to a larger company and in many cases have neither significant staffing nor production facilities can also be classified as resident producers.[\[12\]](#_ftn_4d56b8f2_12) If, for example, intellectual property rights are transferred to such companies, income from licences generated abroad with the use of labour and tangible capital is counted as the domestic product of the country in which the is domiciled. Organisational decisions by multinational groups can therefore lead to abrupt shifts in the classification of value added. In addition, internal pricing (intra-group transfer prices) plays a role in the amount of added value, such as the recognition of licence fees or the costs of inputs sourced from abroad.[\[13\]](#_ftn_4d56b8f2_13)**{#par-a2o693}
****The statistical offices are addressing these challenges, amongst other things, by establishing Large Cases Units, which provide a coherent picture of transactions in large multinational enterprises.** [\[14\]](#_ftn_4d56b8f2_14) Large Cases Units aggregate data from various sources, check for discrepancies and clarify inconsistencies with multinational enterprises.[\[15\]](#_ftn_4d56b8f2_15) The results of these evaluations are incorporated into the national accounts. In Ireland, the Large Cases Unit was set up as early as 2009. It covers around 40 multinational enterprises.[\[16\]](#_ftn_4d56b8f2_16) The Federal Statistical Office set up such a unit in 2020.**{#par-i9ui39}
****Nevertheless, adequately capturing and defining the domestic economic activity of multinational enterprises remains a challenge.** [\[17\]](#_ftn_4d56b8f2_17) This applies, in particular, to the classification of economic ownership in contract manufacturing and merchanting as well as to the derivation of domestic value added.[\[18\]](#_ftn_4d56b8f2_18) Inconsistencies between immediately available data and data available only later on can lead to significant revisions in the national accounts. These problems are shared by all statistical offices. However, they are particularly visible in Ireland because of the outsized role played by multinational enterprises.**{#par-u253aa}
****Where multinational enterprises have a strong weight, the information content of the national accounts for economic analysis may be limited.** This is because multinational enterprises often produce across borders and the national accounts focus on economic ownership. The geographical classification of value added then also depends on those firms' business and organisational decisions. The intra-group cost allocation and transfer prices determine the amount of value added attributed to individual locations. This means that value added can be reported in countries where no manufacturing activity in the narrower sense takes place, but only ownership rights are managed. The items reported in the statistics can thus deviate massively from those which are of particular interest for economic analysis, such as production and income generation using labour and capital, and cross-border trade in goods.[\[19\]](#_ftn_4d56b8f2_19)**{#par-ii4u53}
****Given the limited informative value of Irish** **data, Irish authorities use alternative measures of economic activity to assess the state of the economy.** "Modified gross national income" is often used as an alternative measure of economic development.[\[20\]](#_ftn_4d56b8f2_20) For this purpose, the profits of international groups are deducted from . In addition, "modified domestic demand" is reported.[\[21\]](#_ftn_4d56b8f2_21) This excludes, amongst other things, investment in intellectual property rights and leased aircraft. Both areas are dominated by multinational enterprises and fluctuate strongly. Modified domestic demand is much more steady than and is also less prone to revision. According to the latest data, it increased moderately in the first quarter of 2026 and the fourth quarter of 2025, at 0.3 % and 0.6 % respectively.**{#par-iu1a63}
{#par-o4i57i}
****
****The problems with Irish economic statistics also make it more difficult to assess the state of the economy in the euro area using data published by** . Even with Ireland's low share of euro area of just under 4 %, the highly volatile and revision-prone rates of change in Irish have a marked impact on the euro area aggregates on account of their size. That is because the underlying activities of multinational enterprises typically affect non-euro area countries, especially China and the United States. There are therefore no offsetting movements in data from other euro area countries. This makes it more difficult to assess the economic situation on the basis of the data published by for the euro area as a whole. As in Ireland, modified domestic demand could be used as an alternative to . However, this would only be an alternative for and certain demand-side components. On the other hand, economic analysis is based on the broad range of national accounts data, including data on the supply-side composition of , employment and wage income. For this reason, it seems more appropriate in many cases to use aggregates for the euro area excluding Ireland. This is what we have been doing in the Bundesbank's quarterly reports on the economic situation in euro area since 2018.**{#par-i1743a}
1. **{#_ftn_4d56b8f2_1} The first three quarters of 2020 were not included in the calculation owing to the severe turmoil associated with the ‑19 pandemic.**
2. **{#_ftn_4d56b8f2_2} See Central Bank of Ireland (2025). According to the foreign trade statistics, exports of polypeptides, an input for the manufacture of medical weight loss products, have increased considerably since mid-2024. In the fourth quarter of 2024, they already stood at €7 billion, and in the first quarter of 2025 they were €33 billion.**
3. **{#_ftn_4d56b8f2_3} See Central Bank of Ireland (2025).**
4. **{#_ftn_4d56b8f2_4} See Central Bank of Ireland (2026a). Contract manufacturing is when a resident firm only places a production order with a non-resident firm. This is then manufacturing performed for a fee, but without a transfer of economic ownership. For more details on how merchanting and contract manufacturing are captured in the national accounts pursuant to 2010, see Deutsche Bundesbank (2018) and the sources cited therein.**
5. **{#_ftn_4d56b8f2_5} See Central Statistics Office (2025a).**
6. **{#_ftn_4d56b8f2_6} See Central Statistics Office (2024).**
7. **{#_ftn_4d56b8f2_7} See FitzGerald and O'Shea (2026).**
8. **{#_ftn_4d56b8f2_8} See Cronin (2026a, 2026b), Central Bank of Ireland (2026b) and Central Statistics Office (2025b).**
9. **{#_ftn_4d56b8f2_9} See United Nations (2009) and International Monetary Fund (2009).**
10. **{#_ftn_4d56b8f2_10} See European Union (2013).**
11. **{#_ftn_4d56b8f2_11} See Deutsche Bundesbank (2018).**
12. **{#_ftn_4d56b8f2_12} See Deutsche Bundesbank (2018).**
13. **{#_ftn_4d56b8f2_13} For a more detailed description, see Deutsche Bundesbank (2018) as well as Hörner et al. (2022).**
14. **{#_ftn_4d56b8f2_14} See Hussain et al. (2019), Spies et al. (2020) and Ahlborn et al. (2021).**
15. **{#_ftn_4d56b8f2_15} This is done using foreign trade data, data from the balance of payments statistics, surveys on production and sales, and data from the tax offices.**
16. **{#_ftn_4d56b8f2_16} See Central Statistics Office (2019).**
17. **{#_ftn_4d56b8f2_17} See Hörner et al. (2022).**
18. **{#_ftn_4d56b8f2_18} See Hörner et al. (2022) and Connolly (2011).**
19. **{#_ftn_4d56b8f2_19} See FitzGerald (2023) and FitzGerald and O'Shea (2026).**
20. **{#_ftn_4d56b8f2_20} See Central Statistics Office (2016, 2017).**
21. **{#_ftn_4d56b8f2_21} See Central Statistics Office (2021) and Casey (2023).**
****Private consumption was subdued but resilient against the backdrop of higher energy prices.**Retail sales continued to rise in price-adjusted terms. Only fuels saw a significant decline. Government support measures such as the petrol price brake in Germany and the reduction of excise duties in Italy and Spain, for example, are likely to have prevented a larger dampening effect. Over the course of the quarter, consumer confidence recovered somewhat from its slump in March and April. However, households' expectations regarding their own financial situation remained gloomy. At the same time, the number of motor vehicle registrations rose significantly, especially for electric cars. Alongside the prospect of persistently higher fuel prices, various government incentives for the purchase of electric motor vehicles probably played a role here.**{#par-e45oi2}
****Investment activity recovered in the second quarter following the decline at the beginning of the year.** Construction activity appears to have picked up somewhat; in building construction, it seems to be expanding again. In any case, construction output in this segment grew markedly after a prolonged period of weakness lasting until May, and the number of residential building permits rose in the first quarter. Spending on infrastructure probably provided construction investment with an additional boost. Investment in machinery and equipment is also thought to have expanded. The marked rise in longer-term loans to enterprises in the second quarter suggests that firms need more funds for fixed investment. Capital goods producers' sales within the euro area also rose significantly in price-adjusted terms, and imports of capital goods from third countries rose sharply. Expenditure on information and communication technologies, as well as on intellectual property products, are likely to have continued to increase on the back of the digitalisation trend.**{#par-a85955}
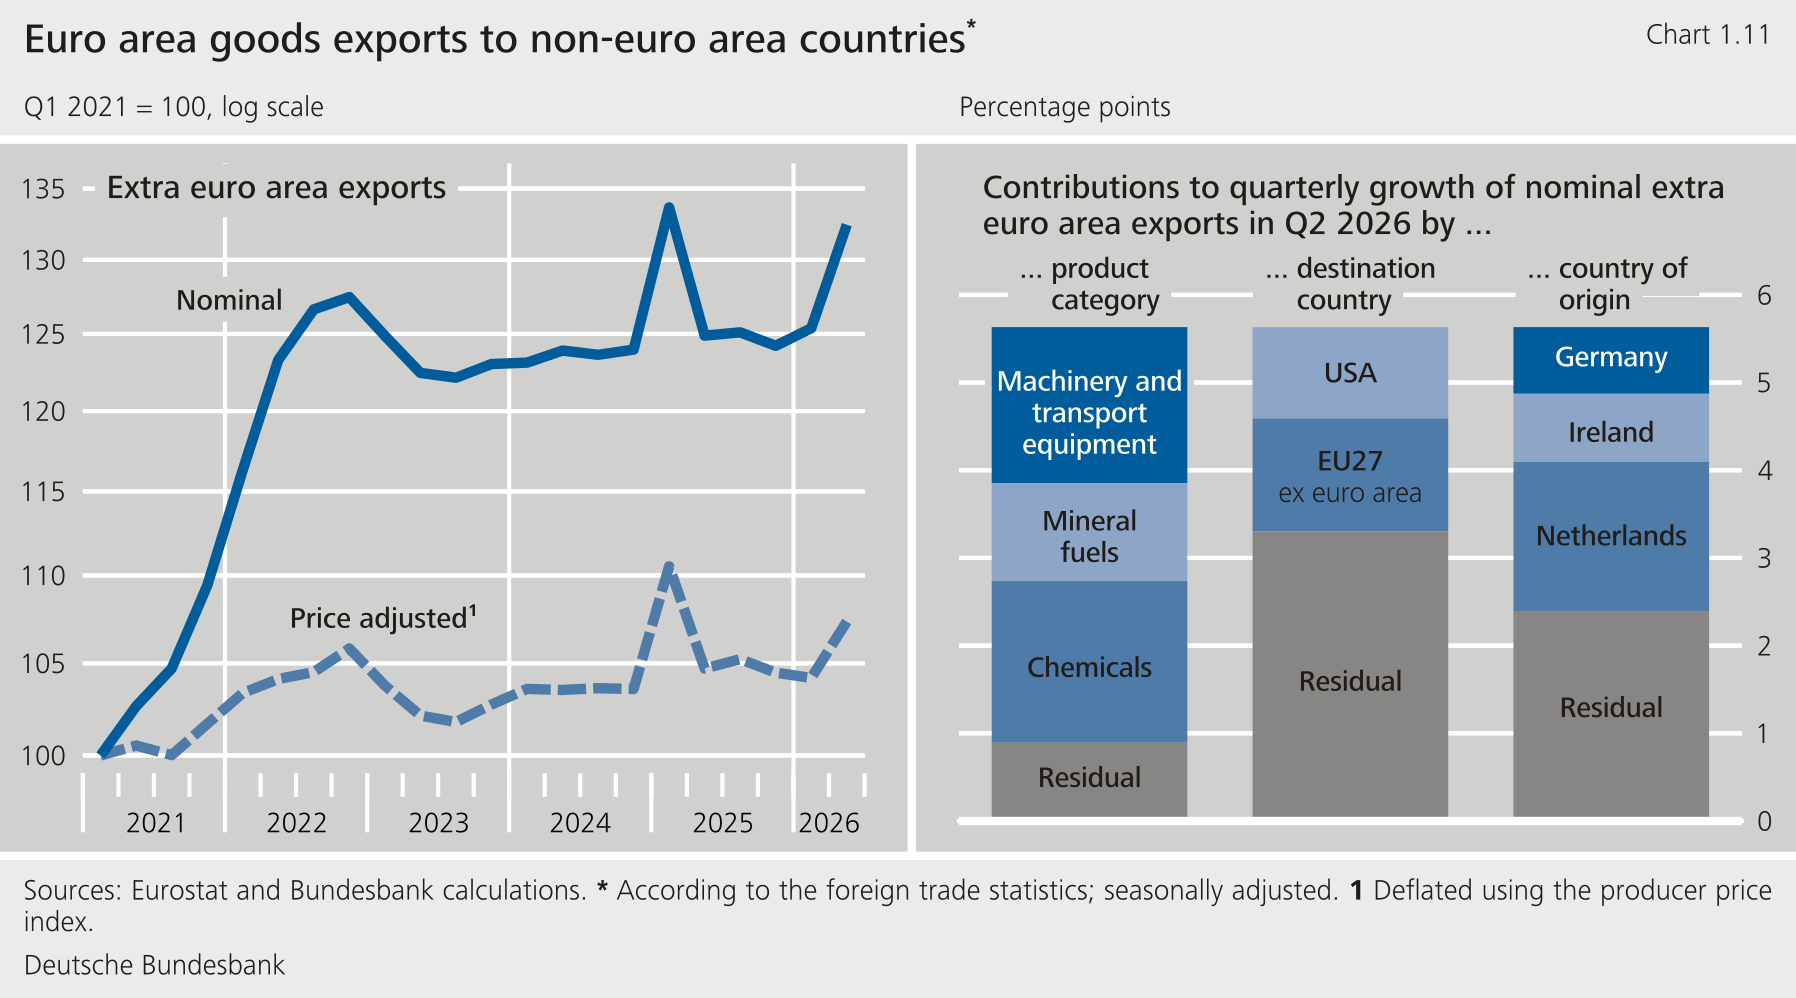
****Exports of goods to third countries grew briskly in the second quarter, having fallen in the winter half-year.** According to data from the trade balance, exports increased sharply in price-adjusted terms in the second quarter. Part of this increase was attributable to temporary or country-specific developments. First, oil trade in Dutch ports became more important given the closure of the Strait of Hormuz. Second, exports of pharmaceutical products from Ireland to the United States rose considerably. In addition, however, trade with countries outside the euro area increased. Exports to China likewise rose significantly following a setback in the previous quarter. Broken down by goods category, the increase in intermediate and capital goods was particularly pronounced. Imports of goods also picked up noticeably, but less strongly than exports. Imports of intermediate goods, in particular, but also capital goods, expanded significantly compared with the first quarter.**{#par-e57537}
{#par-oae17u}
****
****Production in the manufacturing sector rose.** The production of intermediate inputs expanded markedly. Capital goods production also rose, although the manufacture of motor vehicles fell. By contrast, there was a substantial increase in consumer goods production, especially in pharmaceutical products. According to surveys conducted by the European Commission, new orders from domestic and foreign customers increased and the order books improved markedly. Temporary factors probably contributed to this. some sectors benefited from orders brought forward owing to fears of shortages; on the other, competitive pressure temporarily eased for European firms since their Asian competitors were struggling with sharper price increases or disruptions to the supply chain.[\[4\]](#_ftn_root_4) Nevertheless, survey indicators for order books and export orders remained below their long-term averages. This is probably also due to the higher trade tariffs in trade with the United States. Price pressures at the producer level intensified as energy prices rose. Producer prices increased significantly compared with the previous quarter and the previous year.**{#par-i4894o}
{#par-e72a8o}
**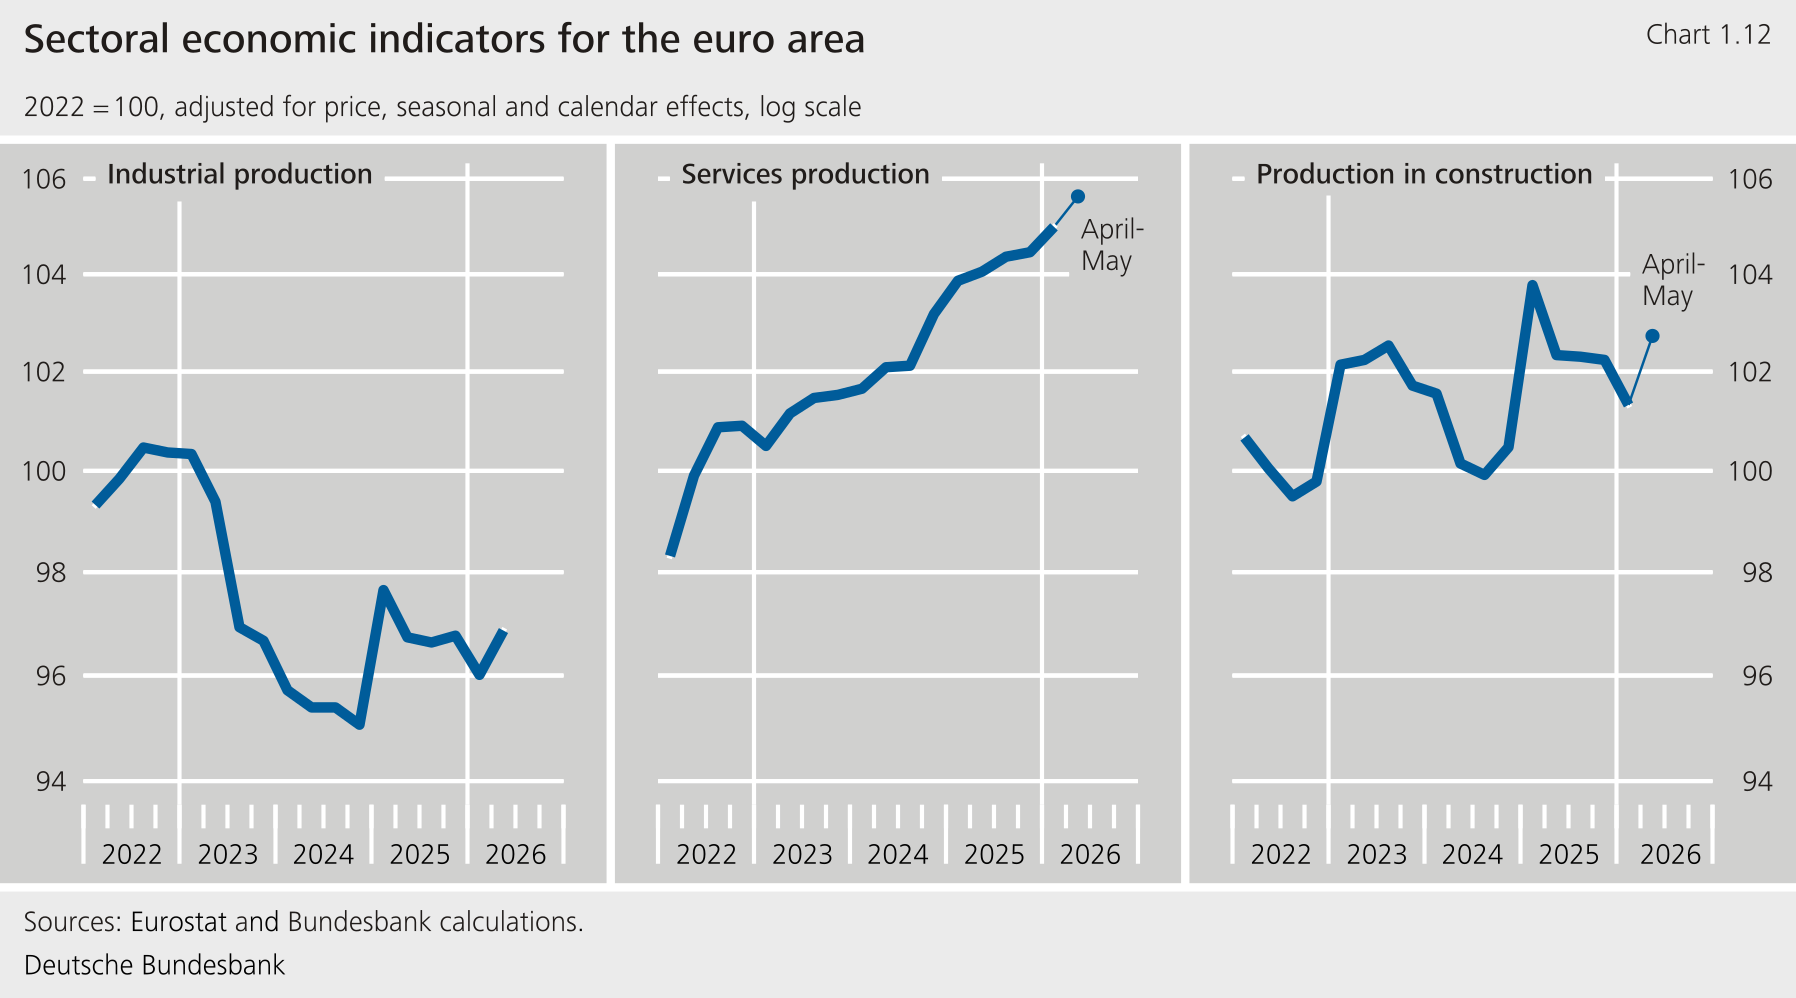**
****The expansion in the services sector appears to have continued.**In the transportation and storage sector, business activity is likely to have risen sharply. In addition, it probably also increased in the information and communication sector, as well as in real estate. By contrast, activity in the hotel and restaurant sector appears to have slackened. Subdued activity in tourism probably contributed to the weakness in the hotel and restaurant sector. Business sentiment among travel service providers has recently deteriorated markedly, at least.**{#par-o54528}
****The economy in most of the larger Member States proved resilient despite higher energy prices.**Exports, in particular, rose surprisingly sharply in many places. In addition, despite the significant rise in energy costs, private consumption remained slightly tilted to the upside in many countries, in some cases probably owing to government relief measures. Developments in investment were fairly varied, however.**{#par-i3e6e1}
****Economic output increased in the major euro area countries.** In France, real rose moderately, mainly off the back of strong exports, having fallen slightly in the previous quarter. Aircraft construction is likely to have been a key factor here. Private consumption also held up surprisingly well in the face of the energy price shock. Italy's economy continued to grow, albeit at a slower pace. Growth was again supported mainly by the domestic economy. However, private consumption and investment are likely to have lost some momentum owing to higher energy prices and heightened uncertainty. Economic growth in Spain remained fairly strong, supported by domestic demand. In Germany, growth continued at a lower rate (see the article entitled "The German Economy").**{#par-ei35e1}
{#par-a43e9i}
**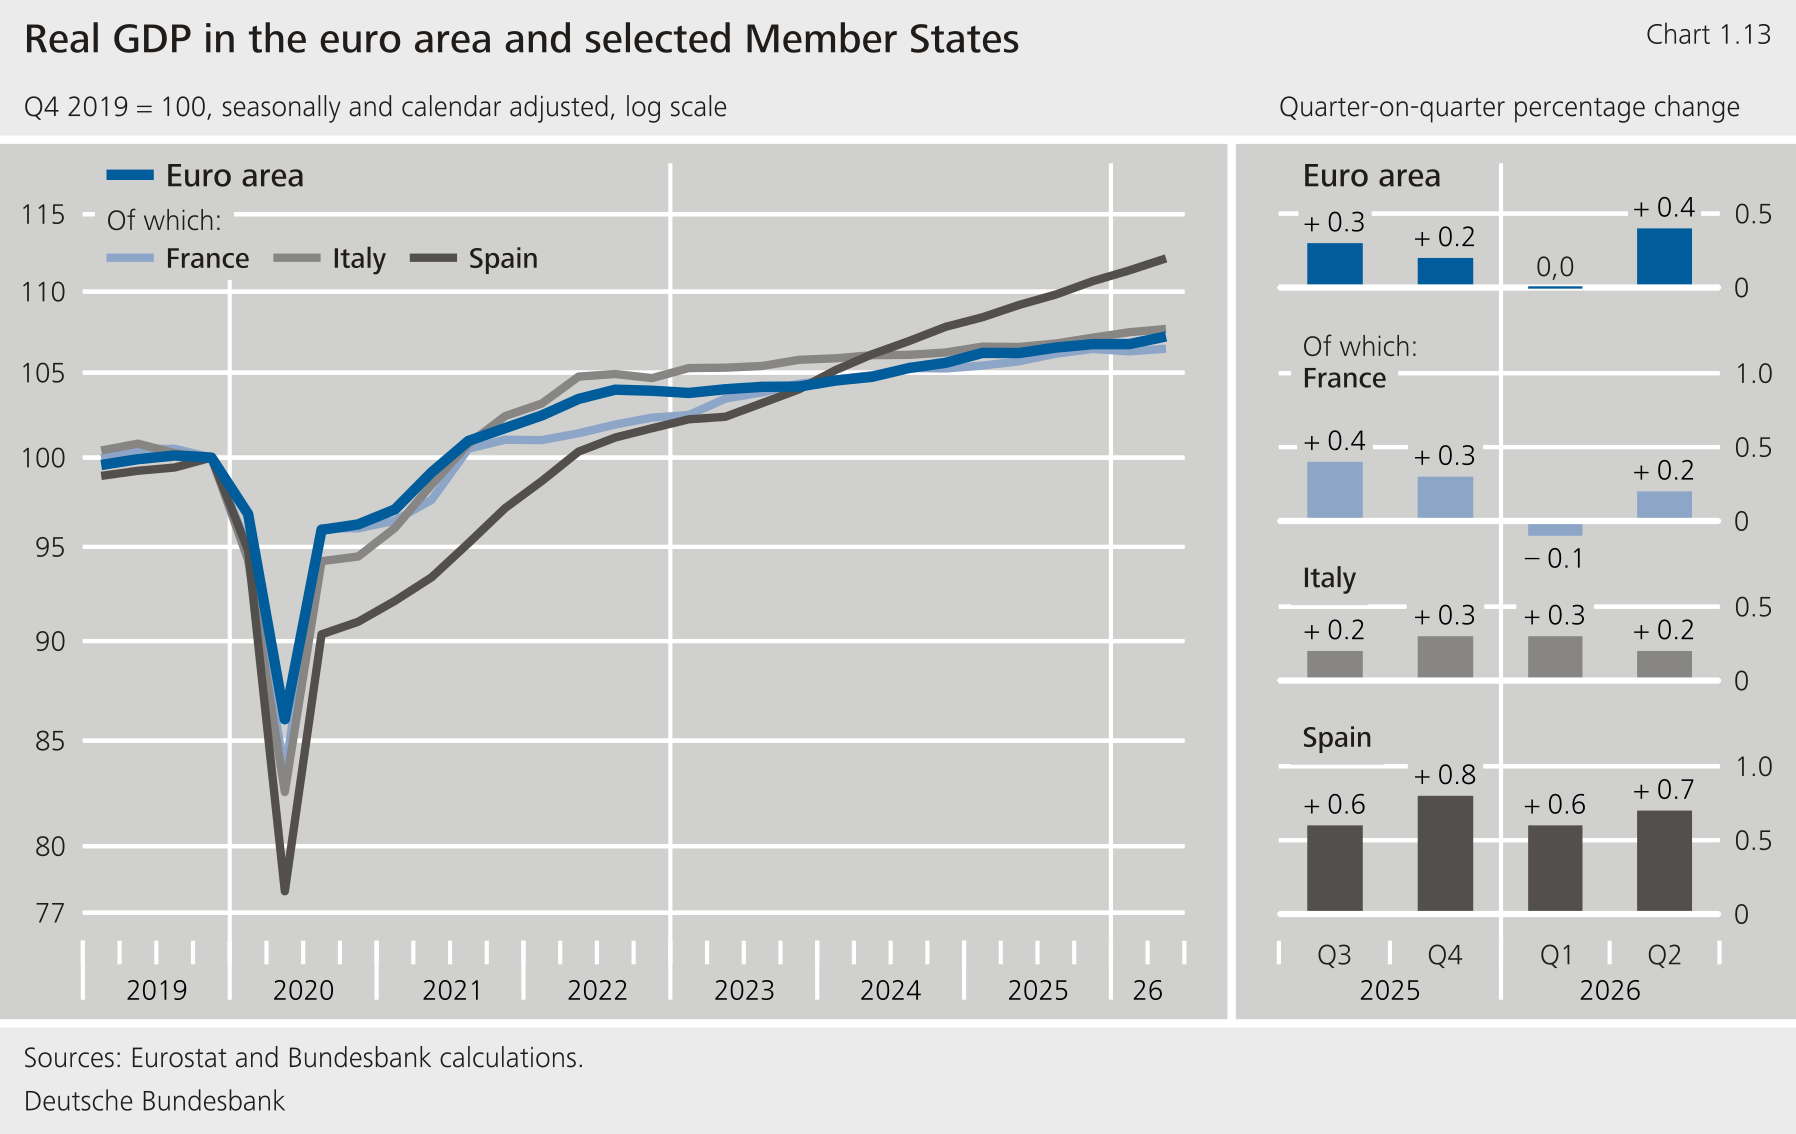**
****The picture was mixed in the other Member States, but economic output rose visibly in most cases.** Real expanded markedly in several countries, including the Netherlands, Ireland, Portugal, Finland, Slovenia, Bulgaria, Lithuania and Estonia. It increased slightly in Slovakia, but stagnated in Belgium and Austria.**{#par-a424i4}
****There are growing signs of a certain deterioration in the labour market.**Unemployment remained at a low level of 6.3 %, employment increased marginally again, and the vacancy rate fell. At the same time, labour hoarding became more prevalent. Having slowed markedly until mid-2025, wage growth is likely to have eased again in the second quarter of 2026; heightened consumer price pressures have not yet led to an acceleration in wage growth.**{#par-i5e7u2}
****Euro area consumer prices rose sharply in the second quarter of 2026 as the conflict in the Middle East escalated.** The rose by a seasonally adjusted 1.1 % on the quarter, having already increased markedly by 0.8 % in . This was mainly due to sharp price increases in the energy sector, especially for petroleum products. Services prices also continued to rise significantly in the second quarter.[\[5\]](#_ftn_root_5) Although non-energy industrial goods inflation was somewhat stronger than in the previous quarter, it remained moderate overall. By contrast, food price pressures eased significantly, probably owing in part to the delayed pass-through of the previous decline in commodity prices for agricultural goods. So far, potential indirect effects of the energy price surge on other components of the , particularly food and non-energy industrial goods, have barely been noticeable. These usually materialise with a significant delay.[\[6\]](#_ftn_root_6)**{#par-ao6iie}
{#par-a1o864}
**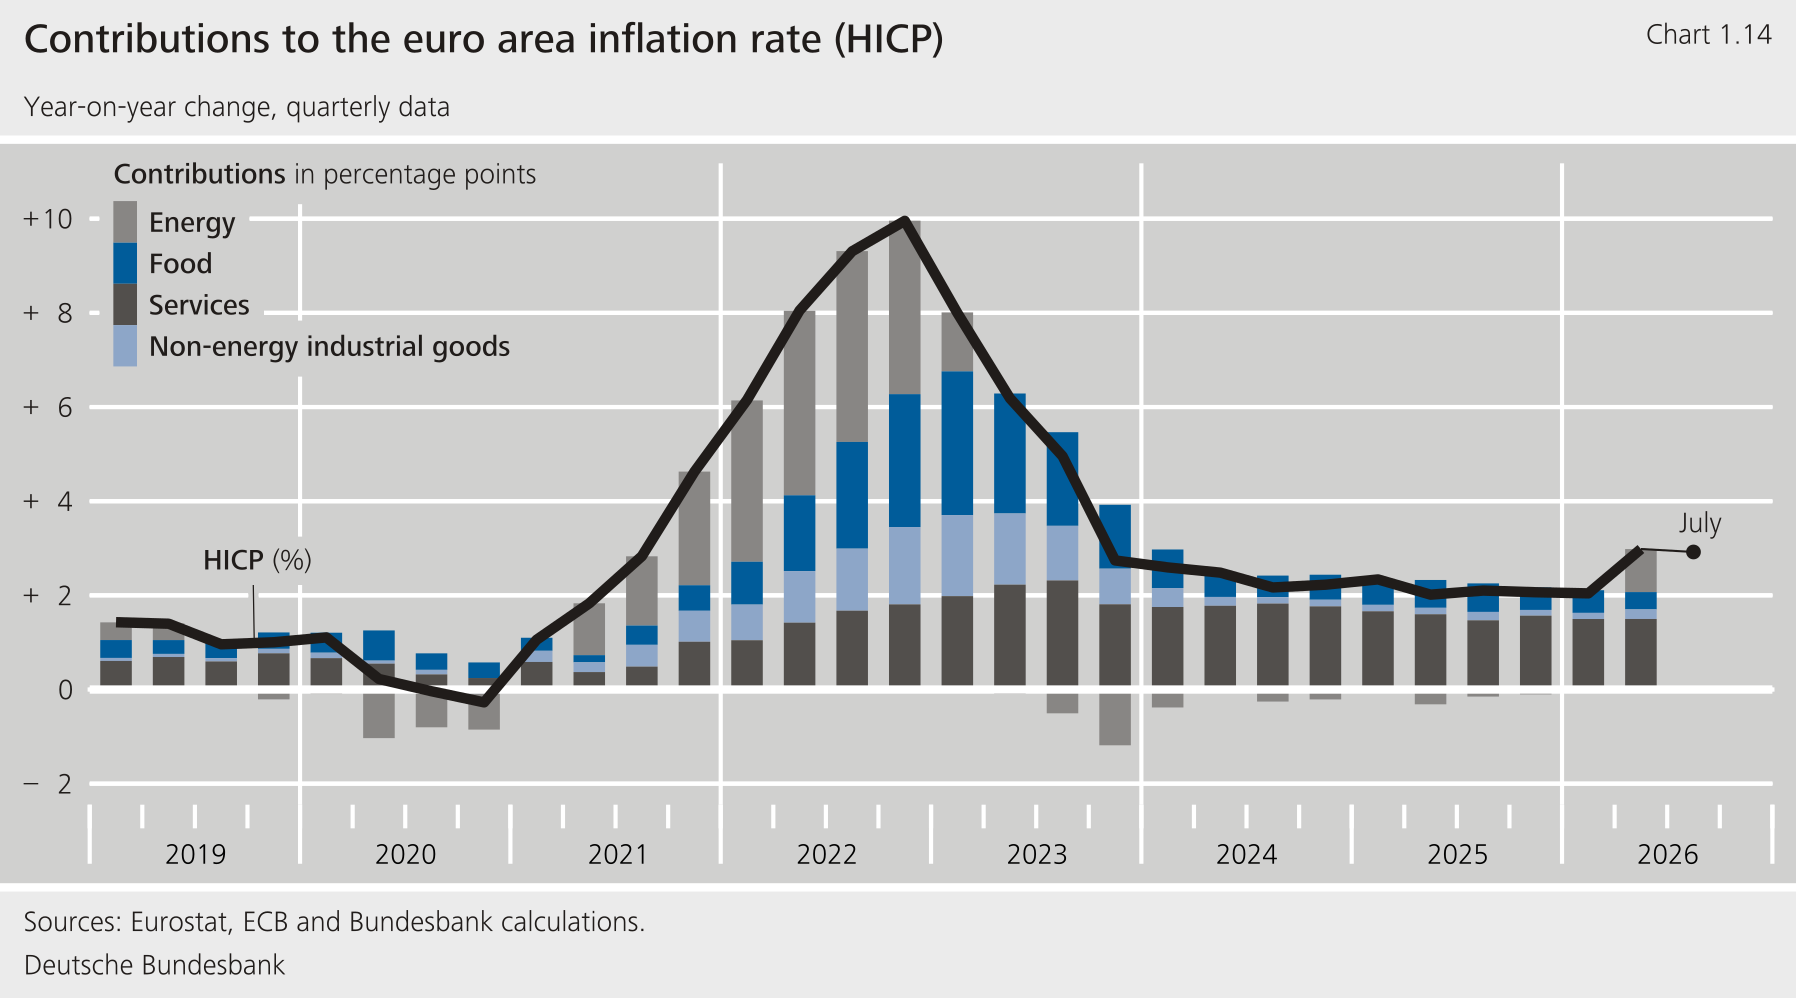**
****Inflation increased significantly to 3.0 % in the second quarter.** This was mainly due to the sharp rise in rise in energy prices, which surged to 10 %. Food inflation declined markedly to 1.9 %, however. Among the less volatile components, services inflation edged down to 3.2 %, while non-energy industrial goods inflation rose to 0.8 %. As a result, core inflation excluding energy and food increased slightly to 2.4 %.**{#par-i347eu}
****Inflation went up slightly in July 2026.** It reached 2.9 %, compared with 2.8 % the month before. Having declined in June, energy inflation, in particular, intensified again as a result of renewed military conflicts in the Middle East. In addition, a number of government measures to provide relief from high energy prices expired at the end of June. Food price inflation continued to ease. By contrast, non-energy industrial goods and services inflation rose somewhat. The core rate was therefore also somewhat higher, at 2.5 %.**{#par-i3ou6u}
****The short-term inflation outlook for the euro area remains very uncertain given the ongoing conflict in the Middle East.**The path of inflation over the next few months will depend heavily on further developments in the conflict in the Middle East and the resulting restrictions on the energy supply. Disruptions to refining capacity will probably continue to affect the supply of petroleum products. Petrol and diesel could therefore remain higher than might actually be expected based on crude oil prices. The longer the conflict persists, the more likely it is that higher energy costs will spill over to other goods and services.**{#par-u79aiu}
{#par-iia27u}
**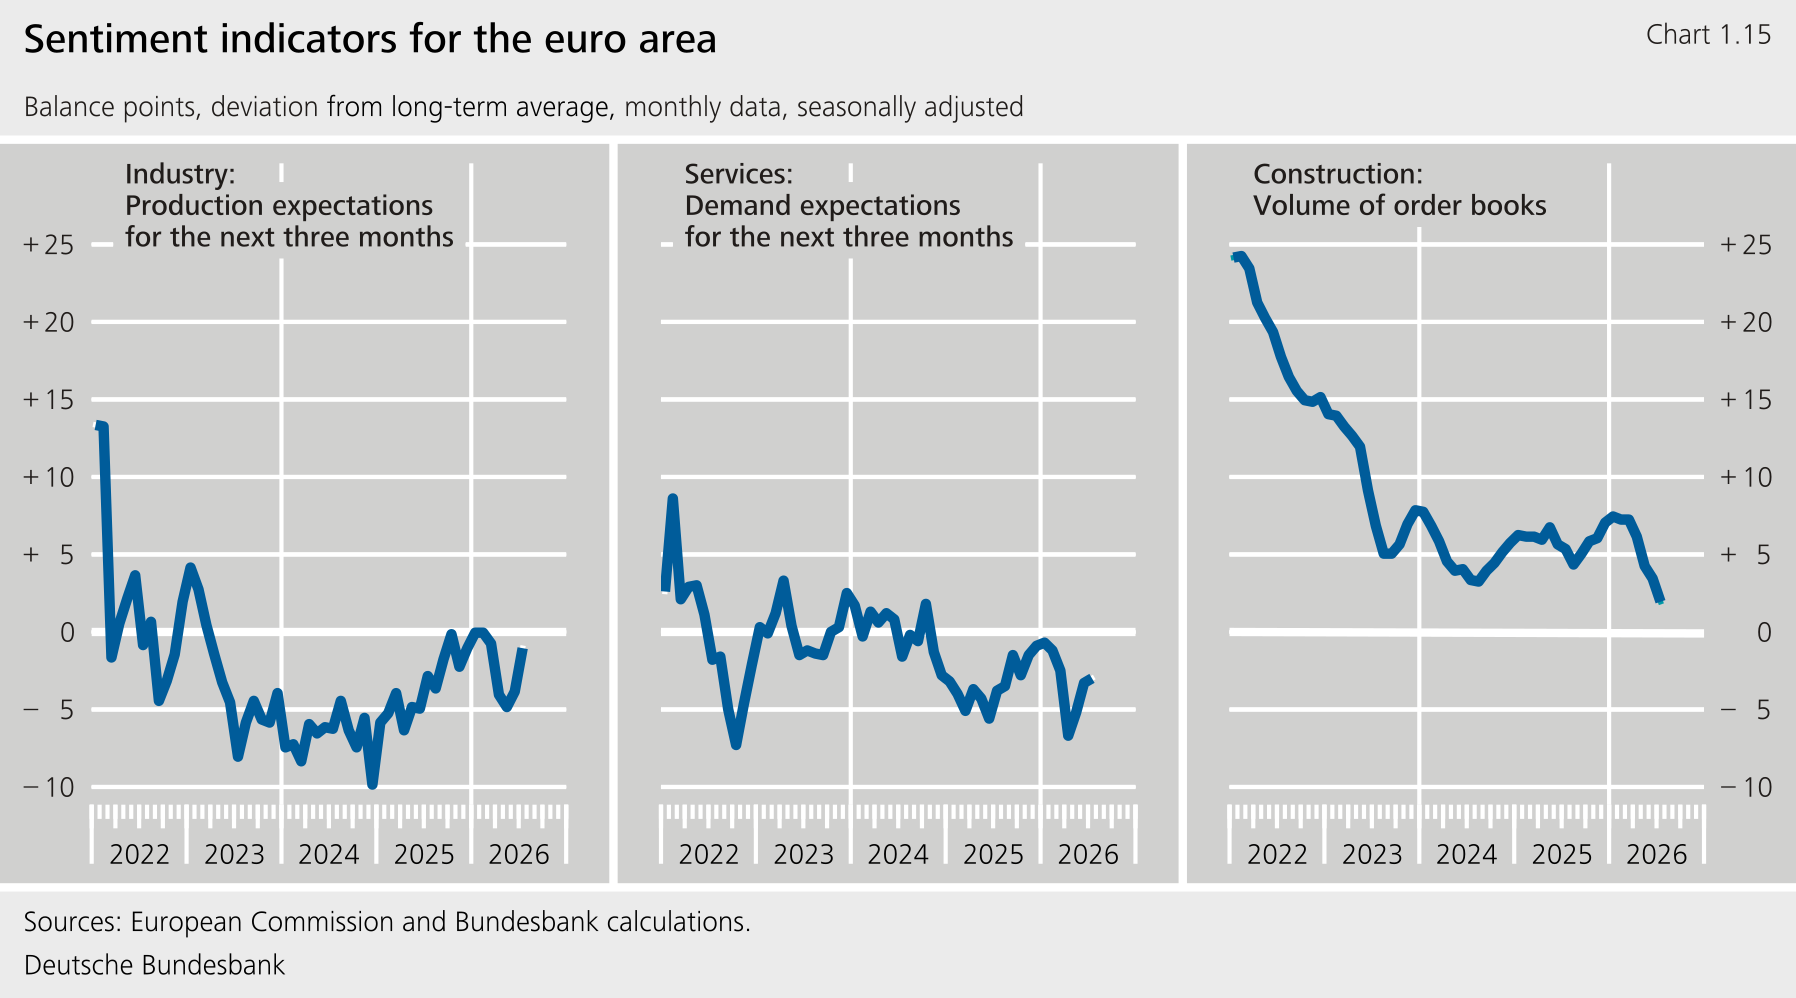**
****For the second half of the year, there is currently much to suggest that growth will continue to be moderate and uncertainty will remain high.** Sentiment indicators extending up to July point to a more positive assessment of the macroeconomic situation. Sentiment improved both among service providers and in industry. This also included expectations for the coming months. Even consumer confidence continued to brighten from a low level. Surveys showed that consumers' willingness to make major purchases rose markedly. The robust global economy should continue to support exports, although the euro area might not reap the full benefits of this owing to its weak competitive position. Moreover, private and public investment in digital transformation, the green transition, energy and commodity security and defence are supporting economic activity. Overall, the euro area economy could continue to grow at a moderate pace in the coming months. However, given the major uncertainty surrounding the course of the conflict in the Middle East and the resulting fluctuations in energy prices, as well as ongoing trade and geopolitical tensions, downside risks predominate.**{#par-a89355}
**List of references** {#tar-11}
--------------------------------
**Aguiari, G., M. Falagiarda, C. Gartner and E. Ivanova (2026), [Euro adoption and price increases in Bulgaria: separating myths from facts](https://www.ecb.europa.eu/press/blog/date/2026/html/ecb.blog20260409~cc951a0d29.en.html), European Central Bank, The Blog, 9 April 2026.**{#par-i3i11e}
**Ahlborn, M., F. Draken and V. Schulz (2021), [Qualitätssicherung in der amtlichen Statistik: Large Cases Unit](https://www.destatis.de/DE/Methoden/WISTA-Wirtschaft-und-Statistik/2021/02/qualitaetssicherung_022021.html), Federal Statistical Office, -- Wirtschaft und Statistik, Issue 2/2021.**{#par-ua8u55}
**Aiyar, S., C. Ebeke and X. Shao (2016), [The Impact of Workforce Aging on European Productivity](https://doi.org/10.5089/9781475559729.001), International Monetary Fund, Working Paper 16/238.**{#par-a66331}
**Casey, E. (2023), [Ireland's modified domestic demand: what it tells us and where we should be cautious](https://www.fiscalcouncil.ie/analytical-notes/), Irish Fiscal Advisory Council, Analytical Note, No 19.**{#par-o5i518}
**Central Bank of Ireland (2025), [Quarterly Bulletin, No. 2 2025](https://www.centralbank.ie/publication/quarterly-bulletins/quarterly-bulletin-q2-2025).**{#par-i5i1i9}
**Central Bank of Ireland (2026a), [Quarterly Bulletin, No 2 2026](https://www.centralbank.ie/publication/quarterly-bulletins/quarterly-bulletin-q2-2026).**{#par-o73ui2}
**Central Bank of Ireland (2026b), [A Concentrated Tax Base and Rising Expenditure: Fiscal Risks in Ireland's Medium-Term Outlook](https://www.centralbank.ie/publication/quarterly-bulletins/signed-articles), Signed Article, Vol. 2026 (5), pp. 1-41.**{#par-u11828}
**Central Statistics Office (2016), [Report of the Economic Statistics Review Group ()](https://www.cso.ie/en/csolatestnews/eventsconferencesseminars/resrg/), December 2016.**{#par-oo71a8}
**Central Statistics Office (2017), [Central Statistics Office () Response to the Main Recommendations of the Economic Statistics Review Group ()](https://www.cso.ie/en/csolatestnews/eventsconferencesseminars/resrg/), February 2017.**{#par-i3aeu1}
**Central Statistics Office (2019), [Large Cases Unit in the Irish NSI](https://unece.org/sites/default/files/datastore/fileadmin/DAM/stats/documents/ece/ces/ge.20/2019/mtg1/4_Ireland_LCU.pdf), United Nations Economic Commission for Europe, presentation.**{#par-o3898u}
**Central Statistics Office (2021), [Total Domestic Demand and Modified Total Domestic Demand](https://www.cso.ie/en/interactivezone/statisticsexplained/nationalaccountsexplained/totaldomesticdemandandmodifiedtotaldomesticdemand/), National Accounts Explained.**{#par-o9u65a}
**Central Statistics Office (2024), [Business in Ireland 2022 -- Summary Results](https://www.cso.ie/en/releasesandpublications/ep/p-biisr/businessinireland2022summaryresults/).**{#par-i52936}
**Central Statistics Office (2025a), [Output and Value Added by Activity 2024.](https://www.cso.ie/en/releasesandpublications/ep/p-naova/outputandvalueaddedbyactivity2024/eumemberstatecomparisons/)**{#par-ua2ai1}
**Central Statistics Office (2025b), [Ireland's Tax Statistics 2024](https://www.cso.ie/en/releasesandpublications/ep/p-itxs/irelandstaxstatistics2024/).**{#par-i9e8ui}
**Connolly, M. (2011), ['s Large Cases Unit -- A strategy for dealing with Multinationals and Globalization](https://www.bis.org/ifc/events/2011_dublin_73_05_connolly.pdf).**{#par-u86o12}
**Council of the European Union (2026), [Council Decision on the existence of an excessive deficit in Bulgaria](https://data.consilium.europa.eu/doc/document/ST-10952-2026-INIT/en/pdf), 10952/26, 3 July 2026.**{#par-e7823i}
**Cronin, B. (2026a), [More concentration, more risk: three firms account for almost half of Ireland's corporation tax revenues](https://www.fiscalcouncil.ie/more-concentration-more-risk-three-firms-account-for-almost-half-of-irelands-corporation-tax-revenues/), Irish Fiscal Advisory Council, 19 February 2026.**{#par-o6ia4i}
**Cronin, B. (2026b), [More than corporation tax: Ireland's growing reliance on foreign-owned multinationals](https://www.fiscalcouncil.ie/more-than-corporation-tax-irelands-growing-reliance-on-foreign-owned-multinationals/), Irish Fiscal Advisory Council, 26 June 2026.**{#par-i82oe9}
**Deutsche Bundesbank (2018), [Monthly Report - October 2018](https://www.bundesbank.de/content/764250), Monthly Report, October 2018, pp. 65‑78.**{#par-u26o54}
**Deutsche Bundesbank (2024), [Developments in euro area business dynamism](https://publikationen.bundesbank.de/content/928128), Monthly Report, March 2024.**{#par-o7u5ia}
**Deutsche Bundesbank (2026a), [US tariffs and geoeconomic fragmentation: implications for the global economy](https://publikationen.bundesbank.de/content/1001564), Monthly Report, July 2026.**{#par-ii2631}
**Deutsche Bundesbank (2026b), [Forecast for Germany: Energy price shock fuels inflation and slows the economic recovery](https://publikationen.bundesbank.de/content/999218), Supplementary information in the Monthly Report, June 2026.**{#par-ou422e}
**European Central Bank (2026), [Main findings from the 's recent contacts with non-financial companies](https://www.ecb.europa.eu/pub/pdf/ecbu/eb202605.en.pdf), Economic Bulletin, Issue 5/2026, pp. 64‑68.**{#par-e63uu9}
**European Commission (2026a), [Statement by President von der Leyen with Hungarian Prime Minister Magyar](https://ec.europa.eu/commission/presscorner/detail/en/statement_26_1200), Statement, 29 May 2026.**{#par-iea763}
**European Commission (2026b), [European Economic Forecast. Spring 2026](https://economy-finance.ec.europa.eu/publications/european-economic-forecast-spring-2026_en), Institutional Paper No 341.**{#par-iai5o4}
**European Commission (2026c), [Communication from the Commission to the European Parliament, the Council, the European Central Bank, the European Economic and Social Committee, the Committee of the Regions and the European Investment Bank](https://reforms-investments.ec.europa.eu/publications-0/2026-european-semester-spring-package-communication_en), 2026 European Semester: Spring Package Communication.**{#par-iu97u2}
**European Union (2013), [Regulation () No 549/2013 of the European Parliament and of the Council of 21 May 2013 on the European system of national and regional accounts in the European Union](https://eur-lex.europa.eu/eli/reg/2013/549/oj?eliuri=eli%3Areg%3A2013%3A549%3Aoj&locale=en), Official Journal, L174/1.**{#par-a18ei6}
**Falck, E., O. Röhe and N. Stähler (2024), [Demographics and the Decline in Firm Entry: On The Role of Population Growth and Longevity](http://dx.doi.org/10.2139/ssrn.5019366), mimeo.**{#par-o9ue59}
**FitzGerald, J. (2023), [Understanding the Irish economy](https://doi.org/10.26504/QEC2023SUM_SA_Fitzgerald), Economic \& Social Research Institute, Special Article.**{#par-oao8eo}
**FitzGerald, J. and D. O'Shea (2026), [The Irish economy in the 2020s](https://doi.org/10.26504/rn20260101), Economic \& Social Research Institute, Research Note.**{#par-e2747i}
**Hörner, N., M. Rotsche and J. Söngen (2022), [Fortschritte der Large Cases Unit](https://www.destatis.de/DE/Methoden/WISTA-Wirtschaft-und-Statistik/2022/05/fortschritte-large-cases-unit-052022.html), Federal Statistical Office, -- Wirtschaft und Statistik, Issue 5/2022.**{#par-eu7617}
**Hussain, M., R. Peltola and S. Mahajan (2019), [Measuring activities of multinational enterprise groups via large cases units](https://ec.europa.eu/eurostat/documents/3217494/9943511/KS-GP-19-001-EN-N.pdf), Review on National Accounts and Macroeconomic Indicators, No 1/2019, pp. 43‑58.**{#par-a846e3}
**International Monetary Fund (2009), [Balance of Payments and International Investment Position Manual](https://www.imf.org/en/publications/manuals-guides/issues/2016/12/31/balance-of-payments-manual-sixth-edition-22588), Sixth Edition ().**{#par-oo58oo}
**Pugsley, B. W. and A. Șahin (2019), [Grown-up Business Cycles](https://doi.org/10.1093/rfs/hhy063), The Review of Financial Studies, Vol. 32 (3), pp. 1102‑1147.**{#par-aua769}
**Schwind, P. and S. Weinand (2026), Contributions to euro area inflation over arbitrary time periods, Deutsche Bundesbank, Technical Paper 02/2026, forthcoming.**{#par-a2542e}
**Spies, V., T. Luh and A. Braakmann (2020), [Europäische Harmonisierung von Bruttoinlandsprodukt und Bruttonationaleinkommen](https://www.destatis.de/DE/Methoden/WISTA-Wirtschaft-und-Statistik/2020/05/europaeische-harmonisierung-052020.html), Federal Statistical Office, -- Wirtschaft und Statistik, Issue 5/2020.**{#par-a8o487}
**United Nations (2009), [System of National Accounts 2008](https://unstats.un.org/unsd/nationalaccount/docs/SNA2008.pdf)**{#par-i8eui4}
1. **{#_ftn_root_1} In July, the Chinese government published a dedicated five-year plan to strengthen domestic consumer demand.**
2. **{#_ftn_root_2} Empirical studies show that the costs of the previous tariff increases since the beginning of 2025 have been borne almost exclusively by actors within the United States. See Deutsche Bundesbank (2026a).**
3. **{#_ftn_root_3} At the end of July 2026, a 10 % additional tariff expired on a large part of the goods imported into the United States. It was replaced by long-term tariffs of up to 12.5 % against 60 trading partners. The justification given for these was alleged deficits in import bans on goods produced using forced labour. In addition, the administration adopted new tariffs on Brazil and Canada. Ongoing investigations into allegedly unfair trade practises, including those vis-à-vis the and China, could lead to further tariff increases.**
4. **{#_ftn_root_4} This is one of the findings from the 's dialogue with non-financial companies (see European Central Bank (2026)).**
5. **{#_ftn_root_5} Calculations based on the method in Schwind and Weinand (2026) show that around half of the quarter-on-quarter increase in the in 2026 was attributable to energy, while around one-third stemmed from services.**
6. **{#_ftn_root_6} For more information about the first and second-round effects of an energy price shock, see, for example, Deutsche Bundesbank (2026b).**
*[MNB]: Magyar Nemzeti Bank
*[Q1]: first quarter
*[Q2]: second quarter
*[WISTA]: Wirtschaft und Statistik
*[ESRG]: Economic Statistics Review Group
*[**Eurostat**]: European Union
*[TTF]: Title Transfer Facility
*[BPM6]: Balance of Payments Manual, sixth edition
*[NGEU]: European Union
*[HICP]: Harmonised Index of Consumer Prices
*[COVID]: coronavirus disease
*[GDP]: gross domestic product
*[ESA]: European system of national and regional accounts
*[SPV]: special purpose vehicle
*[SPVs]: special-purpose vehicles
*[US]: United States
*[CSO]: collateralised synthetic obligation
*[**COVID**]: coronavirus disease
*[IMF]: International Monetary Fund
*[Eurostat]: European Union
*[ECB]: European Central Bank
*[AI]: artificial intelligence
*[**GDP**]: gross domestic product
*[**EU**]: European Union
*[EU]: European Union
*[**IMF**]: International Monetary Fund
*[ICT]: information and communications technology
*[**US**]: United States