# The performance of German credit institutions in 2025
* [*1 Business environment and structural developments in the German banking sector*](#tar-1 "1 Business environment and structural developments in the German banking sector")
* *[*1.1 Macroeconomic environment*](#tar-2 "1.1 Macroeconomic environment")*
* **[*1.2 Balance sheet and structural developments in the German banking sector*](#tar-3 "1.2 Balance sheet and structural developments in the German banking sector")**
* ***[*Changes in market share in German banks' deposit and lending business over time*](#tar-4 "Changes in market share in German banks' deposit and lending business over time")***
* ***[*2 Performance, profitability and cost efficiency*](#tar-5 "2 Performance, profitability and cost efficiency")***
* ***[*Methodological notes on the profit and loss analysis*](#tar-6 "Methodological notes on the profit and loss analysis")
* *[*2.1 Profit for the financial year before tax*](#tar-7 "2.1 Profit for the financial year before tax")
* *[*2.1.1 Operating income and its components*](#tar-8 "2.1.1 Operating income and its components")*
* **[*2.1.2 Net valuation charges*](#tar-9 "2.1.2 Net valuation charges")**
* ***[*2.1.3 Administrative spending*](#tar-10 "2.1.3 Administrative spending")***
* ***[*2.1.4 Balance in the other and extraordinary account*](#tar-11 "2.1.4 Balance in the other and extraordinary account")****
* ***[*2.2 Profitability and cost efficiency*](#tar-12 "2.2 Profitability and cost efficiency")
* *[*2.2.1 Return on assets and equity*](#tar-13 "2.2.1 Return on assets and equity")*
* **[*2.2.2 Cost efficiency*](#tar-14 "2.2.2 Cost efficiency")********
* ***[*3 Outlook*](#tar-15 "3 Outlook")***
* ***[*List of references*](#tar-16 "List of references")***
****The performance of German credit institutions was remarkably strong in 2025. In spite of the still challenging macroeconomic environment, profits (for the financial year after tax) far exceeded the long-term average for the third consecutive year.****{#par-e65ii8}
****Operating business proved robust once again. At €172.5 billion (+ 4.1 %), operating income reached a new record high in the reporting year. Although a significant part of this increase was attributable to a single institution in the category of big banks, a record high would still have been achieved without this one-off effect, as positive developments were driven by a broad base of banks.****{#par-u9o649}
****Despite the key interest rate cuts that continued in 2025, both net interest income and net commission income made a substantial contribution to the increase in operating income. Developments in the other operating result also made a positive contribution. The significant increase in administrative spending was more than offset by higher operating income.****{#par-ei1e38}
****Net valuation charges rose for the majority of banks. In recent years, depreciation and value adjustments contained therein have risen in many cases due to the challenging economic environment. At one big bank, by contrast, developments trended substantially in the opposite direction, meaning that net valuation charges decreased for the banking system as a whole.****{#par-e73oo4}
****The macroeconomic environment is likely to remain challenging for German credit institutions in 2026, too. In addition to trade and geopolitical uncertainties, coupled with the structural challenges facing the German economy, threats to security, particularly cyberattacks, are increasingly coming to the fore. These factors could weigh on banks' performance. At the same time, competitive pressure from direct banks and new market players is persistently high. This is likely to increase the pressure to adapt existing business and price models. The extent to which this will also have repercussions in future for net interest income and net commission income as sources of income remains to be seen.****{#par-e64o24}
***1 Business environment and structural developments in the German banking sector*** {#tar-1}
----------------------------------------------------------------------------------------------
*****Economic growth in Germany remained sluggish in the reporting year.** Ongoing and new economic and geopolitical uncertainties stemming from, for example, tariff policy weighed on economic growth. Structural barriers to growth and the resulting competitive disadvantages faced by the German economy on the international stage also persisted.***{#par-ua93u8}
*****Although overall lending increased in the reporting year, it remained below the level of previous years.** Loans to households continued to recover, particularly in the area of housing loans. Lending business with non-financial corporations, however, did not pick up, given the difficult macroeconomic environment.***{#par-u9614i}
*****The subdued macroeconomic developments were also reflected in rising credit risk.** That being said, this risk continued to materialise in an orderly manner. As a precautionary measure, German banks responded by tightening their credit standards for all loan segments.[\[1\]](#_ftn_root_1)***{#par-e99u9o}
### **1.1 Macroeconomic environment** {#tar-2}
****Amid economic and geopolitical uncertainties, growth in the German economy remained subdued in the year under review.** Following the decline in economic output in 2023 and a stagnation in 2024, recorded an increase of only 0.3 % in 2025 after price and calendar adjustment.[\[2\]](#_ftn_root_2) In addition to trade policy turmoil, persistent structural problems weighed on the export-oriented German economy.[\[3\]](#_ftn_root_3) Structural stress factors include high regulatory and bureaucracy costs, the consequences of demographic change (including shortages of skilled workers and rising wage costs), comparatively high energy costs and increasing competition in export business, especially from China.[\[4\]](#_ftn_root_4) Trade policy turmoil was caused, in particular, by tariff policy and the generally increasingly protectionist global economy.[\[5\]](#_ftn_root_5)**{#par-eo1o52}
****The inflation rate in Germany continued to decline in the reporting year.** As measured by the Harmonised Index of Consumer Prices (), it amounted to 2.3 % on an annual average of 2025, compared with 2.5 % in the previous year. The core inflation rate also decreased markedly from 3.2 % to 2.8 %, but remained above the headline inflation rate, driven by continued sharp price increases in the services sector.[\[6\]](#_ftn_root_6)**{#par-o51316}
****In view of the improved inflation outlook, the** **Governing Council kept the deposit facility rate -- through which monetary policy is steered -- unchanged at 2 % in the second half of the year.** In the previous year, it had lowered the deposit facility rate by a total of 1 percentage point to 3 % by the end of the year, in four interest rate cuts beginning in June 2024. In the first half of 2025, the Governing Council initially continued to ease the monetary policy stance by making four further interest rate cuts totalling one percentage point.[\[7\]](#_ftn_root_7) German credit institutions' financing costs declined due to the interest rate cuts.**{#par-e4o863}
****The reduction of the Eurosystem balance sheet continued in the reporting year.** Reinvestments under the pandemic emergency purchase programme were discontinued. Reinvestments under the asset purchase programme had already ceased in the summer of 2023. This reduced the monetary policy asset portfolio by €538 billion in 2025.[\[8\]](#_ftn_root_8) As securities holdings were reduced, banks in Germany increased their holdings of euro area government bonds. However, according to the banks surveyed in the regular Bank Lending Survey (), the reduction in the portfolio did not have a notable impact on their financing conditions.[\[9\]](#_ftn_root_9)**{#par-i484o1}
****Valuation levels in the global equity and bond markets remained high despite bouts of corrections.** [\[10\]](#_ftn_root_10)At the beginning of April 2025, the tariff announcements led to severe disruptions in the equity and corporate bond markets. However, this phase did not last long:equity markets quickly recovered when the administration announced a temporary suspension of a large number of tariffs, as well as when it subsequently raised the prospect of bilateral negotiations on trade relations.[\[11\]](#_ftn_root_11) Over time, market participants became increasingly unmoved by threats of further tariffs. Towards the end of the year, quarterly figures at some firms gave rise to concerns about the appropriateness of their valuations.[\[12\]](#_ftn_root_12) However, these concerns faded in view of surprisingly high profits for one technology company regarded as an indicator for the sector.[\[13\]](#_ftn_root_13) Overall, the volatility in the financial markets abated over the course of the year, mostly coming in below the long-term average since 2000.[\[14\]](#_ftn_root_14)**{#par-uiae13}
### **1.2 Balance sheet and structural developments in the German banking sector** {#tar-3}
****The consolidation process in the German banking sector also continued in 2025.** As in the previous years, both the number of credit institutions and the number of branches contracted.[\[15\]](#_ftn_root_15) At 25 departures, the majority of the decline in the number of credit institutions was again attributable to credit cooperatives. The number of savings banks fell by seven. Branches were scaled back primarily by big banks, albeit to a lesser extent than in the previous year. Savings banks and credit cooperatives also reduced their number of branches once again.**{#par-a4aoe3}
| **Table 3.1:** **Structural data on German credit institutions** Year-end data |||||||
| Category of banks | Number of institutions^1^ ||| Number of branches^1^ |||
| Category of banks | 2023 | 2024 | 2025 | 2023 | 2024 | 2025 |
|------------------------------------------------------------------------|------:|-------|-------|--------|--------|--------|
| **All categories of banks** | 1,340 | 1,305 | 1,266 | 19,488 | 17,857 | 16,789 |
| **Commercial banks** | 242 | 238 | 232 | 4,572 | 3,292 | 2,530 |
| **Big banks** | 3 | 3 | 3 | 3,471 | 2,184 | 1,429 |
| **Regional banks and other commercial banks** | 137 | 133 | 129 | 941 | 943 | 927 |
| **Branches of foreign banks** | 102 | 102 | 100 | 160 | 165 | 174 |
| **Landesbanken** | 6 | 6 | 6 | 139 | 138 | 139 |
| **Savings banks** | 354 | 349 | 342 | 6,965 | 6,788 | 6,671 |
| **Credit cooperatives** | 696 | 671 | 646 | 6,575 | 6,389 | 6,228 |
| **Mortgage banks** | 7 | 7 | 6 | 31 | 31 | 27 |
| **Building and loan associations** | 14 | 13 | 13 | 1,186 | 1,202 | 1,176 |
| **Banks with special, development and other central support tasks^2^** | 21 | 21 | 21 | 20 | 17 | 18 |
{#par-a2698u}
****Lending picked up momentum again in the reporting year, following a marked decline in the previous year.** However, it remained below the level of the preceding years.[\[16\]](#_ftn_root_16)According to data from the monthly balance sheet statistics, growth in loans to domestic non-banks increased to 3.7 % in the reporting year. A recovery from the previous year, when growth slumped to 1.4 %, was thus noticeable. However, the growth rates of up to 6.5 % observed since 2018 were again missed by a wide margin.**{#par-uau1a8}
**Landesbanken (+ 12.4 %) and regional and other commercial banks (+ 6.0 %), in particular, recorded above-average growth in loans. Credit cooperatives, too, were able to significantly expand their lending business once more (+ 3.7 %). Savings banks, by contrast, saw below-average loan growth for the third year in a row (+ 2.0 %). At big banks, loan growth amounted to 2.4 % on the year.**{#par-ae6119}
****Developments were driven in particular by lending business with households.** The recovery here continued, particularly in the area of housing loans.[\[17\]](#_ftn_root_17) The recovery in lending to households for house purchase has therefore been ongoing since the summer of 2024.[\[18\]](#_ftn_root_18) As before, persisting demand for housing loans was bolstered by high demand for housing. In addition, prices for existing property were still perceived as low, especially compared with the record highs reached in 2022. Moreover, the generally lower interest rate level continued to contribute positively to developments in demand in the first half of 2025.[\[19\]](#_ftn_root_19) However, against the backdrop of higher credit risk and lower risk tolerance, banks in Germany also continued to tighten their credit standards for housing loans, with the exception of the first quarter of 2025.[\[20\]](#_ftn_root_20)**{#par-o61243}
****A recovery in lending to non-financial corporations failed to materialise.** [\[21\]](#_ftn_root_21)Lending business in this segment saw merely moderate growth in the third quarter of 2025.[\[22\]](#_ftn_root_22) The subdued loan demand among non-financial corporations was attributable to uncertainty surrounding the economic outlook, international trade policy and geopolitical conditions.[\[23\]](#_ftn_root_23) On the supply side, banks in Germany also continued to tighten their credit standards for loans to enterprises. As with the tightening of credit standards for loans to households for house purchase, this was also reflected in increased credit risk and a decline in credit institutions' overall risk tolerance.[\[24\]](#_ftn_root_24) Standards were tightened most for the real estate sector and manufacturing and construction (excluding real estate).[\[25\]](#_ftn_root_25)**{#par-o3e3e8}
****Credit risk continued to materialise in an orderly manner despite a rise in corporate insolvencies, but it nevertheless put constraints on business activity due to the tightening of credit standards.** As before, risk is chiefly materialising in the area of commercial real estate loans, above all for banks with corresponding exposures. However, in the manufacturing sector, too, ratios of non-performing loans are now at an elevated level. tariffs are weighing heavily on the manufacturing sector in Germany.[\[26\]](#_ftn_root_26)**{#par-a64225}
****Deposit business with domestic non-banks saw a steep overall increase in the reporting year.** While non-banks' deposit holdings were still declining slightly in the first quarter, domestic non-banks significantly expanded theirs over the remainder of the year.[\[27\]](#_ftn_root_27) As a result, German banks' deposit holdings rose by a total of 3.2 % on the year. Big banks recorded the strongest growth, at 6.3 %. Credit cooperatives also made a marked contribution to deposit growth, with an increase of 3.8 %. Deposit holdings of regional and other commercial banks grew by 2.9 %, and those of savings banks rose by 2.4 %.**{#par-a91o8o}
**Changes in market share in German banks' deposit and lending business over time** {#tar-4}
--------------------------------------------------------------------------------------------
**German banks have benefited to varying degrees from the growth in deposits and loans in recent years. Since 1999, there has been significant movement in the market share of certain categories of banks, especially in deposit business with German employees.**{#par-o49e9i}
**Some foreign banks and neobanks have recently entered the German retail market with great growth ambitions or have significantly expanded their ambitions since their entry into the market. In particular, this is likely to further increase commercial banks' market share in deposit business in future, as these banks are predominantly assigned to the category of regional banks and other commercial banks as well as branches of foreign banks. By contrast, savings banks and credit cooperatives, which have long been established in the market, continue to be the main lenders when it comes to loans to households for house purchase.**{#par-o5aau2}
**In the following, developments are examined first with regard to deposit business and then with regard to the loan portfolio.[\[1\]](#_ftn_466cacd4_1)**{#par-ueia7u}
****Deposit business****{#par-i6e2e4}
****German non-banks' deposits held with German banks** [\[2\]](#_ftn_466cacd4_2)**have more than doubled since 1999.**At €4.5 trillion at the end of 2025, they were around €2.6 trillion above their 1999 level, an increase of just under 138 %.**{#par-o2i11e}
****With one exception in 2013, deposits have always risen in annual terms.** Households in Germany also maintained their high deposit holdings during the period of low interest rates. The small yield spread between alternative forms of investment and bank deposits, coupled with increased uncertainty and risk aversion, provided little incentive to shift into longer-term or alternative forms of investment. The Eurosystem's monetary policy purchase programmes also supported deposit holdings during this period. To the extent that the Eurosystem purchased securities from domestic non-banks, the purchase programmes led to an increase in German non-banks' sight deposits with banks. In addition, the purchase programmes are likely to have reduced the availability of bonds in the market, limiting alternative investment opportunities for private investors and thus also boosting the increase in bank deposits.[\[3\]](#_ftn_466cacd4_3)**{#par-u2618i}
****Competition for deposits has increased significantly since the interest rate reversal in 2022.** Owing to the varying strength of interest rate pass-through in lending and deposit business, banks were able to expand their existing margins in these types of business.[\[4\]](#_ftn_466cacd4_4) Income from interest business thus improved compared with the low and negative interest rate policy period, in which declining interest margins made traditional deposit business increasingly unattractive for many banks.[\[5\]](#_ftn_466cacd4_5) This is particularly true of banks with a traditional business model, which are to a very large extent financed by deposits from the private non-financial sector.[\[6\]](#_ftn_466cacd4_6) Commercial banks are now also planning to use deposits as an important financing component again. An attractive interest rate on deposits is increasingly being used to attract new customer deposits and thus potentially expand market shares.**{#par-i9iei7}
{#par-u93i65}
**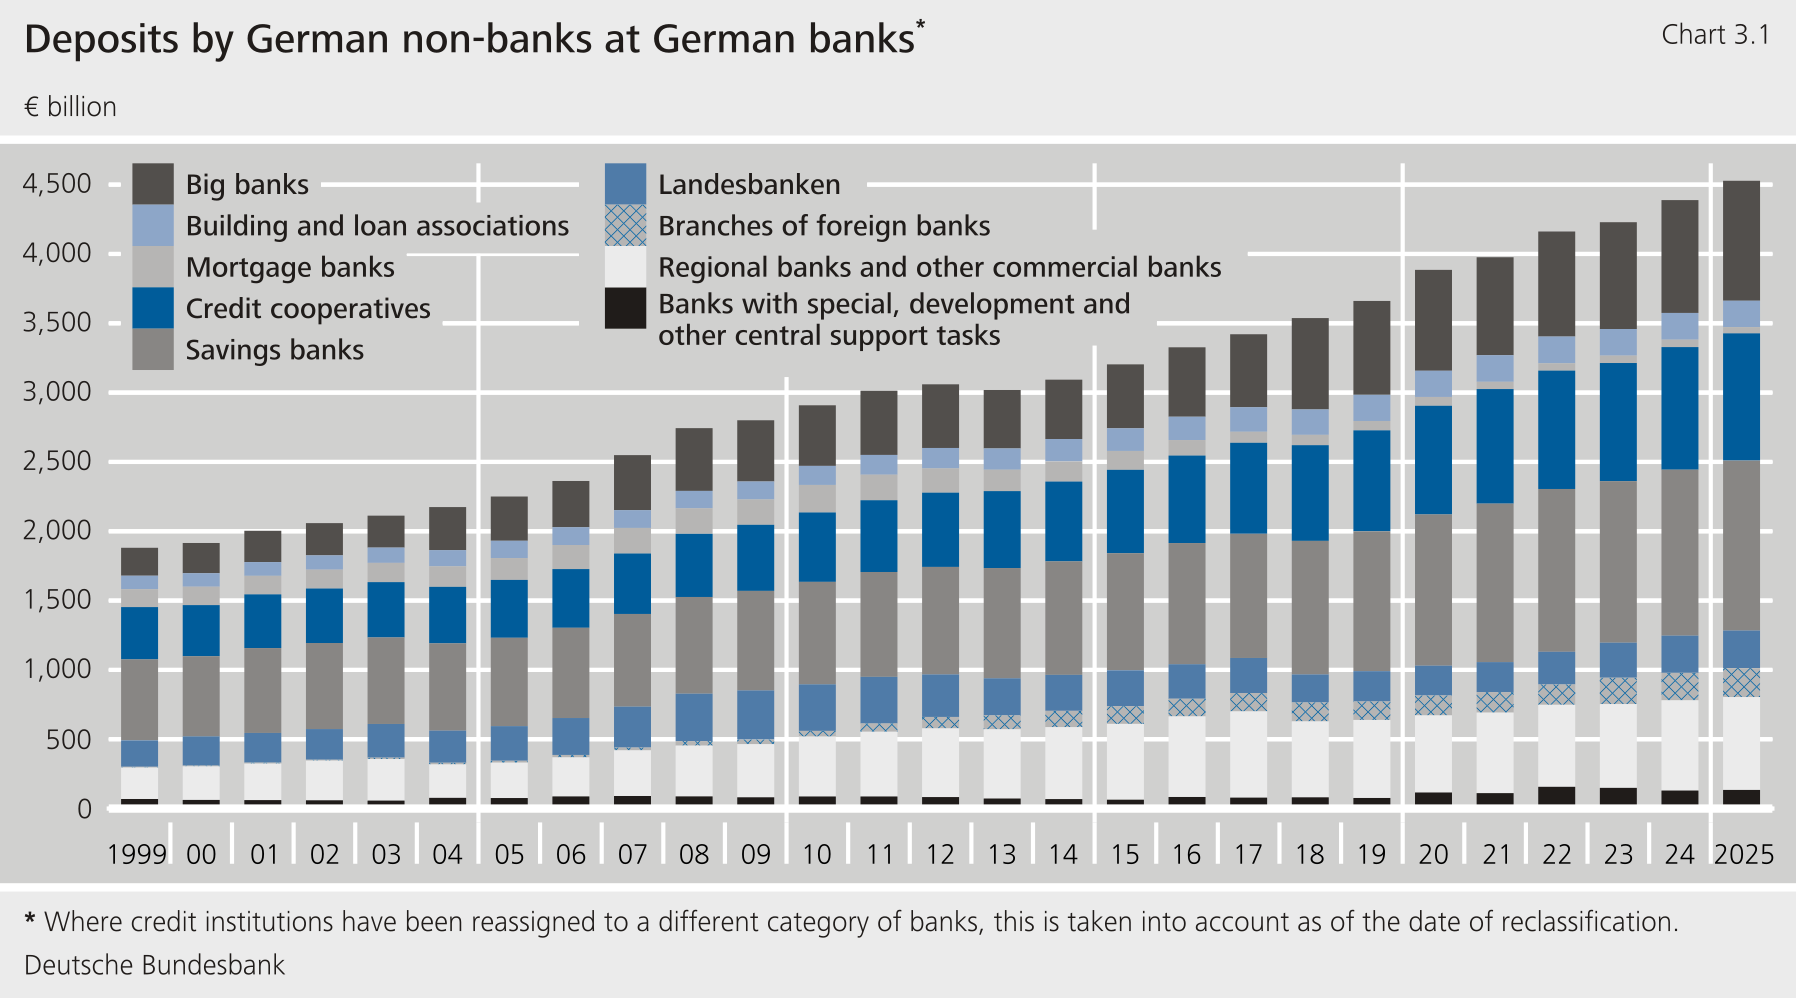**
****Commercial banks** [\[7\]](#_ftn_466cacd4_7)**accounted for just over one-half of the increase in deposits observed since 1999.** Commercial banks saw growth of more than €1.3 trillion (+ 300 %) in the period under review up to the end of 2025.Around one-half of this increase was attributable to big banks, one-third to regional banks and other commercial banks and just under 16 % to branches of foreign banks.**{#par-u795i8}
****The entry of foreign banks into the German banking market was a major factor in the increase in deposits at commercial banks.**At the end of 2025, the ten foreign banks with the highest market shares accounted for just over 30 % of the deposits of all commercial banks; almost 35 % of the total rise in deposits by commercial banks in the period under review was attributable to these institutions. Neobanks have also gained relevance in recent years. However, their contribution to the overall increase since 1999 has been negligible.**{#par-oi989o}
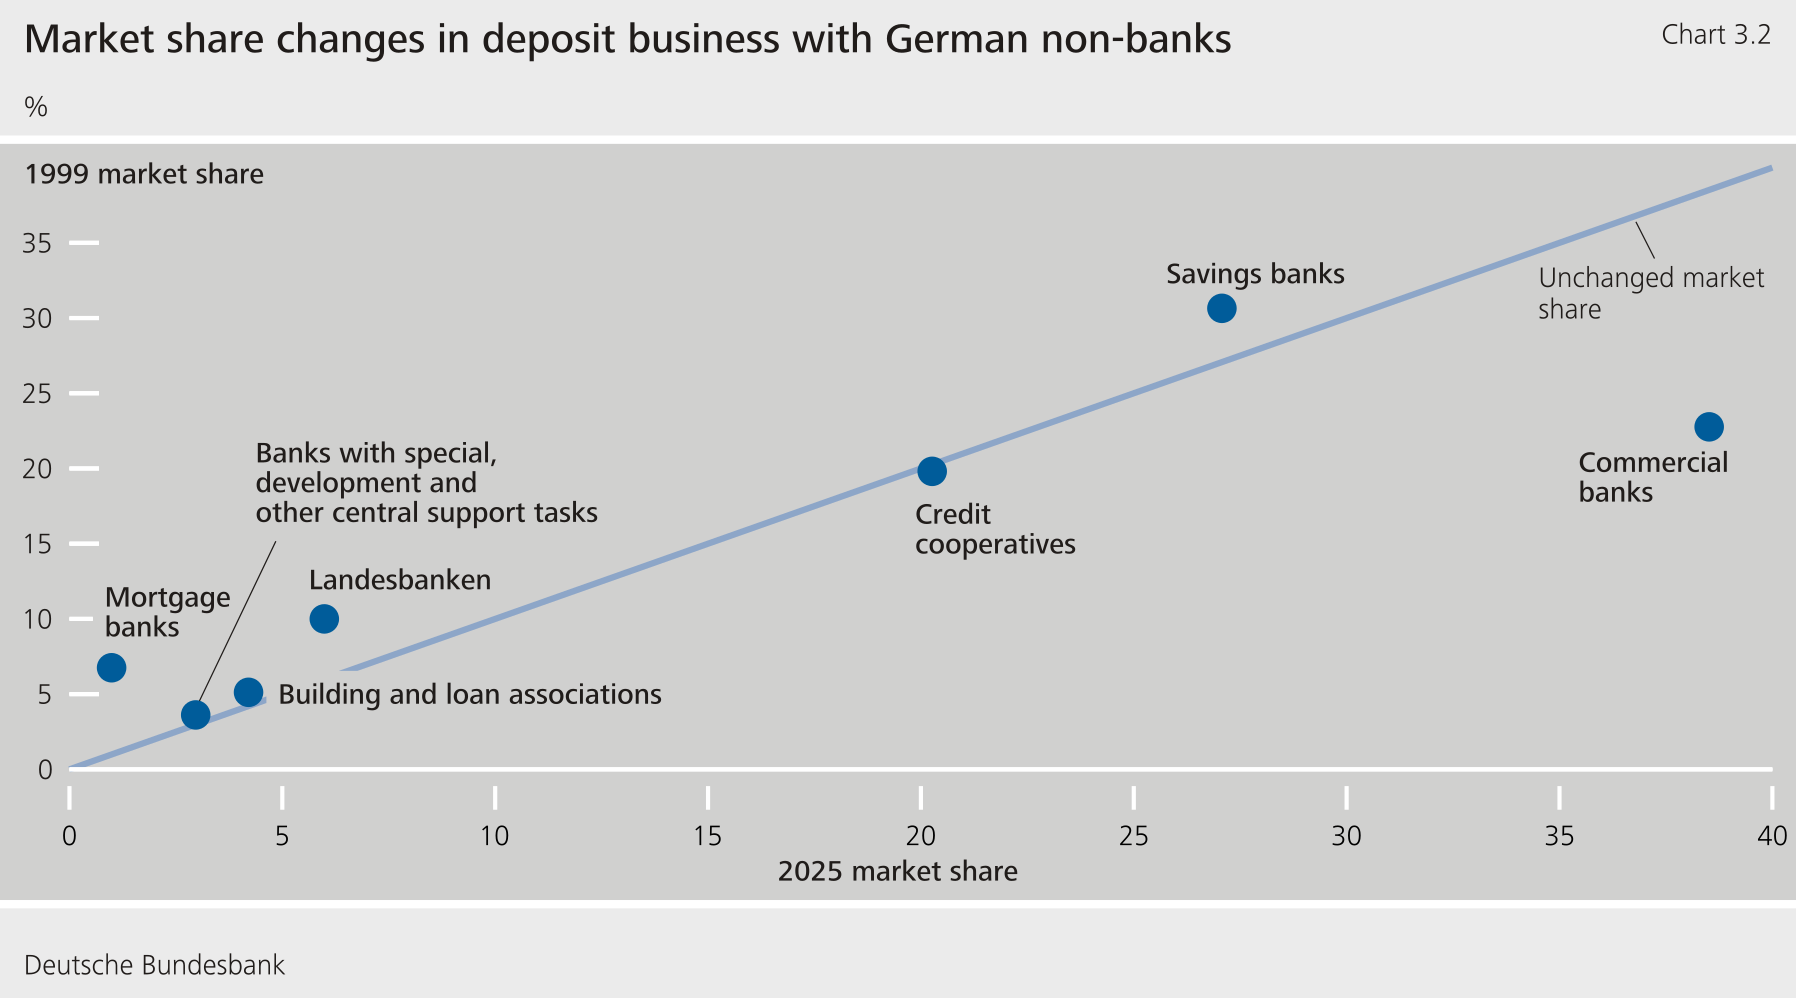
****As a result, market shares have shifted significantly in favour of commercial banks since 1999.**Commercial banks dominated the German market with almost a 40 % share at the end of 2025, while they had held a market share of 23 % in 1999. Big banks increased their market share from below 11 % to 19 %, regional banks and other commercial banks from just under 12 % to almost 15 % and branches of foreign banks from well below 1 % to 4.6 %.**{#par-au9u91}
****This change came primarily at the expense of mortgage banks and Landesbanken. Closures and takeovers as a result of the financial crisis also played a major role here.**In 2025, the mortgage bank reporting category contained only four institutions, down from almost 30 institutions in 1999. As a result, the market share of mortgage banks fell significantly from 6.8 % in 1999 to just 1 % at the end of 2025. In the Landesbank category, the number of institutions has more than halved since 1999. At the end of 2025, they only had a market share of just under 6 %, compared with 10.0 % in 1999.**{#par-ou51u7}
****Looking ahead, savings banks and credit cooperatives could also lose market share due to the rapid development of commercial banks and rising pressure from competition in deposit business.**At present, however, they still hold a total market share of 47.3 % in terms of deposit business with domestic non-banks. Credit cooperatives have so far been able to maintain market share at around their 1999 level. Savings banks have lost only marginal market share since then. Owing to their business models, both categories of banks traditionally rely significantly more heavily on deposits as a financing instrument than commercial banks.**{#par-o44ie2}
{#par-e89296}
****
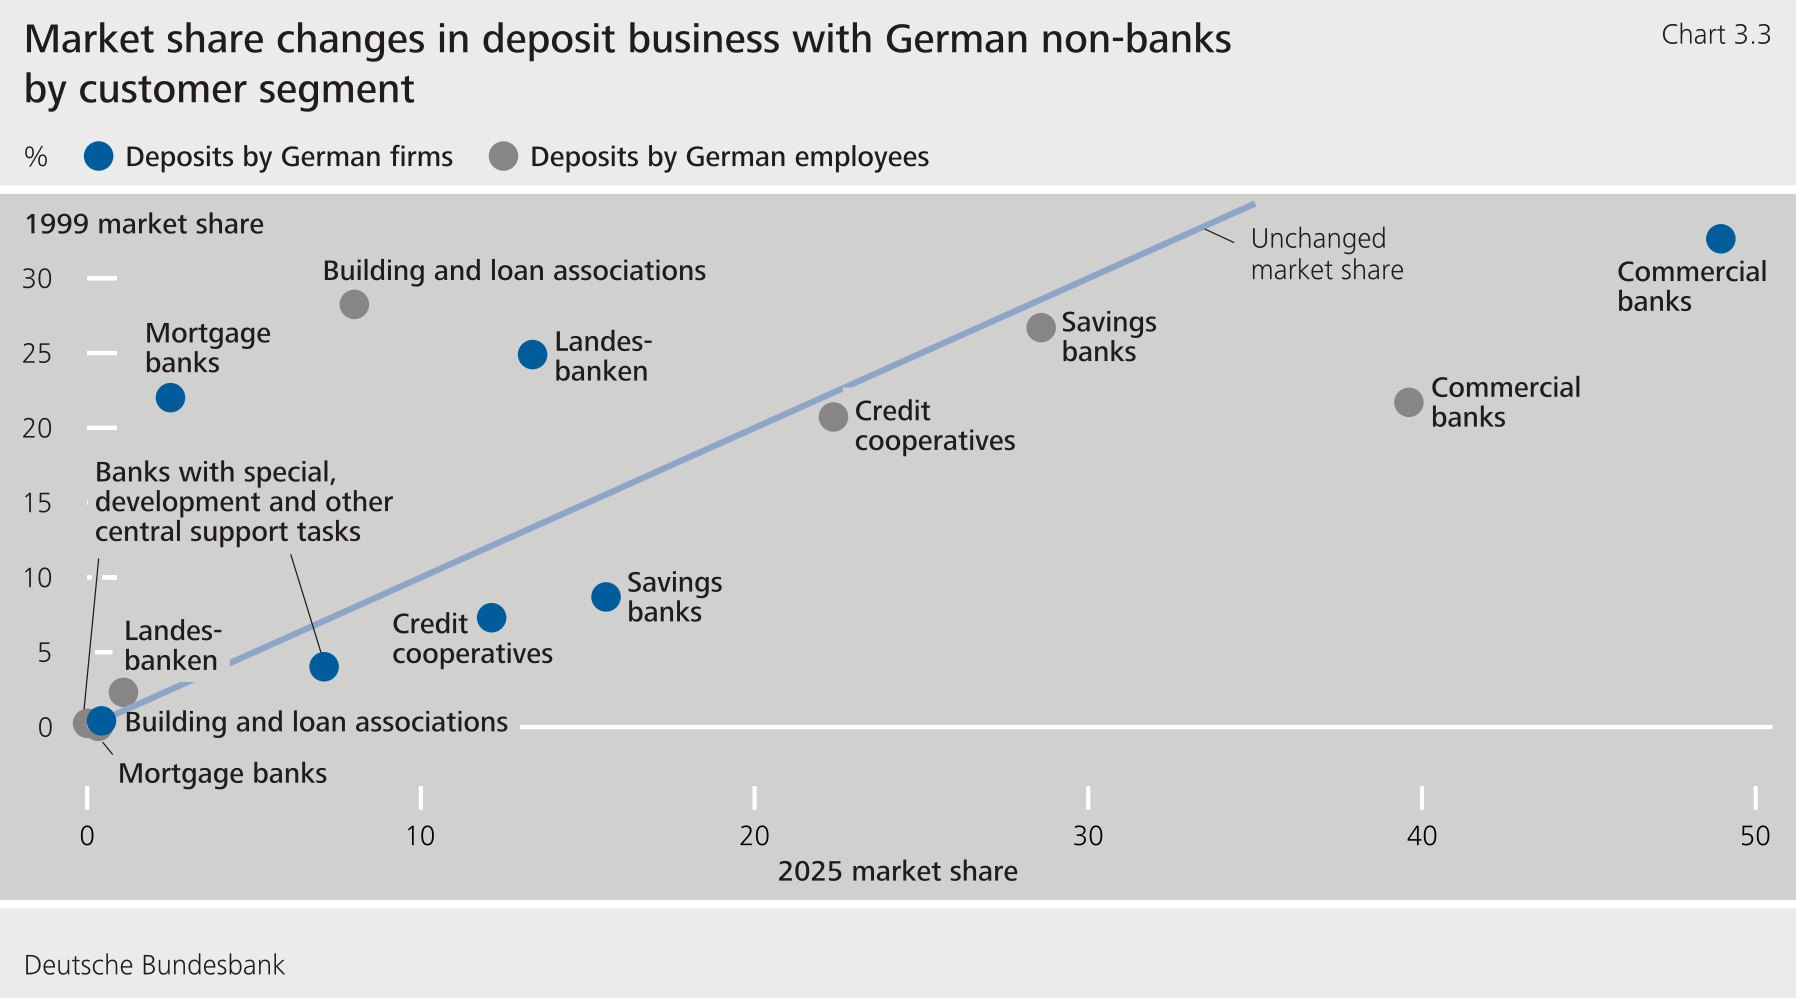
****In terms of customer segments, deposits from German employees still account for around one-half of all deposits held by domestic non-banks. Big banks and regional banks and other commercial banks, in particular, markedly expanded their market shares in this segment.**Since 1999, big banks have more than doubled their market share to almost 15 %. Regional banks and other commercial banks also significantly expanded their market share from 14.4 % to just under 21 %. Selected regional banks and other commercial banks as well as branches of foreign banks, especially direct banks and neobanks, are attempting to win customer deposits in the market with, in some cases, significantly above-average conditions. But big banks, too, are planning to grow their retail deposits considerably in the coming years. With regard to pricing, institutions that have so far been less well established in German retail business are positioning themselves as challengers with their pricing policy.**{#par-e71o3o}
****Due to their -- sometimes large -- growth ambitions, commercial banks' market share of deposits from employees is likely to increase further in the future.** Commercial banks already account for what is by far the largest market share in this segment, with a total of almost 40 % (Chart 3.3).By contrast, the market shares of savings banks and credit cooperatives remained comparatively stable at 28.6 % and 22.4 %, respectively, in line with developments in total deposit business. This development came mainly at the expense of building and loan associations, whose market share fell markedly from 28.3 % to 8.0 %. It is important to note that the number of these institutions has also more than halved since 1999.**{#par-uei357}
****Deposits from German firms still account for around 30 % of all deposits from German non-banks overall.** [\[8\]](#_ftn_466cacd4_8)**In the period under review, big banks and branches of foreign banks primarily expanded their market shares in deposits from German firms.** Big banks saw a rise from 20.5 % to 28.8 %, while the share attributable to branches of foreign banks went from below 1 % to almost 9 %. The market share of regional banks and other commercial banks remained relatively stable at just over 11 %. Overall, commercial banks therefore also account for by far the largest market share in this segment (Chart 3.3).[\[9\]](#_ftn_466cacd4_9) However, unlike employee deposits, savings banks and credit cooperatives also increased their market shares in this segment markedly overall. Savings banks' market share rose from 8.7 % to 15.6 %, while credit cooperatives increased their market share from 7.3 % to 12.1 %. Developments here, too, came at the expense of mortgage banks in particular, whose market share stood at 22.0 % in 1999 (2025: 2.5 %). However, Landesbanken also lost markedly in market share. At 13.4 %, however, their share remained slightly higher than that of credit cooperatives.**{#par-a6961u}
{#par-ueo344}
****
****Lending business****{#par-a19383}
****Lending to German non-banks** [\[10\]](#_ftn_466cacd4_10)**has also expanded significantly in recent years.**At the end of 2025, the stock of loans to German non-banks amounted to €3.8 trillion, an increase of almost 39 % compared with 1999.**{#par-e86a18}
****In the years following the financial crisis, lending dynamics initially remained subdued.** [\[11\]](#_ftn_466cacd4_11) With the ongoing period of low interest rates and the ever more favourable financing conditions this entailed, lending continued to pick up increasingly over time, with loans for house purchase developing particularly dynamically. Lending to firms was supported by government assistance and promotional loans during the ‑19 pandemic.[\[12\]](#_ftn_466cacd4_12)**{#par-iue1i1}
****In the intervening years, therefore, some of the growth rates recorded were high, reaching up to 6.5 % in 2022.** However, the economic slowdown that began in mid-2022, high inflation rates, higher lending rates and the resulting subdued loan demand weighed on lending in subsequent years.[\[13\]](#_ftn_466cacd4_13) After two years of below-average growth, lending picked up again in 2025, but remained below the level seen in previous years.**{#par-a4uii7}
{#par-e24363}
**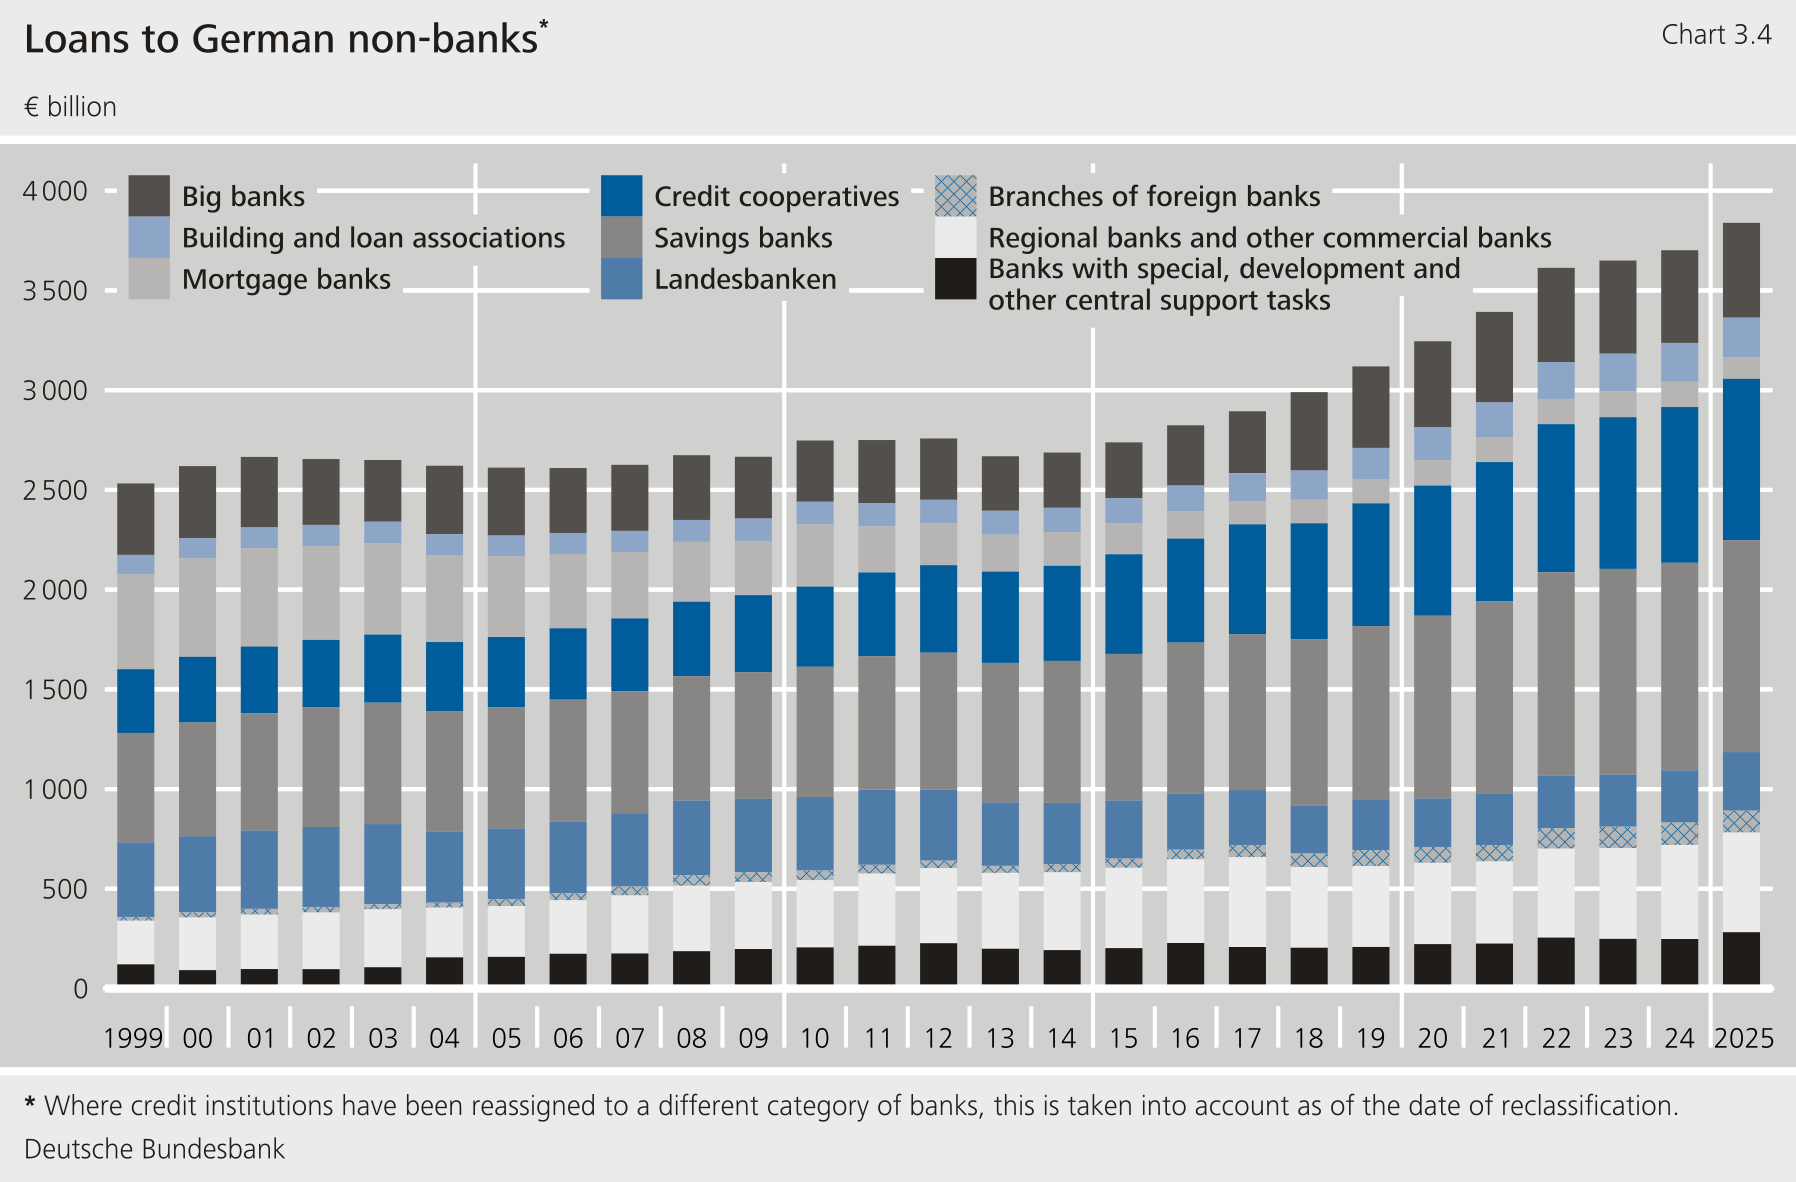**
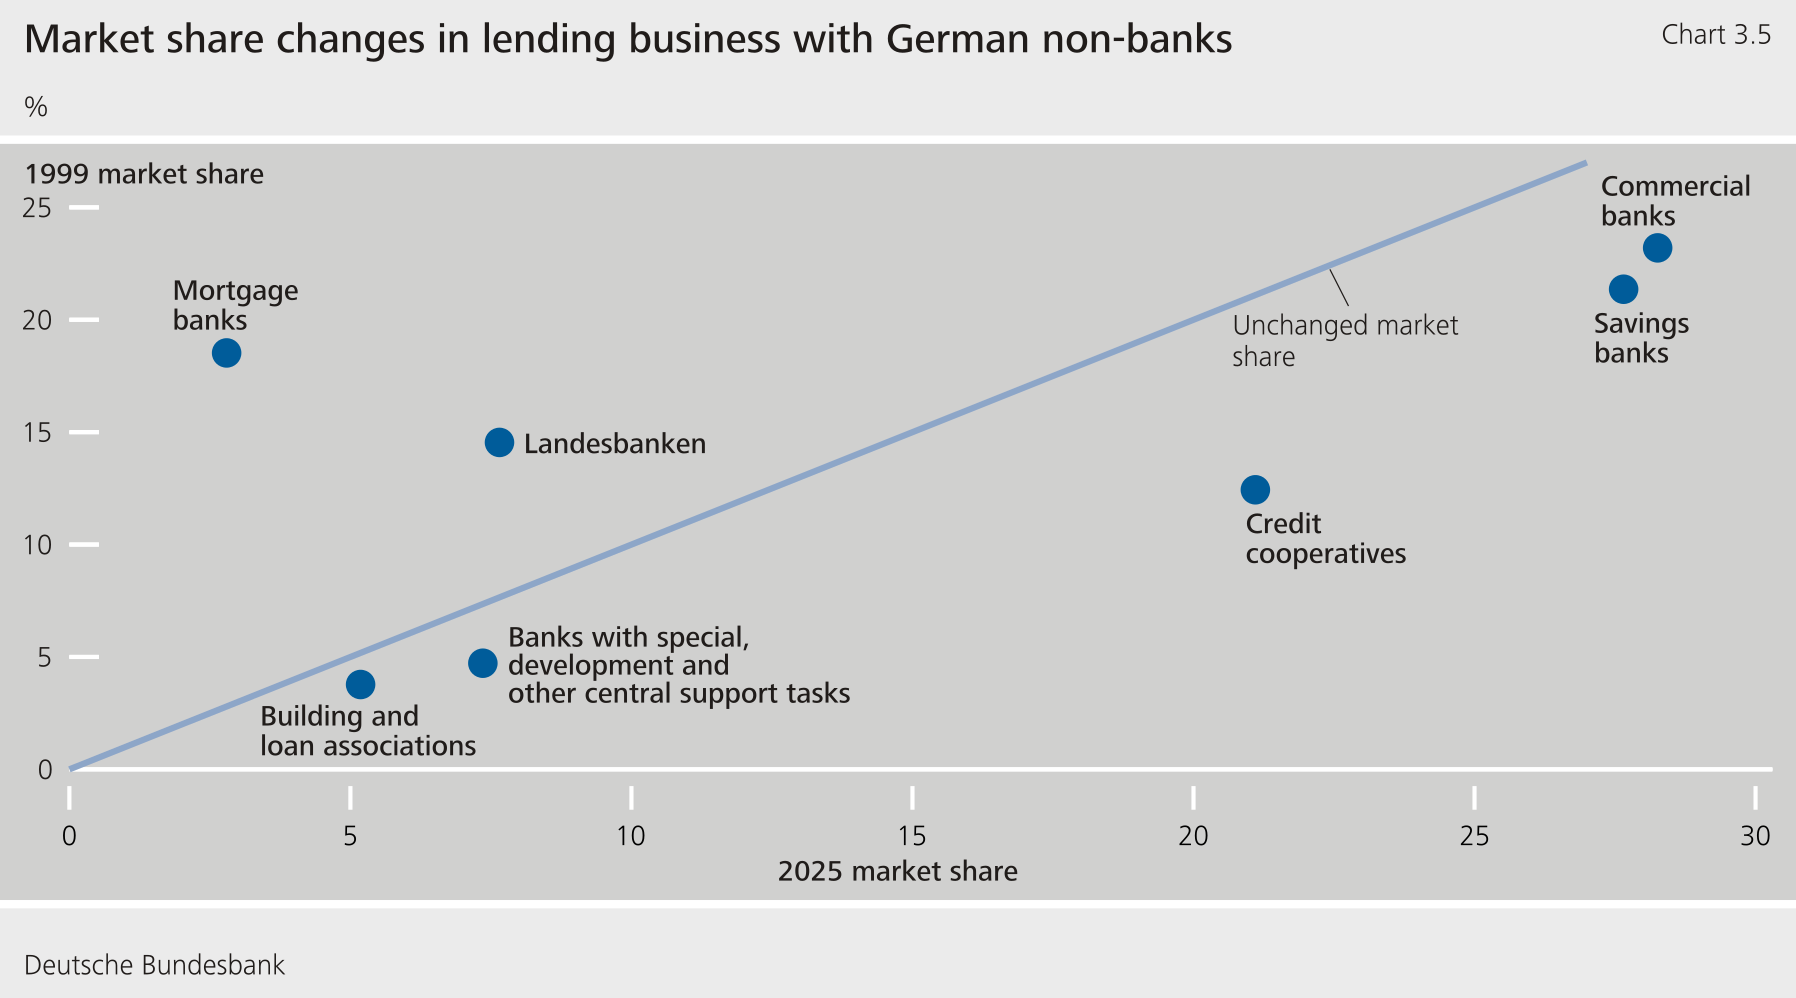
****Savings banks and credit cooperatives have recorded particularly large increases in their loan portfolios since 1999.**This was observed at a large proportion of institutions. At 153.5 %, the increase at credit cooperatives was in fact significantly stronger in relative terms than that of savings banks (+ 93.4 %), though it started from a lower level.**{#par-a9a959}
****As a result, credit cooperatives significantly expanded their market share in lending business with German non-banks.**This stood at 21.1 % at the end of 2025, compared with only 12.4 % in 1999. At 27.7 %, savings banks still recorded a higher market share than credit cooperatives. However, their market share growth since 1999 has been less strong, as their market share was already 21.4 % at that point in time.**{#par-i143ua}
****Regional banks and other commercial banks likewise increased their lending to German non-banks significantly (+ 128.6 %).** In absolute terms, two direct banks, including one foreign bank, were the main contributors to this growth. However, other regional banks and other commercial banks also recorded significant growth relative to 1999 in some cases. The increase at big banks was not insignificant either (+ 32.7 %).[\[14\]](#_ftn_466cacd4_14)**{#par-uouoeu}
****Commercial banks continue to have the largest market share overall, at 28.3 %.**Regional banks and other commercial banks, in particular, have markedly expanded their market share since 1999. At the end of 2025, it stood at 13.0 %, which was actually higher than the market share of big banks (12.4 %), which had itself declined slightly overall since 1999.**{#par-u46241}
****By contrast, mortgage banks lost considerable importance in lending business as a result of the closures and restructuring that have taken place since 1999.** Their market share stood at just 2.8 % at the end of 2025, compared with 18.5 % in 1999. The market share of Landesbanken also declined. It has almost halved since 1999 but still stood at 7.7 % at the end of 2025.**{#par-u9ia28}
{#par-u99a3a}
****
****At the end of 2025, loans to German firms and households accounted for more than 80 % of total loans to German non-banks.** [\[15\]](#_ftn_466cacd4_15) More than one-half of this amount consists of housing loans. More than 70 % of these loans in turn are housing loans to German employees and other individuals.**{#par-ie3927}
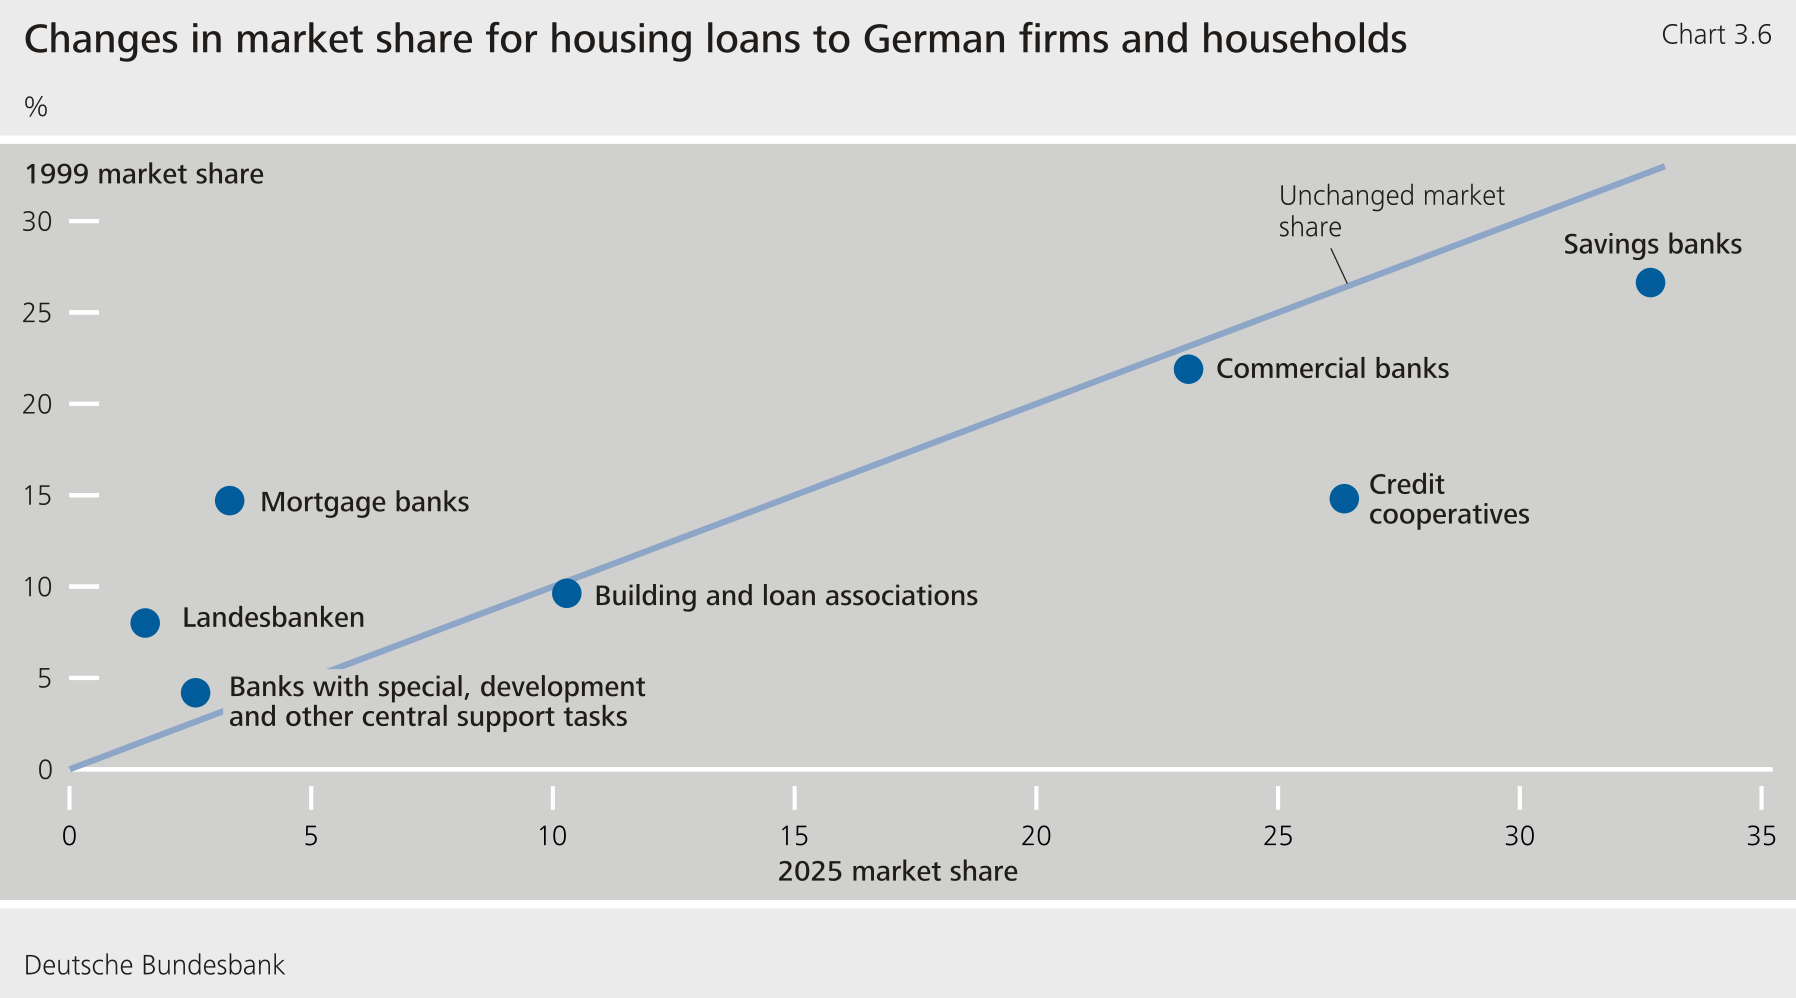
****In the category of housing loans to German firms and households, savings banks and credit cooperatives, which have long been established in the market, continue to be the main lenders.** Credit cooperatives, in particular, were able to significantly expand their market share here. It stood at 26.4 % at the end of 2025, having remained below 15 % in 1999. Savings banks also continued to expand their market share in housing loans to German firms and households. With a market share of 32.7 %, they are by far the main players in this segment.**{#par-ioi4io}
****At the end of 2025, commercial banks had a market share of 23.2 % in loans to households for house purchase.** This represents only a slight overall expansion since 1999. Big banks' market share remained virtually unchanged overall at 13.8 %, while that of regional banks and other commercial banks increased only slightly to 9.2 %.**{#par-u81885}
{#par-o3uue1}
****
1. **{#_ftn_466cacd4_1} In the long observation period since 1999, which is the basis for this supplementary information, various factors have played a substantial role in the development of deposits and loans in Germany. These include the extensive monetary and fiscal policy and regulatory measures taken as a result of the global financial crisis and the coronavirus pandemic, which have significantly influenced depositor and lending behaviour via monetary aggregates and interest rate movements, amongst other things. In addition, there have also been a large number of structural changes in the German banking system. Alongside the market exit of some institutions as a result of the financial crisis, restructuring and business model adjustments have led to some banks moving between the different categories under review. At the same time, new market players have entered the German banking market. The expansion in deposit and loan business and the changes in market share of the various categories of banks were therefore not always of a strategic nature -- some were also due to structural factors. This needs to be taken into consideration in the analysis, and will be pointed out where it is particularly relevant**
2. **{#_ftn_466cacd4_2} This item includes deposits from German enterprises and households as well as government funds.**
3. **{#_ftn_466cacd4_3} See Deutsche Bundesbank (2024a), p. 92 ff, and Deutsche Bundesbank (2017).**
4. **{#_ftn_466cacd4_4} See Deutsche Bundesbank (2023a), p. 60.**
5. **{#_ftn_466cacd4_5} See Deutsche Bundesbank (2023b).**
6. **{#_ftn_466cacd4_6} See Deutsche Bundesbank (2024a), pp. 74 ff.**
7. **{#_ftn_466cacd4_7} Big banks, regional banks and other commercial banks as well as branches of foreign banks.**
8. **{#_ftn_466cacd4_8} Deposits from employees account for a further 8.7 %, while those from other German individuals account for 5.4 %. The remainder is attributable to general government and non-profit institutions. Owing to their minor relevance, deposits of German self-employed persons and other individuals, general government and non-profit institutions are not considered in more detail in this article.**
9. **{#_ftn_466cacd4_9} Here, too, structural changes in the composition of the bank categories are likely to have contributed to this development.**
10. **{#_ftn_466cacd4_10} This item comprises loans to German firms and households as well as to general government.**
11. **{#_ftn_466cacd4_11} In addition to redemptions, the loan portfolio is also influenced by depreciation. Depreciation is likely to have further weakened the growth of the loan portfolio as a result of the financial crisis.**
12. **{#_ftn_466cacd4_12} See Deutsche Bundesbank (2020), p. 34.**
13. **{#_ftn_466cacd4_13} See Deutsche Bundesbank (2025g), p. 59.**
14. **{#_ftn_466cacd4_14} Building and loan associations recorded an increase of 105.1 %, while banks with special, development and other central support tasks even recorded an increase of 161.1 %. In addition to statistical reasons, the latter is primarily due to government-initiated support measures, including the assistance programmes during the ‑19 pandemic, government support loans to energy suppliers in 2022 and the expansion of public support programmes for climate protection, housing construction and infrastructure investment. By contrast, lending declined sharply for mortgage banks and Landesbanken (− 77.4 % and − 21.4 %, respectively), driven by changes in the composition of the respective categories of banks as a result of the financial crisis.**
15. **{#_ftn_466cacd4_15} By contrast, loans to German general government were of minor importance in the competitive landscape, which is why these are not examined in more detail here.**
**2 Performance, profitability and cost efficiency** {#tar-5}
-------------------------------------------------------------
****The earnings situation of German credit institutions remained very comfortable in the current reporting year, too.**Operating business was robust in spite of the business environment. Starting from a level that was already high in a long-term comparison, operating income rose again significantly on the year in some cases. Regional and other commercial banks, credit cooperatives and savings banks, in particular, recorded new highs in terms of their operating income.**{#par-uoa43o}
****Although profit for the financial year before tax rose significantly in the reporting year, particularly at big banks, almost all categories of banks** [\[28\]](#_ftn_root_28)**continued to report profits for the financial year far in excess of their respective long-term averages.** For most categories of banks, declines on the previous year were mainly due to increases in net valuation charges and deteriorations in the extraordinary result, rather than to a decline in operating business. Increases in net valuation charges should be viewed against the backdrop of the difficult macroeconomic and geopolitical environment. Compared with previous periods of economic weakness, however, net valuation charges for the banking system as a whole have remained at a reasonable level so far. Developments in the balance in the other and extraordinary account were driven primarily by individual institutions.**{#par-au173o}
**Methodological notes on the profit and loss analysis** {#tar-6}
-----------------------------------------------------------------
****The results from the profit and loss accounts are based on the published annual accounts of the individual institutions in accordance with the provisions set forth in the German Commercial Code (** ***Handelsgesetzbuch*** **) and the Regulation on the Accounting of Credit Institutions (** ***Verordnung über die Rechnungslegung der Kreditinstitute*** **).** In terms of their conception, structure and definitions, they differ from the International Financial Reporting Standards () for publicly traded banking groups. This means that -- from a methodological viewpoint -- business performance and certain balance sheet or individual profit and loss items are not comparable across the national and international accounting frameworks. For reasons of comparability within Germany, it is advisable to consider the individual accounts when analysing financial performance.**{#par-uie2ee}
****From the reporting year 2025, balance sheet equity and total assets are also based on the individual accounts.** Until now, these variables were not taken from the annual accounts but were instead taken as annual average values on the basis of the monthly balance sheet statistics reported for the institution as a whole.**{#par-aui852}
****The reporting group for profit and loss statistics includes all banks which are monetary financial institutions** ()**that conform to the definition of a credit institution under the Capital Requirements Regulation** ()**as set forth in Article 4(1) number 1 of Regulation** ()**No 575/2013 and are domiciled in Germany.** Branches of foreign banks that are exempted from the provisions of Section 53 of the German Banking Act (*Kreditwesengesetz*), banks in liquidation and banks with a financial year of less than 12 months (truncated financial year) are not included in this performance analysis. Individual institutions are allocated to categories of banks in the same way as they are allocated according to banking statistics.**{#par-o86476}
**At the launch of monetary union in 1999, the reporting group relevant for calculating the money supply and for monetary analysis was uniformly defined by the European Central Bank for the euro area as a whole and designated as the sector. Unlike the population of banks used for the Bundesbank's analysis up to that point, building and loan associations are also included. **Except where another time period is explicitly mentioned, the calculations with regard to the longer-term average cover the years since the launch of monetary union, i.e. from 1999 to 2025.****
### **2.1 Profit for the financial year before tax** {#tar-7}
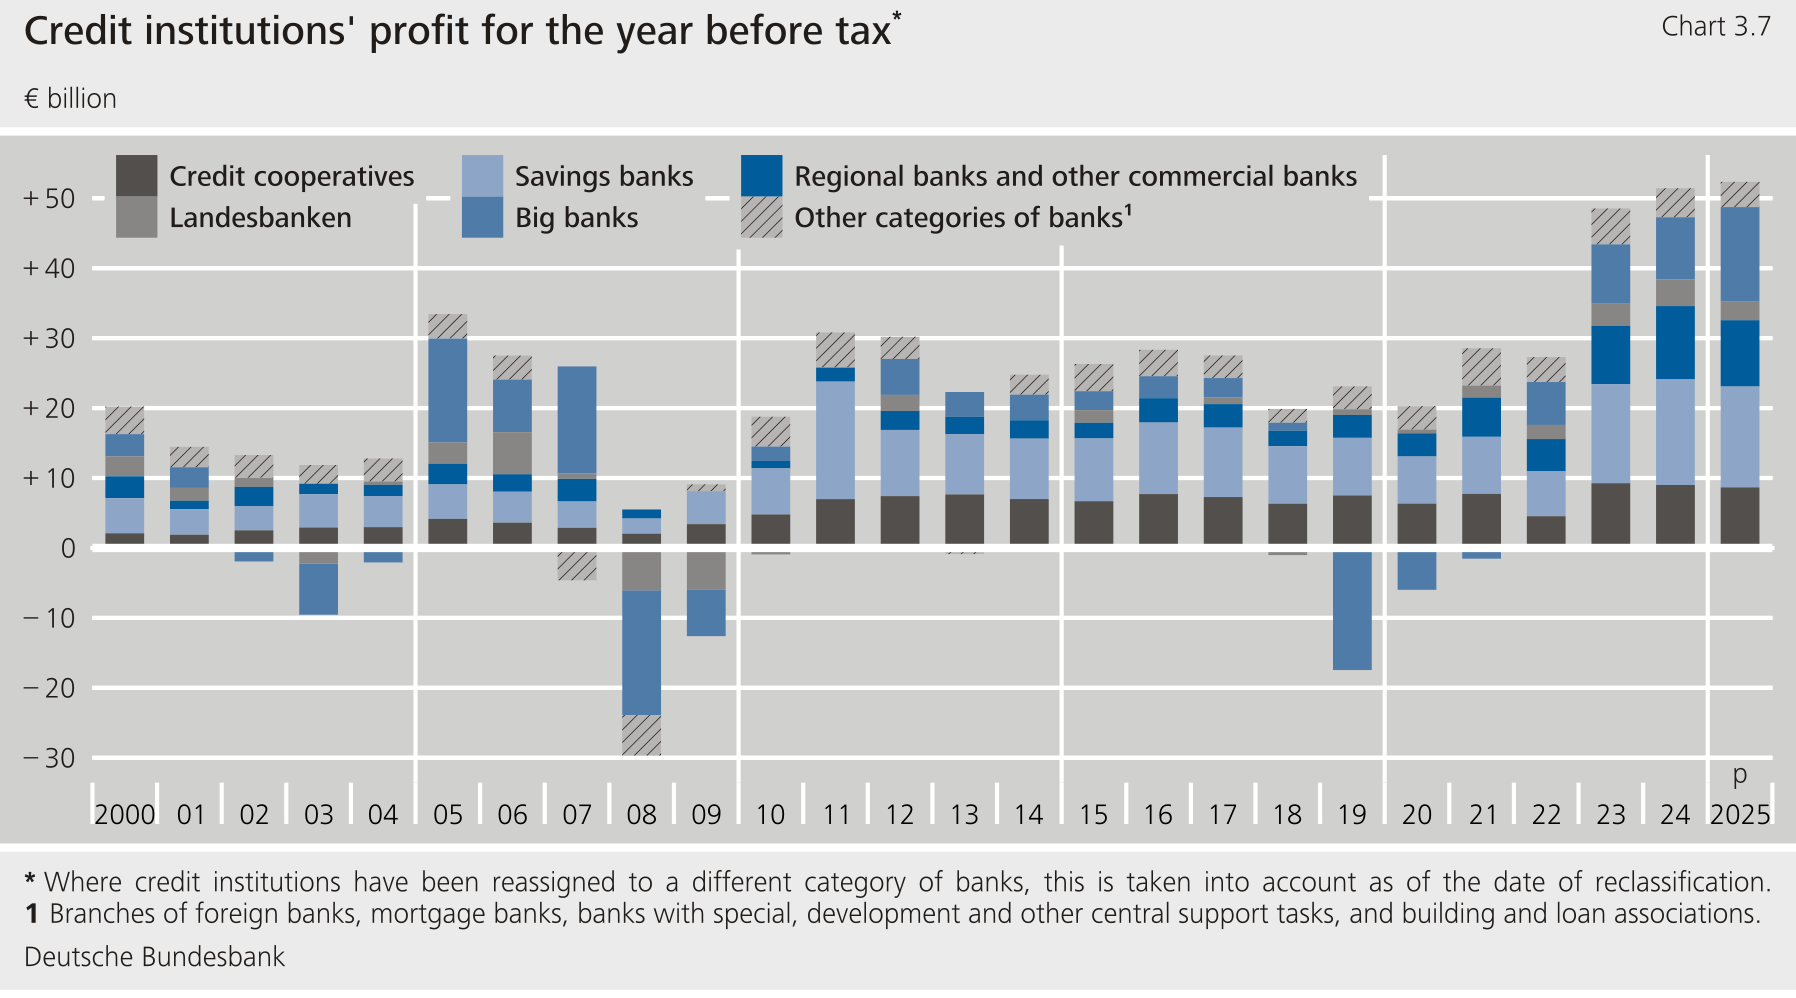
****In the reporting year, aggregate profit for the financial year before tax** [\[29\]](#_ftn_root_29)**reached a high level for the third consecutive year, totalling €52.3 billion.** In relation to total assets, it remained well above the long-term average overall, at 0.55 %.With that, a new peak was reached -- another slight increase on the record high of the previous year (+ €0.9 billion, or + 1.8 %).**{#par-ui3875}
****However, the increase in profit for the financial year was by no means a development seen across the board; rather, it was primarily attributable to a single big bank.** Relative to 2024, big banks contributed €4.6 billion (+ 52.1 %) to the overall increase, thus distorting the picture upwards. This was due to a significant improvement in the operating result, especially at one institution. The overall picture also includes the fact that almost all other categories of banks[\[30\]](#_ftn_root_30) recorded what were, in some cases, significant declines compared with the previous year. This was particularly pronounced at Landesbanken (− €1.2 billion, or − 30.3 %). However, the decline at regional and other commercial banks also had a substantial impact (− €1.0 billion, or − 9.5 %). At savings banks, profit for the financial year fell by €0.7 billion or 4.5 %, and at credit cooperatives, by €0.3 billion or 3.8 %. At the level of individual institutions, the picture was also fairly mixed: only slightly more than one-half of the institutions under review reported a steady or increased profit for the financial year, while the remainder all recorded at least a slight decline.[\[31\]](#_ftn_root_31)**{#par-e3436u}
****Nevertheless, profit for the financial year remained at a comfortable level by long-term standards, even from the perspective of individual categories of banks.**This was largely due to the more favourable interest rate environment since the end of the low interest rate period, interest rate hedges, as well as the recovery in securities transactions, and the higher commission income that resulted from this.**{#par-i81u31}
****Operating business remained robust in the current financial year as well.**On aggregate, the increase in operating income observed in the reporting period more than offset the simultaneous increase in administrative spending. This applies irrespective of developments at big banks and, in particular, to credit cooperatives as well as regional and other commercial banks.**{#par-u54795}
****Viewed as a whole, net valuation charges declined and thus contributed to stabilising profit for the financial year overall.**However, this was driven by developments at another institution belonging to the category of big banks, and stands in contrast to the increase at the level of bank categories and individual institutions.**{#par-uaa5i1}
****In aggregate terms, profit for the financial year was also adversely affected by the extraordinary result of individual institutions.** In 2024, this had still contributed significantly to an increase in profit for the financial year owing to one-off effects in the category of big banks as well as regional banks and other commercial banks. Current developments were, once again, strongly driven by individual institutions.**{#par-i36i7a}
{#par-e6i46i}
****
| **Table 3.2: Major income and cost items for individual categories of banks in 2025^p^** As a percentage of operating income ||||||||||
| Item | All categories of banks | Big banks | Regional banks and other commercial banks | Landes- banken | Savings banks | Credit cooperatives | Mortgage banks | Building and loan associations | Banks with special, development and other central support tasks |
| Net interest income | 63.7 | 52.0 | 54.0 | 65.6 | 71.1 | 72.8 | 103.7 | 103.9 | 64.4 |
| Net commission income | 25.3 | 33.1 | 24.8 | 15.7 | 26.7 | 23.0 | -- 6.2 | -- 7.7 | 25.5 |
| Result from the trading portfolio | 6.6 | 13.8 | 11.1 | 12.9 | 0.0 | 0.0 | 0.0 | 0.0 | 5.7 |
| Other operating result | 4.4 | 1.1 | 10.2 | 5.8 | 2.1 | 4.2 | 2.5 | 3.8 | 4.4 |
| Operating income | 100.0 | 100.0 | 100.0 | 100.0 | 100.0 | 100.0 | 100.0 | 100.0 | 100.0 |
| General administrative spending | -- 59.4 | -- 64.8 | -- 55.6 | -- 58.6 | -- 57.8 | -- 60.4 | -- 45.6 | -- 67.2 | -- 59.2 |
| of which: | |||||||||
| Staff costs | -- 30.7 | -- 29.3 | -- 26.1 | -- 28.8 | -- 34.7 | -- 33.6 | -- 22.5 | -- 26.8 | -- 32.1 |
| Other administrative spending | -- 28.7 | -- 35.4 | -- 29.4 | -- 29.8 | -- 23.0 | -- 26.8 | -- 23.1 | -- 40.4 | -- 27.1 |
| Result from the valuation of assets | -- 6.9 | -- 2.1 | -- 8.3 | -- 10.7 | -- 7.6 | -- 9.0 | -- 39.2 | -- 6.2 | 1.1 |
| Other and extraordinary result | -- 3.4 | 3.0 | -- 10.9 | -- 7.3 | -- 0.5 | -- 1.2 | -- 4.6 | -- 11.9 | -- 11.2 |
|-------------------------------------|-------------------------|-----------|-------------------------------------------|----------------|---------------|---------------------|----------------|--------------------------------|-----------------------------------------------------------------|
{#par-e6o7i3}
#### **2.1.1 Operating income and its components** {#tar-8}
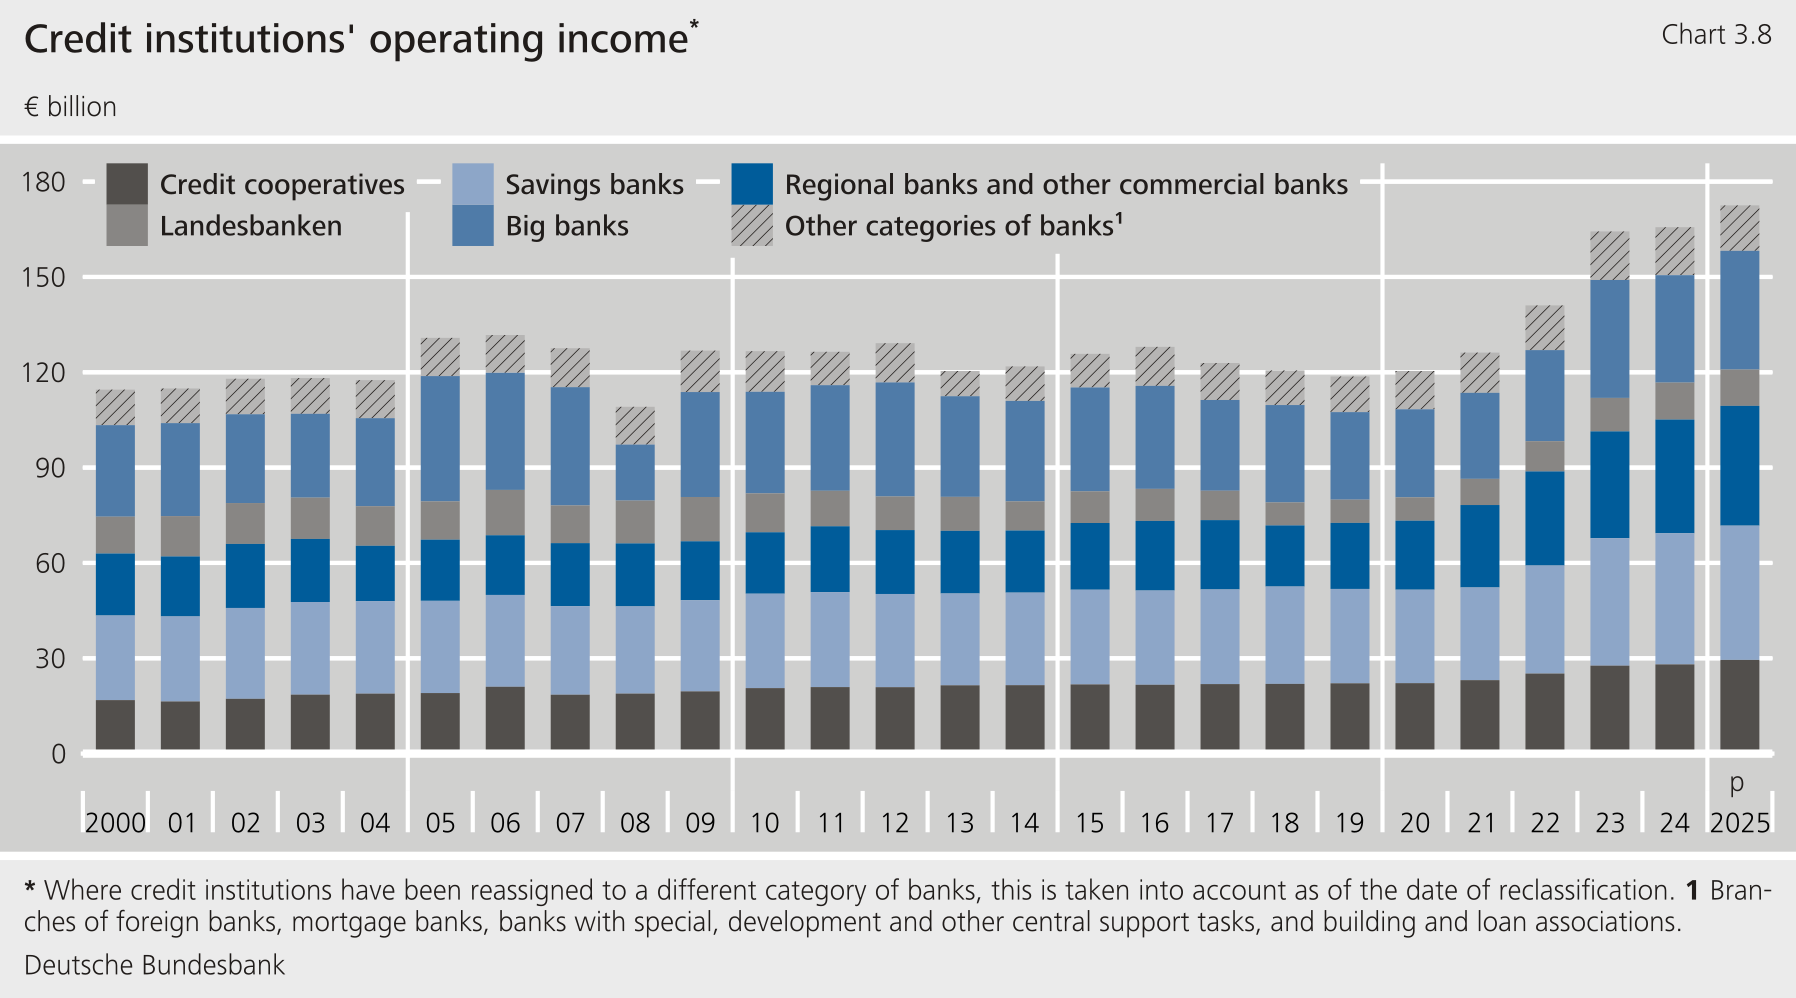
****Operating income** [\[32\]](#_ftn_root_32)**reached a new record high of €172.5 billion or 1.8 % of total assets in the reporting year.**Starting from a level that was already high in a long-term comparison, it rose significantly again compared with the previous year (+ 4.1 %). Almost one-half of the total increase in operating income was generated by an institution belonging to the category of big banks. However, a new record level would have been achieved even without this one-off effect. This is because developments were driven by the vast majority of institutions: 900 out of all 1,171 institutions under review were able to either maintain or increase their level from the previous year.**{#par-ao697e}
****Savings banks, credit cooperatives, regional banks and other commercial banks, in particular, recorded higher operating income in relation to total assets than the rest of the banking system.**At 2.7 %, the figure for savings banks was even slightly above its long-term average. Credit cooperatives reported operating income of 2.4 % relative to total assets, while the figure reported by regional banks and other commercial banks was 2.1 %. Both values were somewhat below their long-term averages.**{#par-e83u43}
{#par-ae46u1}
****
****Credit cooperatives' operating business improved significantly on the year.**They increased their operating income by €1.4 billion (+ 5.0 %) and were thus able to more than offset the rise in their administrative spending. The increase was primarily attributable to interest business. The picture was also very clear at the individual institution level: the operating income of 540 of the 643 credit cooperatives under review was up on the previous year's level.**{#par-oa175e}
****Regional banks and other commercial banks saw their operating business improve markedly, too.**They increased their operating income by €1.9 billion (+ 5.4 %) and were thus also more than able to compensate for the rise in their administrative spending. Net commission income and the other operating result were the main contributors to this. However, net interest income also increased markedly. But the picture was mixed when looking at individual institutions: 68 of a total of 119 institutions -- or slightly more than one-half -- recorded higher operating income.**{#par-e463oi}
****Savings banks were able to stabilise their operating business at the previous year's level.**The increase in their operating income fully cushioned the simultaneous increase in their administrative spending. At the level of individual institutions, the picture was similar to that of credit cooperatives: 259 of the 341 savings banks under review recorded an increase in their operating income, which was equivalent to slightly under 80 %.**{#par-o43434}
****Overall, both net interest income and net commission income made a significant contribution to the improvement in operating income.** Depending on the category of banks under analysis, either the increase in net interest income or the increase in net commission income was more significant.**{#par-oa161u}
****Net interest income remains the most important income component of German credit institutions.**It still accounts for a little under two-thirds of total operating income. The share of savings banks and credit cooperatives even amounts to over 70 %, owing to their focus on traditional deposit and lending business. Taken together, savings banks and credit cooperatives generated almost one-half of the German banking system's net interest income in the reporting year, too, contributing €30.1 billion and €21.5 billion, respectively.**{#par-aai924}
****However, net commission income is becoming increasingly important for German credit institutions.**It now accounts for slightly over 25 % of operating income. In particular, the share of this income attributable to Landesbanken, regional banks and other commercial banks as well as savings banks increased slightly on the year. By contrast, it declined somewhat among credit cooperatives.**{#par-i91e4e}
****The other operating result also contributed markedly to the increase in operating income in the reporting year.**Its contribution was similar to that of net interest income. However, this was primarily attributable to big banks as well as regional and other commercial banks, and was largely driven by individual institutions. Overall, it only accounted for a little over 4 % of operating income.**{#par-uieoo3}
****The trading result is primarily relevant for big banks, regional banks and other commercial banks, as well as Landesbanken.**Although it declined slightly overall in the reporting year, it still accounts for between slightly over 11 % and slightly under 14 % of operating income for these categories of banks. Its overall share of operating income amounts to a little under 6.6 %.**{#par-e14u94}
****2.1.1.1** **Net interest income****{#par-o1oeuo}
****Despite the interest rate cuts that have taken place in the meantime, net interest income** [\[33\]](#_ftn_root_33)**reached a new peak for the third time in a row since the start of the reporting period for the profit and loss statistics in 1999.**Compared with the previous year, it rose significantly once again (+ €2.4 billion, or + 2.2 %), amounting to €109.9 billion. The persistently high level of recent years also led to an increase in the long-term average, to €91.2 billion.**{#par-u89795}
****The record high seen in 2023, the year when the interest rate was raised significantly, was exceeded once again in 2025 -- this was mainly due to the rise in net interest income in the narrower sense.**Overall, interest income in the stricter sense of the word declined significantly on the year due to the lower interest rate level (− 19.0 %). However, the decrease in interest expenses was more pronounced on the liabilities side due to shorter interest rate fixation periods (− 26.3 %). Furthermore, interest income in the narrower sense remained well above the long-term average. By contrast, interest expenses in the reporting year came closer to their long-term average as a result of the overall decline in deposit rates, after having recently been significantly higher in a long-term comparison.**{#par-ia2323}
****In addition, current income from shares and other variable-yield securities, participating interests and shares in affiliated enterprises also increased.**It rose by a total of 7.2 % and thus also contributed to stabilising net interest income. Alongside big banks, this was particularly relevant for savings banks.**{#par-e7e174}
****In absolute terms, a large part of the increase in net interest income was attributable to big banks and, in particular, to a single institution. In relative terms, however, credit cooperatives especially saw a significant improvement in their net interest income as well (+ 5.1 %).**This was attributable, above all, to their markedly declining interest expenses (− 14.8 %), while their interest income decreased only slightly (− 2.4 %). Regional banks and other commercial banks recorded an increase of 2.7 % in their net interest income, also due to a sharp decline in their interest expenses. Savings banks' net interest income, meanwhile, rose slightly from its already high level of the previous year (+ 0.7 %), which was mainly due to interest rate hedges.**{#par-ea2764}
{#par-o19691}
**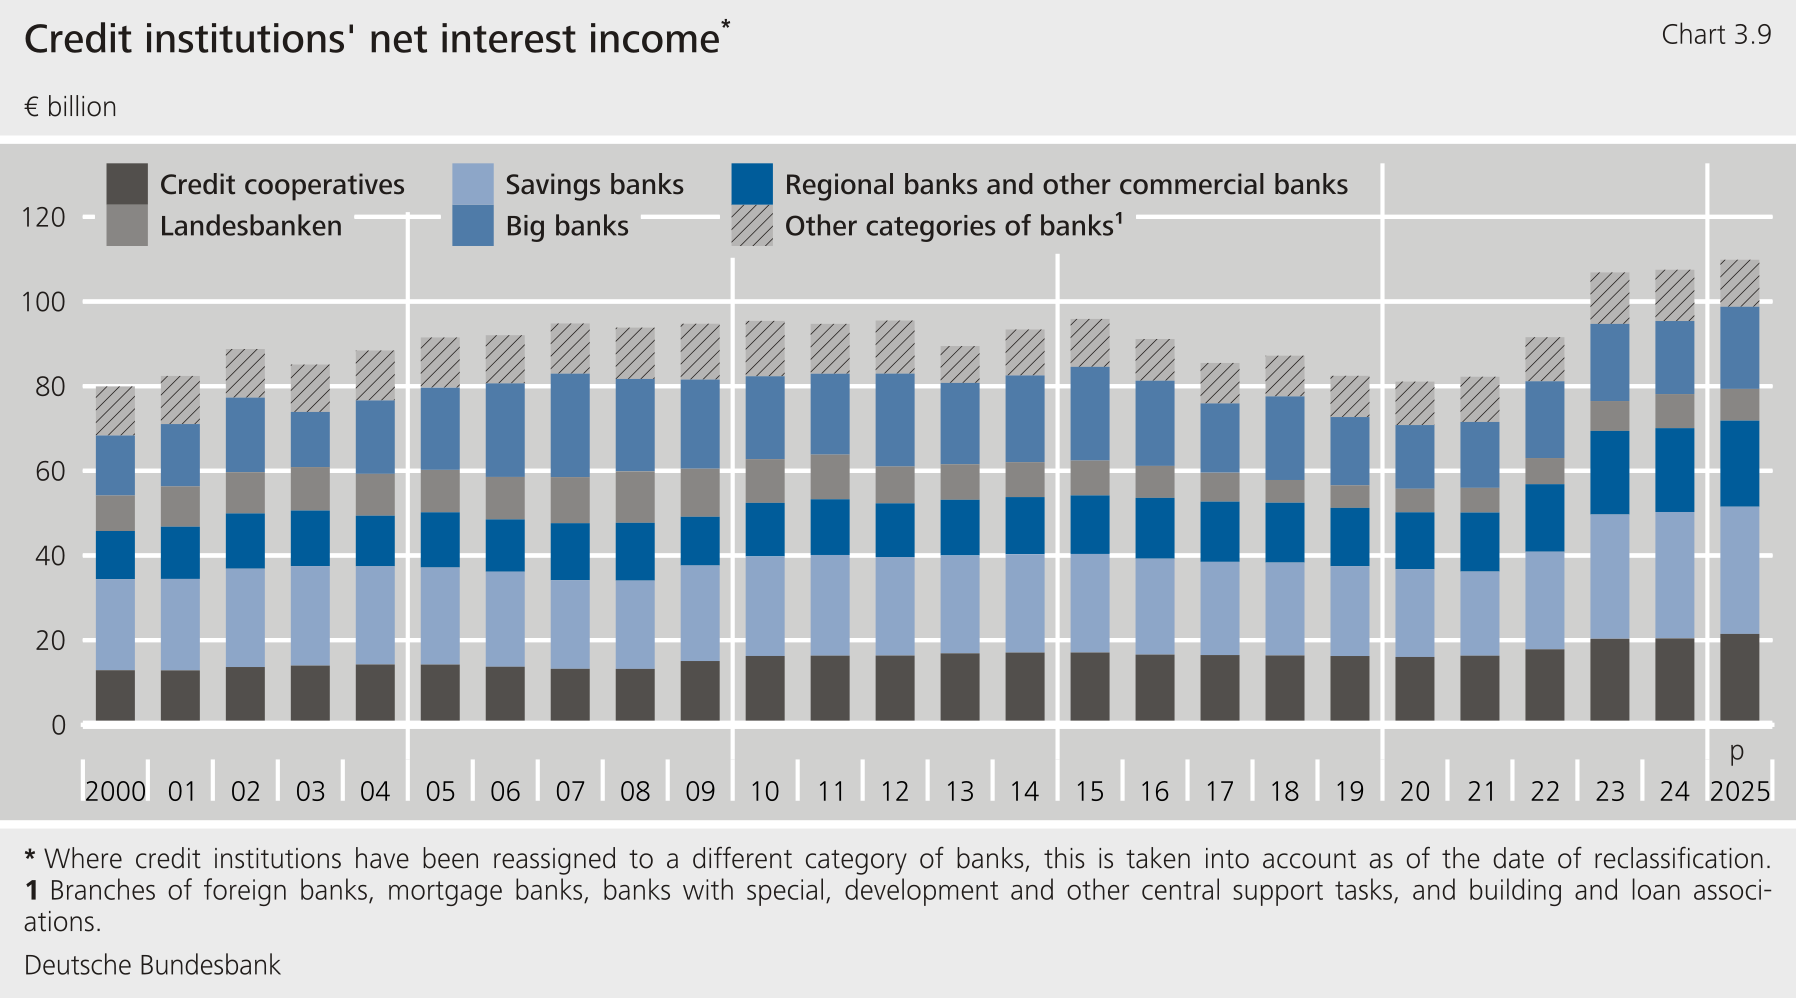**
****Viewed individually, the majority of institutions managed to maintain their high levels of net interest income in a long-term comparison.** Slightly more than 70 % of all the institutions under review recorded at least a marginal year-on-year increase in net interest income. For credit cooperatives, this share even amounted to 80 % across all the institutions under review. By contrast, regional banks' and other commercial banks' share stood at just 41 %.**{#par-u3e99o}
****Slightly less than 90 % of interest income is still generated from traditional lending and money market transactions.** By contrast, interest income from fixed income securities and debt register claims is of minor importance. Landesbanken in particular, which had benefited from the significant increase in their interest income from this segment in the previous year, recorded a substantial decline in this segment in the current reporting year (− 73.1 %).**{#par-o94461}
****The contribution made by interest income on deposits with the central bank declined markedly in the current reporting year.** On an annual average of 2025, credit institutions' interest-bearing deposits fell by 14.6 %, which was once again a significantly stronger decline than in the previous year (− 10 %). This reflects the ongoing reduction of the Eurosystem balance sheet.[\[34\]](#_ftn_root_34) At the same time, interest income on deposits with the central bank was dampened by the key interest rate cuts. It almost halved to €21.3 billion as a result, and thus accounted for only around 7 % of total interest income. At the same time, interest expenses for monetary policy refinancing operations almost ceased to exist, falling significantly by 90.8 % to just €0.1 billion (previous year: €1.1 billion).**{#par-ii6219}
{#par-i45i7e}
**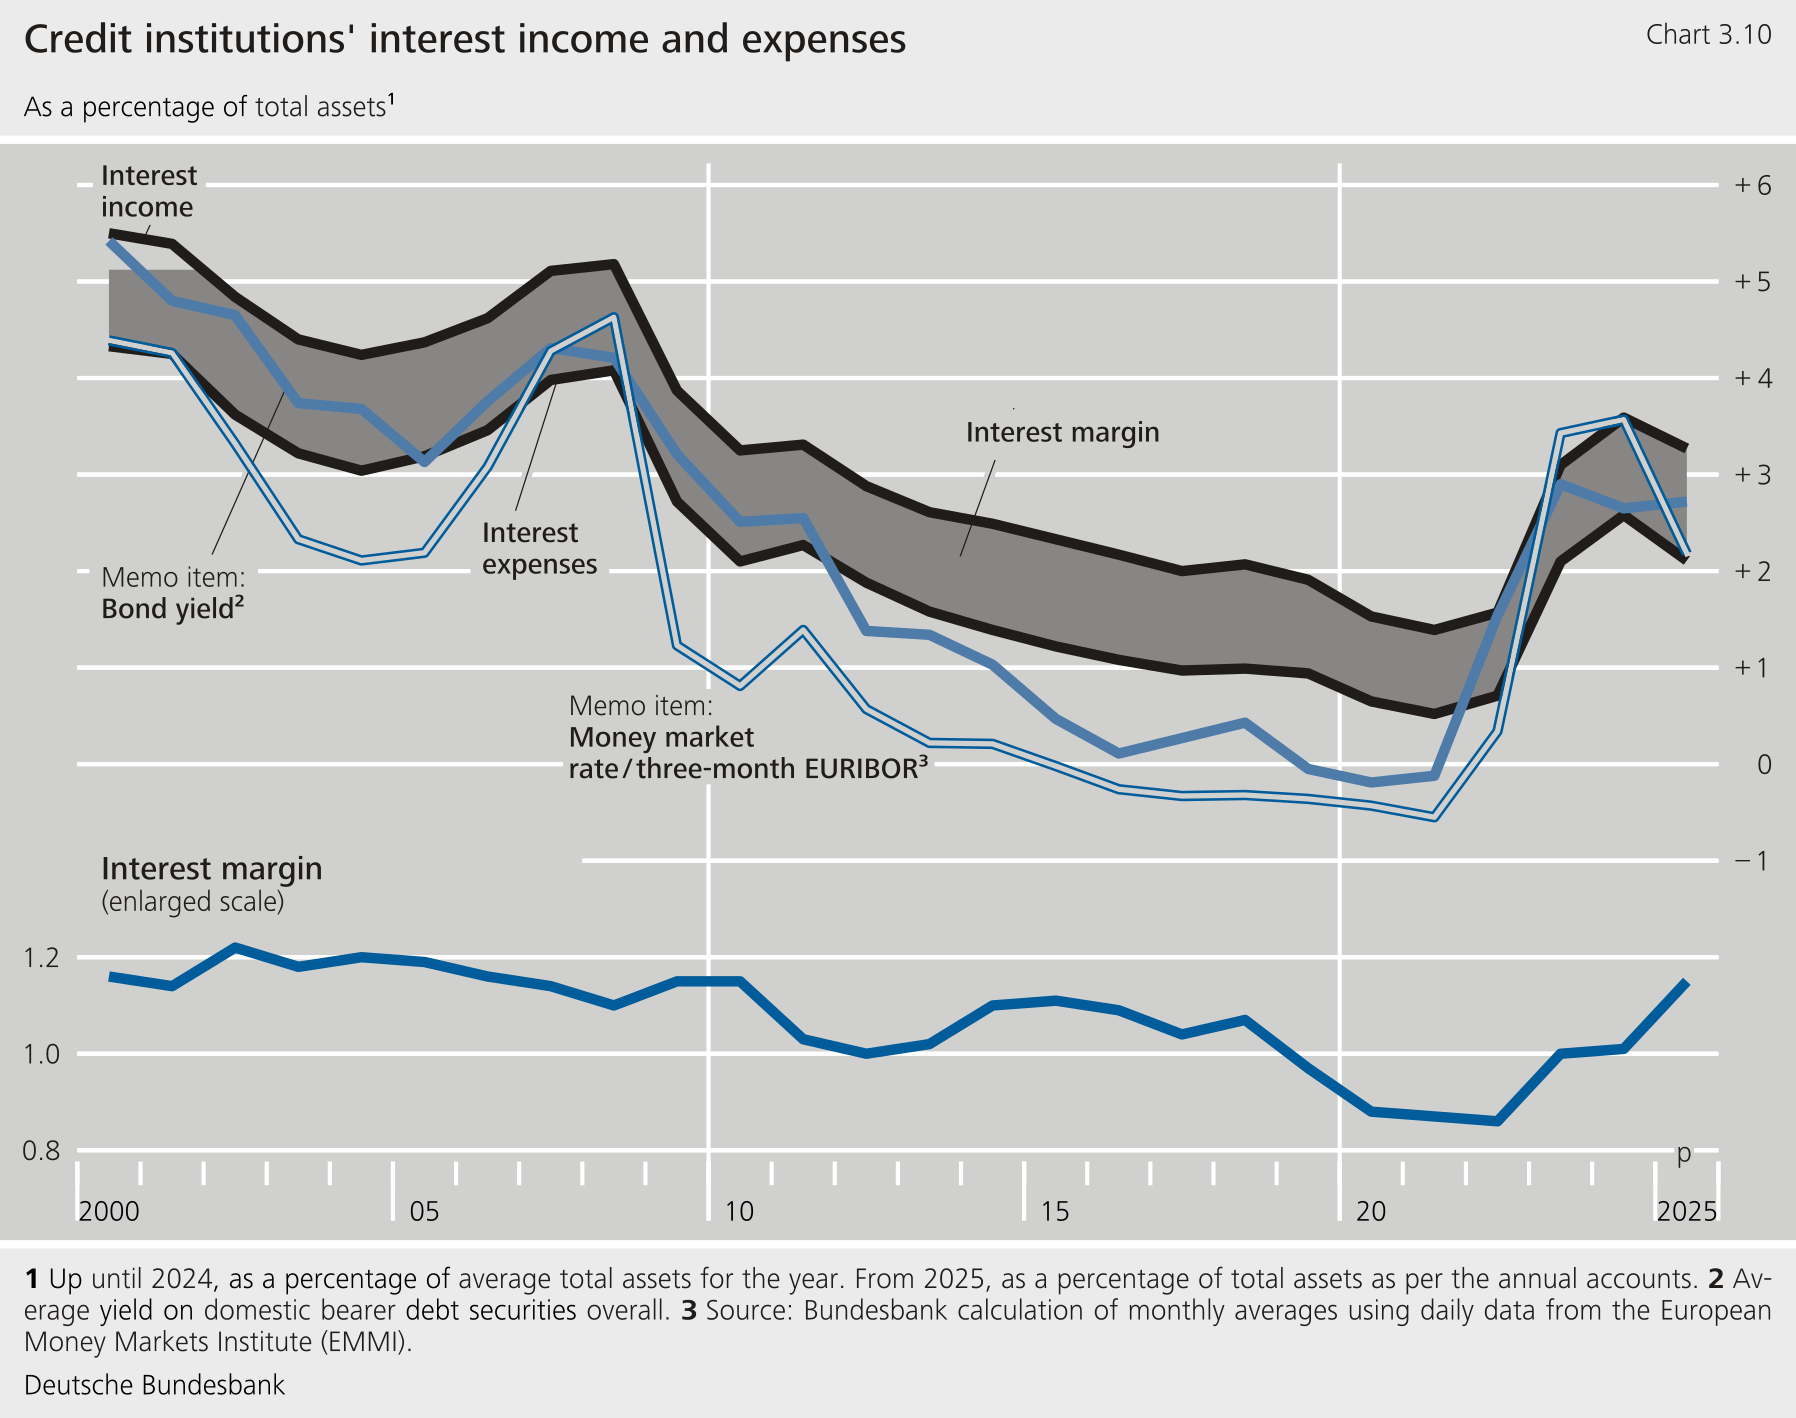**
****At 1.15 %, the interest margin** [\[35\]](#_ftn_root_35)**in the reporting year hovered around the previous year's level (1.16 %).** In a comparison across banks, it remains above average for credit cooperatives (1.75 %) and savings banks (1.88 %). However, both categories of banks' interest margins are still below their levels prior to the low interest rate period. At 1.14 %, the interest margin of regional banks and other commercial banks was roughly at the level of the overall average. Big banks' interest margin amounted to a little less than 1.0 % (previous year: 0.91 %).**{#par-o92454}
****2.1.1.2** **Net commission income****{#par-o37o55}
****Net commission income rose significantly again in the reporting year (+ 6.4 %) and also reached a new peak in the relevant reporting period for profit and loss statistics.**Its importance as the second largest income component has thus grown. At €43.6 billion in the reporting year, it was significantly up on the long-term average, which now stands at €30.3 billion.**{#par-i956e5}
****As a result of its increase, net commission income was once again a key driver of growth in operating income.** Regional banks and other commercial banks once again recorded the largest increase in net commission income in relative terms (+ 11.0 %). Besides big banks (+ 5.7 %), savings banks, in particular, significantly increased their net commission income once more (+ 5.4 %). This was mainly attributable to growth in payments business and substantial growth in customers' securities business. Credit cooperatives also recorded an increase of 3.4 %. Here, too, developments were largely driven by growth in brokerage business and securities business.[\[36\]](#_ftn_root_36)**{#par-i3o4ei}
{#par-e27ie5}
**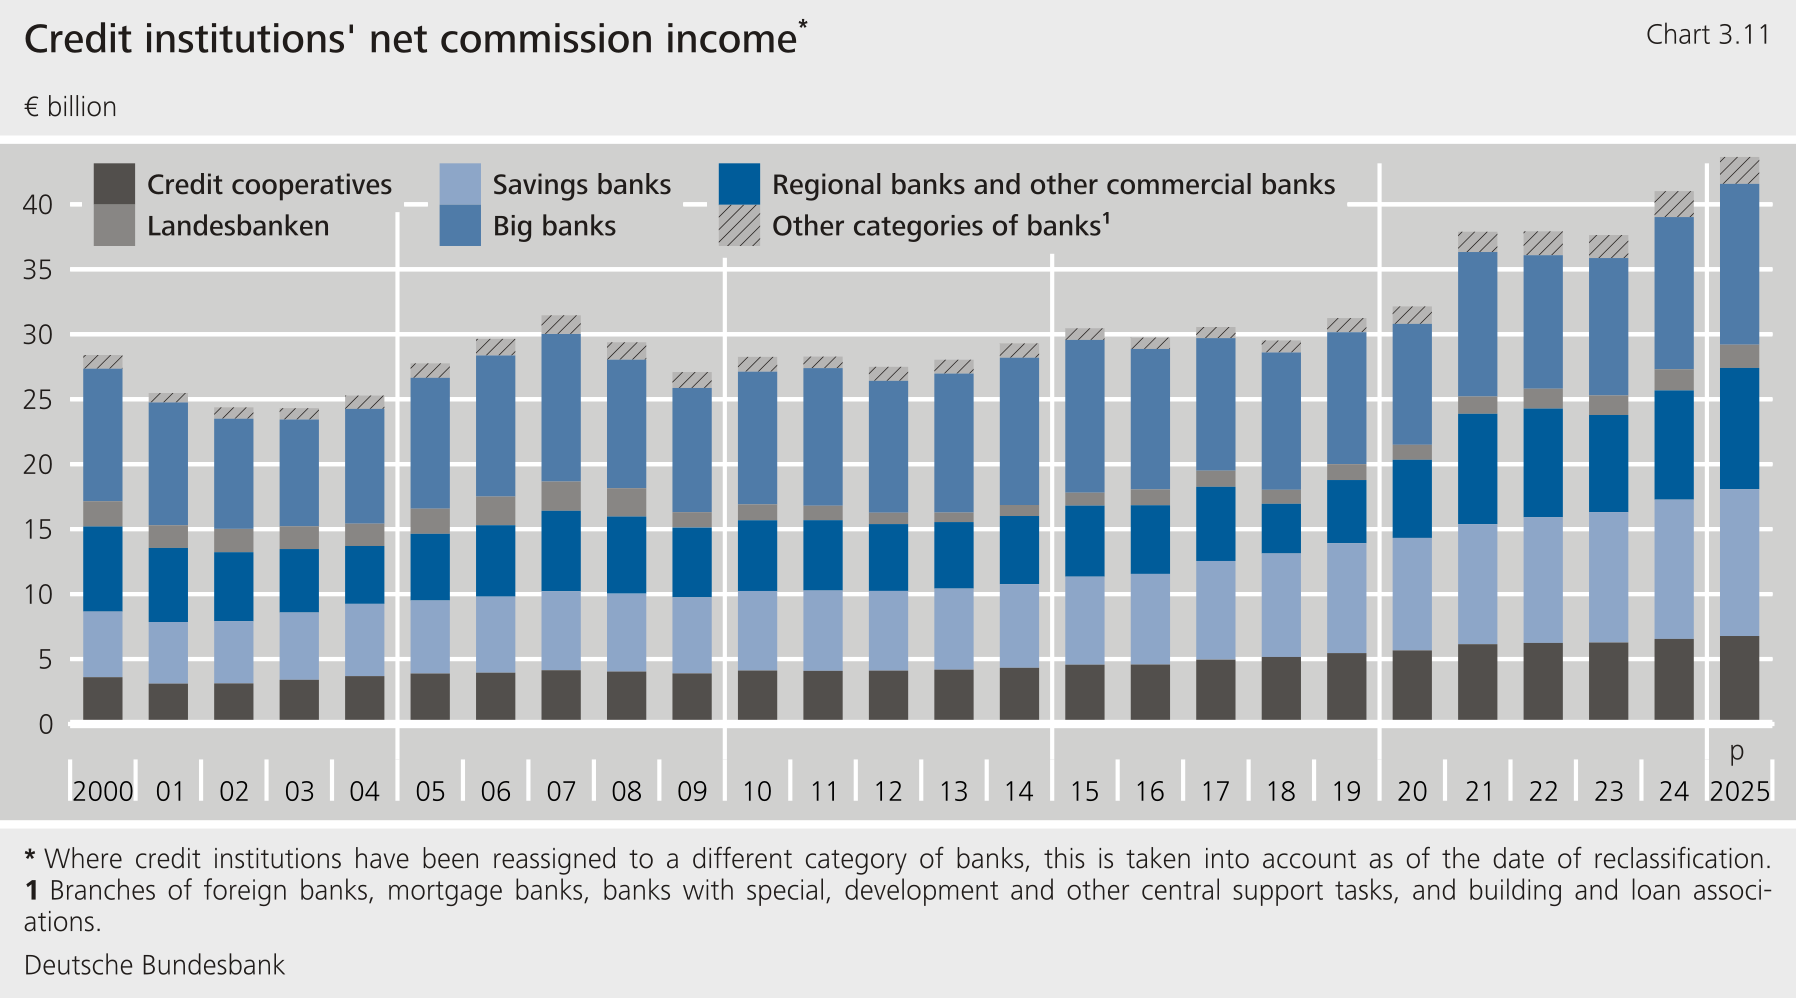**
****Developments at the individual institution level confirmed this impression: almost three-quarters of all banks reported stable or increased net commission income.**These developments were particularly clear in the case of savings banks, 90 % of which generated net commission income that at least remained the same in the reporting year. For credit cooperatives, this share amounted to around 66 %. Developments at regional banks and other commercial banks were less uniform. Here, 60 % of institutions recorded net commission income that at least remained at the same level.**{#par-aa21u1}
****The commission margin** [\[37\]](#_ftn_root_37)**rose minimally to 0.46 % (previous year: 0.44 %).** Savings banks, regional banks and other commercial banks achieved commission margins of 0.71 % and 0.52 %, respectively, slightly above the previous year's level.At 0.62 % and 0.55 %, respectively, the commission margins of big banks and credit cooperatives in the reporting year were also roughly the same as in the previous year.**{#par-a55iu5}
****2.1.1.3** **Net result from the trading portfolio****{#par-i578ui}
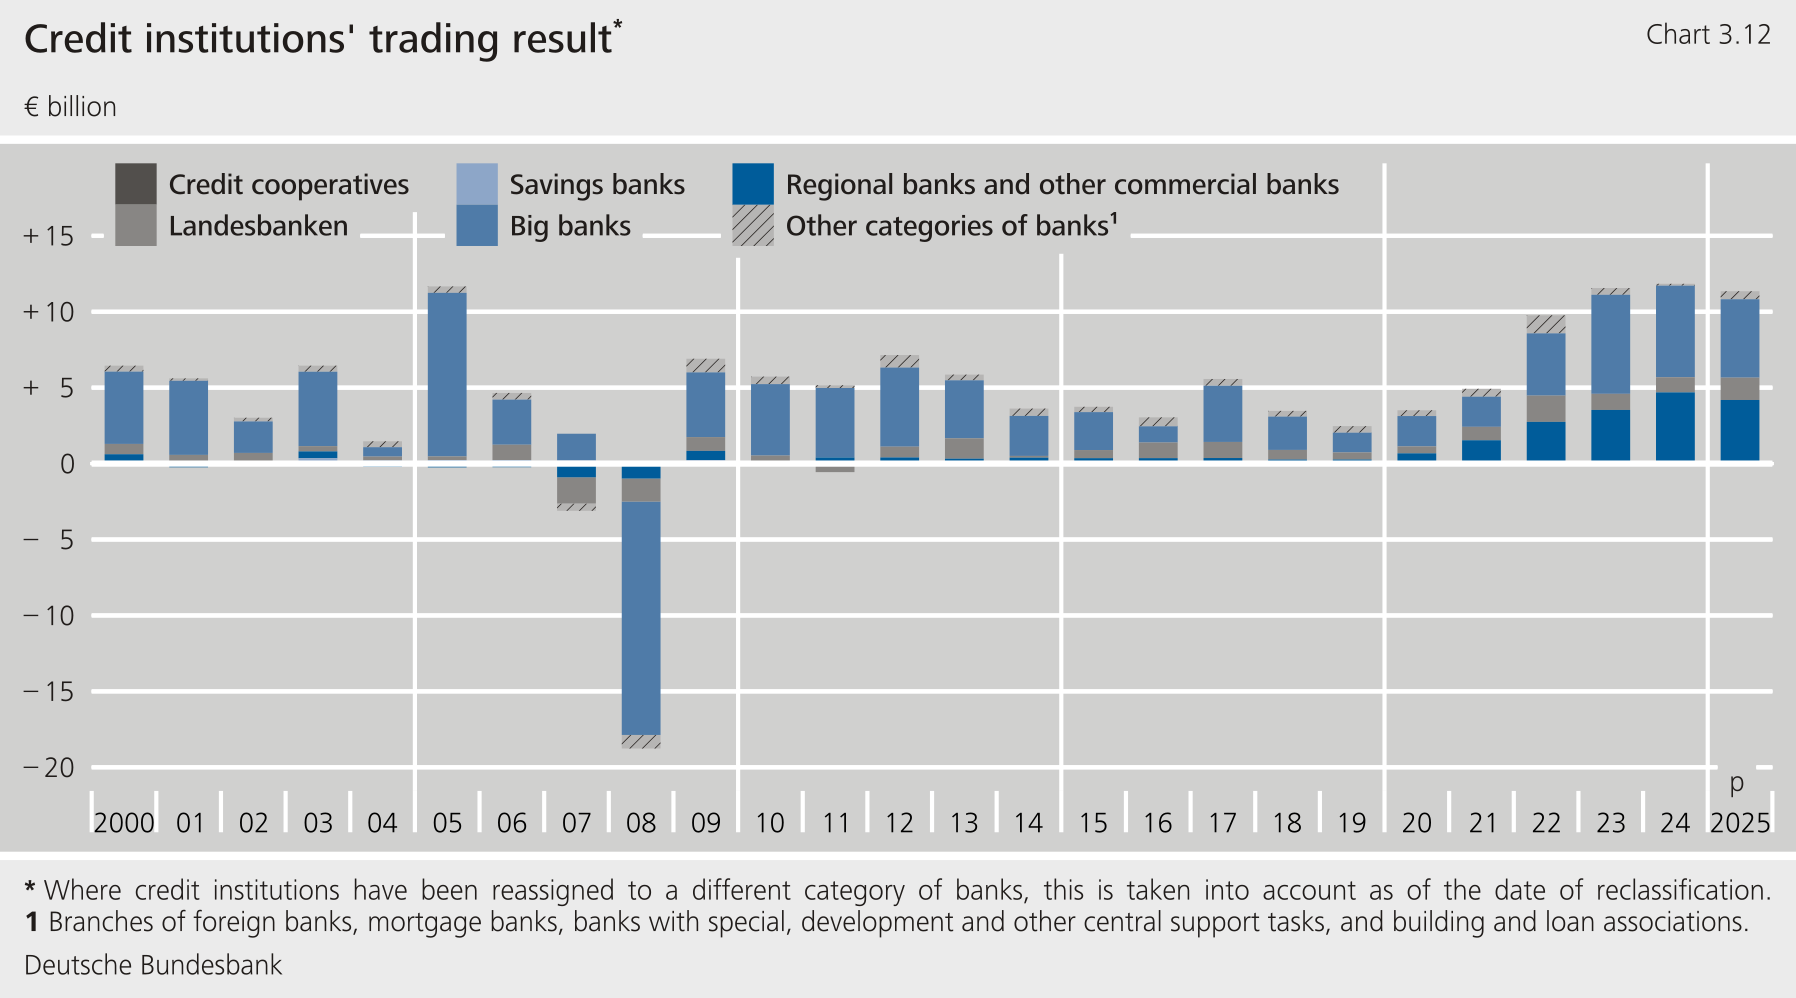
****The net result from the trading portfolio is not relevant for all categories of banks, meaning that it was once again of minor importance for overall developments.** Compared with the previous year, it fell by 4.1 % to €11.4 billion, thus accounting for less than 7 % of operating income. However, it remains a key source of income for big banks, regional banks, other commercial banks and Landesbanken.**{#par-a4ui72}
**The net result from the trading portfolio is a very volatile income component and is strongly driven by developments at individual institutions. In the current reporting year, it rose steeply at Landesbanken (+ 47.8 %). All Landesbanken recorded at least a slight increase. By contrast, big banks, regional banks and other commercial banks recorded marked declines overall (− 14.4 % and − 10.7 %, respectively).**{#par-aiu6eo}
{#par-o998iu}
****
****2.1.1.4** **Other operating result****{#par-u6167a}
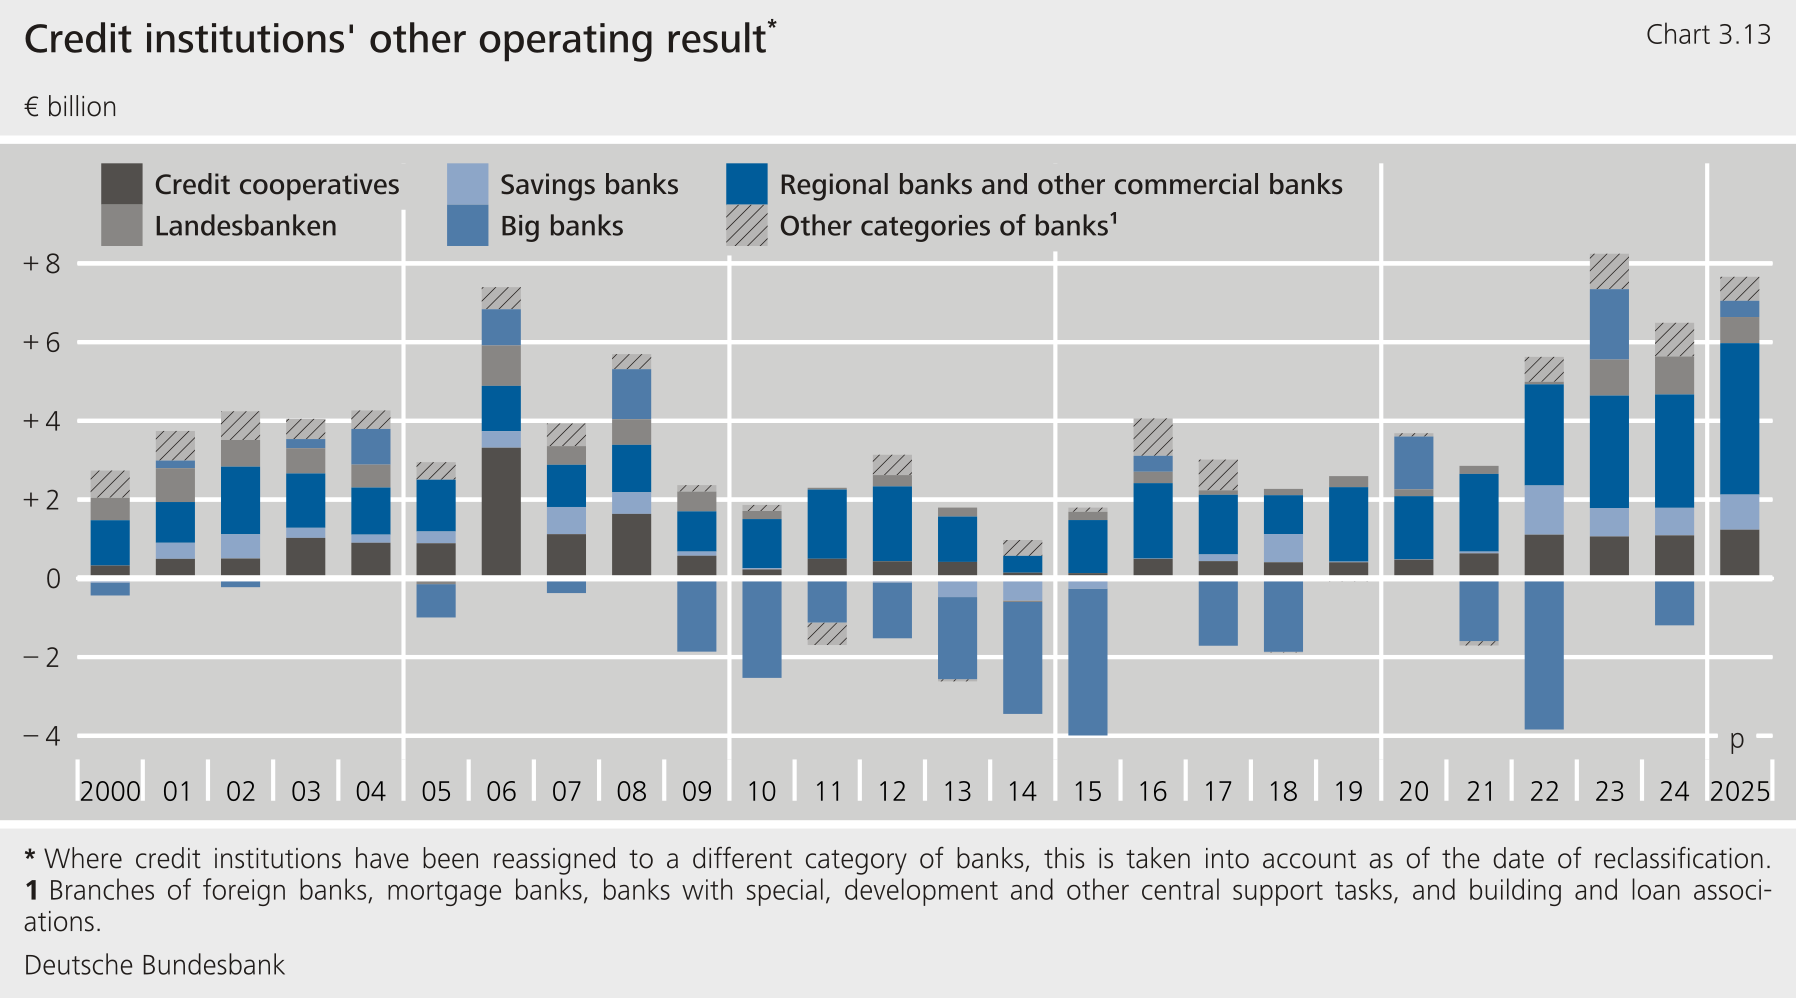
****The other operating result** [\[38\]](#_ftn_root_38)**increased in the reporting year by 44.6 % to €7.7 billion.**It thus made a similarly large contribution to the increase in operating income as net interest income. The absence of provisions at a single institution in the category of big banks was the key factor here.**{#par-o94233}
{#par-ii86i5}
****
#### **2.1.2 Net valuation charges** {#tar-9}
****Overall, net valuation charges** [\[39\]](#_ftn_root_39)**declined (− 9.1 %) and thus contributed to the stabilisation of aggregate profit for the year.** They stood at €11.9 billion in 2025 and were therefore below the long-term average of €13.4 billion. Without the one-off effect at an institution in the category of big banks, however, net valuation charges would have increased slightly.**{#par-o1ia8o}
****Net valuation charges rose significantly on the year at credit cooperatives, savings banks and regional and other commercial banks.** The increase was particularly dramatic for credit cooperatives (+ 41.6 %). Their net valuation charges stood at €2.7 billion as a result, well above the long-term average of €1.7 billion. The same was true of savings banks. Here, too, net valuation charges increased markedly (+ 29.6 %) and, at €3.2 billion at the end of 2025, significantly exceeded the long-term average of €2.3 billion. Net valuation charges at regional banks and other commercial banks increased by 20.6 % on the year to €3.1 billion, with the long-term average now standing at €2.0 billion.**{#par-ou6o1a}
{#par-iiu6e4}
**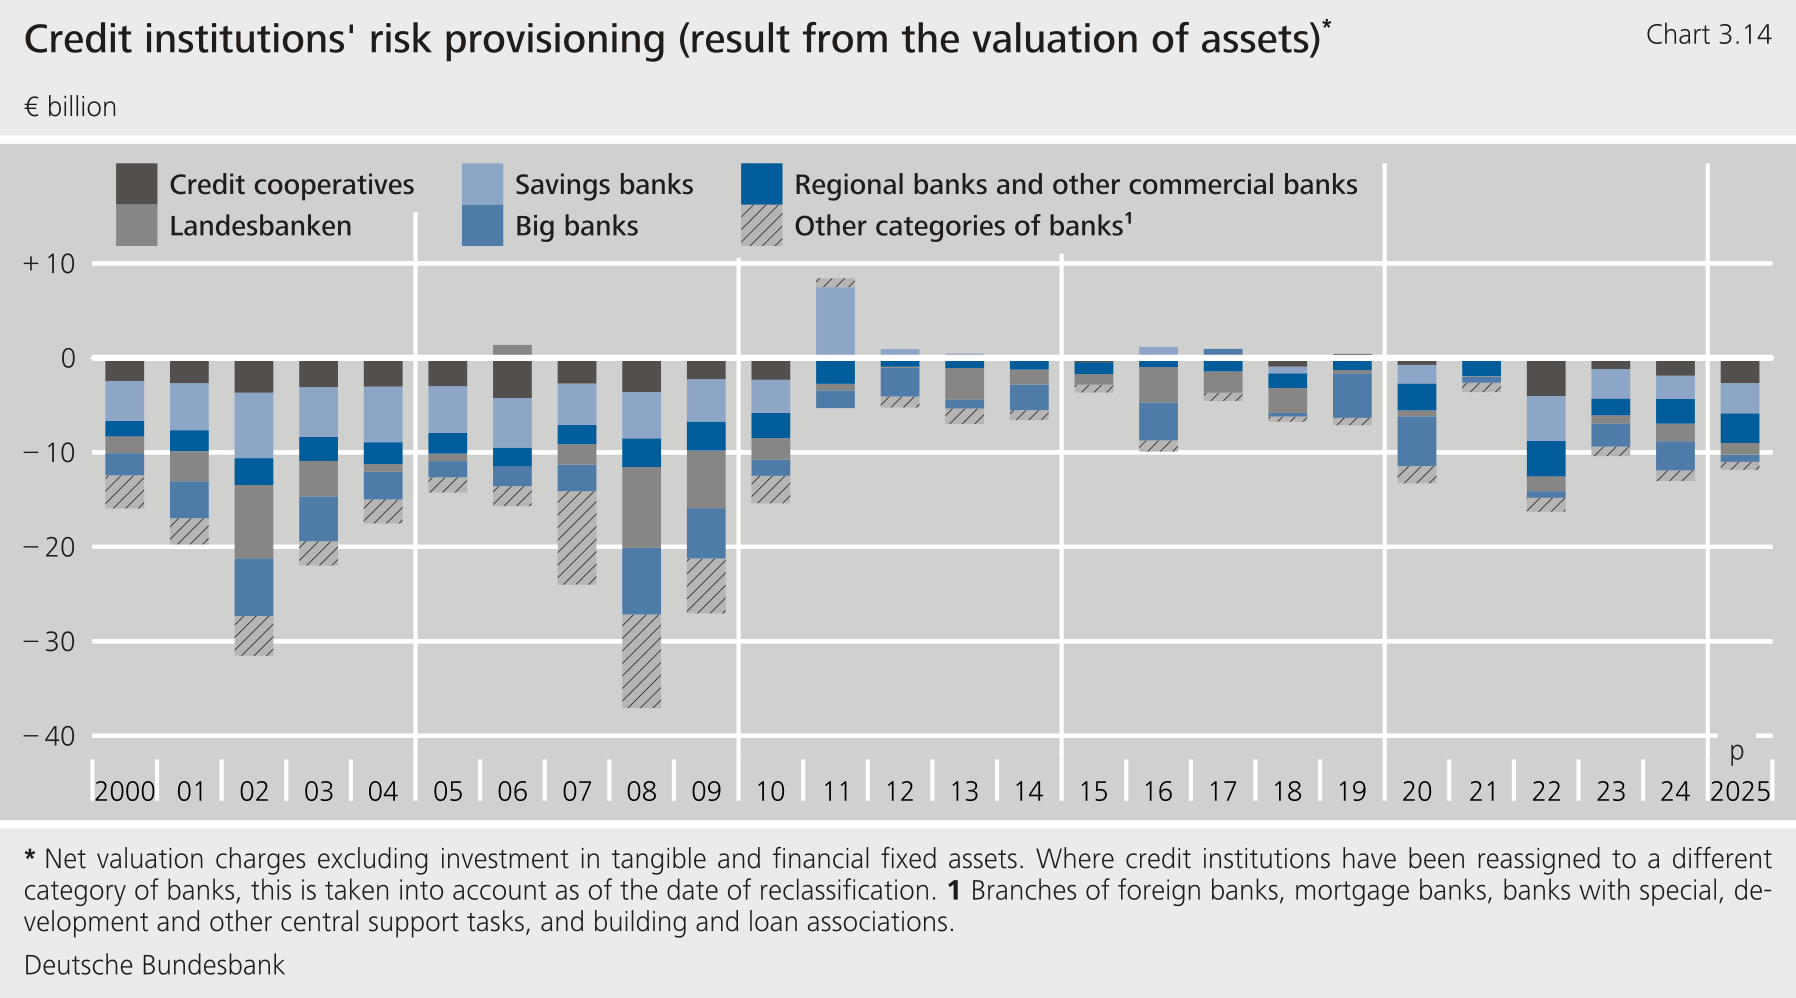**
****Overall, net valuation charges have increased for the majority of institutions.** 720 of the 1,171 institutions under review recorded higher net valuation charges.In the case of savings banks, this share amounted to more than 60 % across the institutions under review, and it even stood at over 65 % for credit cooperatives. More than one-half of regional banks and other commercial banks also reported a deterioration in results from the valuation of assets.**{#par-e67o47}
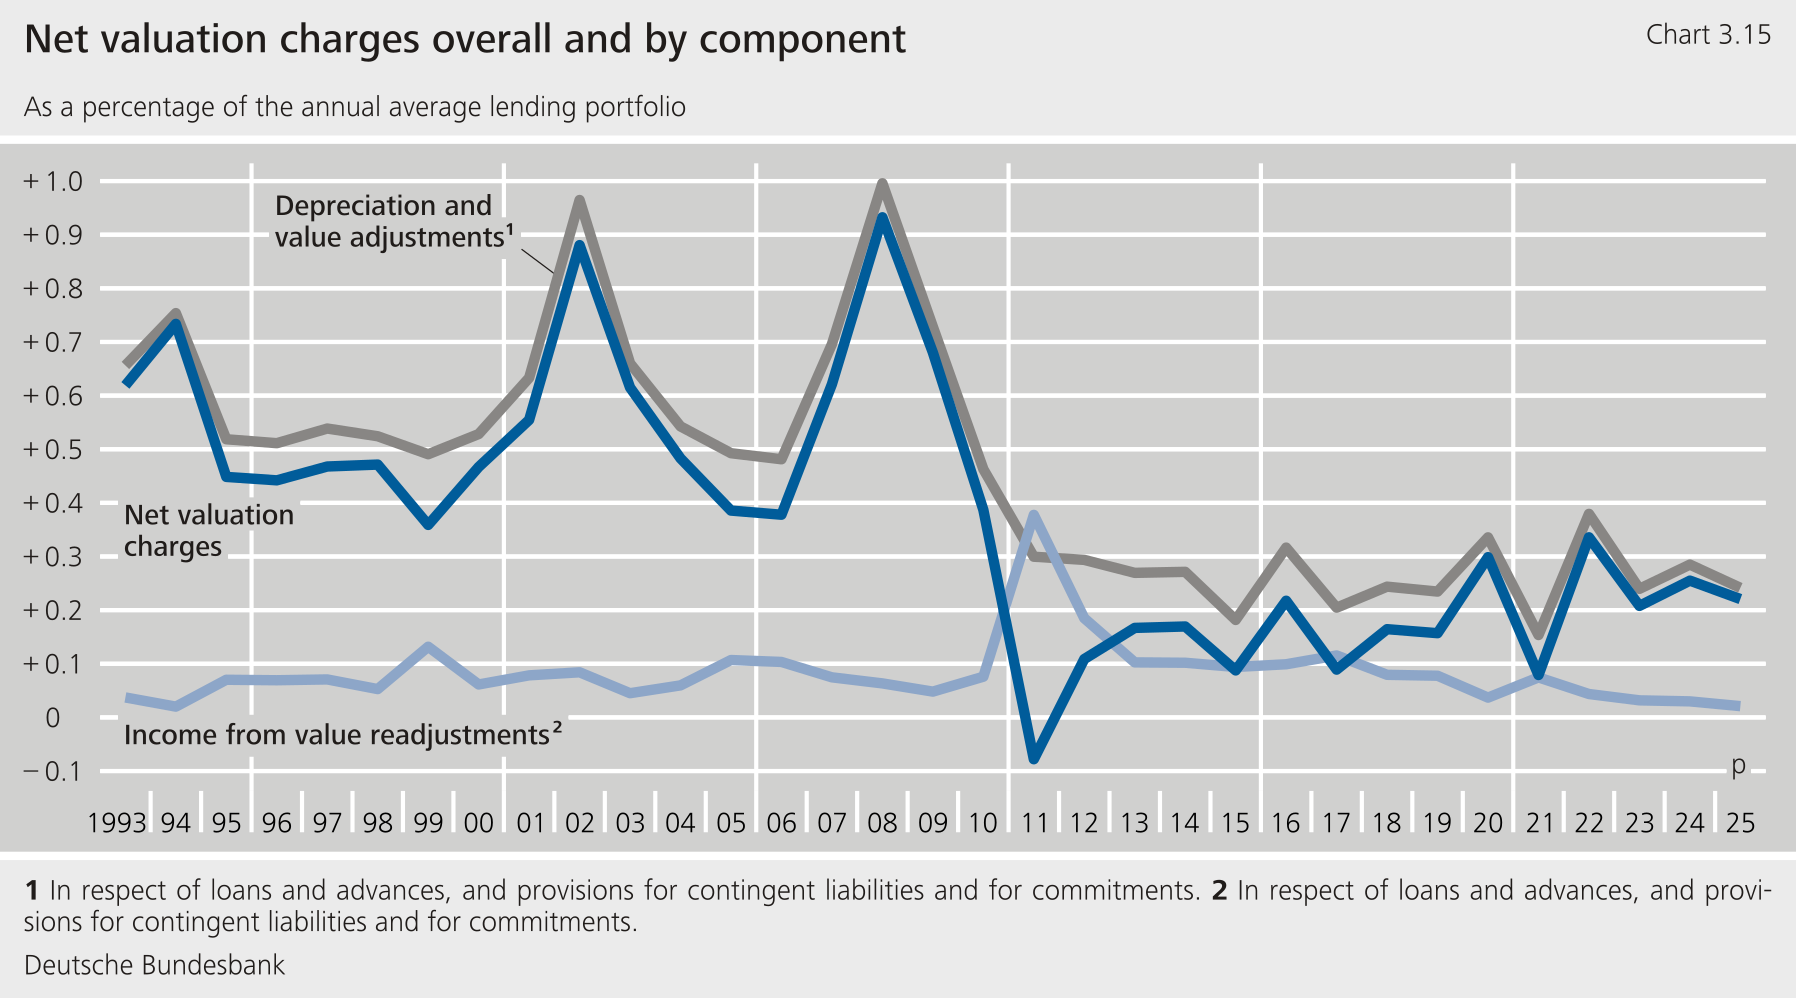
****Developments in net valuation charges should be viewed against the backdrop of the difficult macroeconomic environment.**Compared with previous periods of economic weakness, however, the net valuation charges for the banking system as a whole have remained at a reasonable level so far (see Chart 3.15). For savings banks and credit cooperatives, the higher values for net valuation charges recorded since 2022 can also be seen as a return to normality, after having often been close to zero in the previous decade.**{#par-i5e3iu}
{#par-oaua29}
****
****Against the backdrop of prolonged uncertainty in the macroeconomic environment, German credit institutions once again increased their risk provisioning, too.** This is reflected, amongst other things, in transfers to the fund for general banking risks, which remain well above the long-term average.Savings banks and credit cooperatives, in particular, substantially increased their risk provisioning again. Transfers were down on the year overall (− 8.1 %). However, at €14.3 billion, they remained well above the long-term average of €7.9 billion. At the same time, amounting to €1.3 billion, withdrawals from the fund remained low or at the level of the long-term average. Net transfers to the fund for general banking risks thus came to €13.0 billion in the reporting year, compared with €14.5 billion in the previous year.Savings banks made net transfers of slightly less than €8 billion, while credit cooperatives made net transfers of a little less than €4 billion.**{#par-o1214i}
****In addition, German credit institutions had hidden net reserves on securities in the banking book, which amounted to around €12 billion in aggregate terms at the end of 2025.** Unlike the fund for general banking risks, however, these are not directly visible on the balance sheet. The rise in interest rates from mid-2022 had initially led to the build-up of hidden net losses on securities in the banking book of German institutions. However, these have declined sharply since the second half of 2023 and were converted back into net reserves as of the second half of 2024.[\[40\]](#_ftn_root_40)**{#par-a1o387}
#### **2.1.3 Administrative spending** {#tar-10}
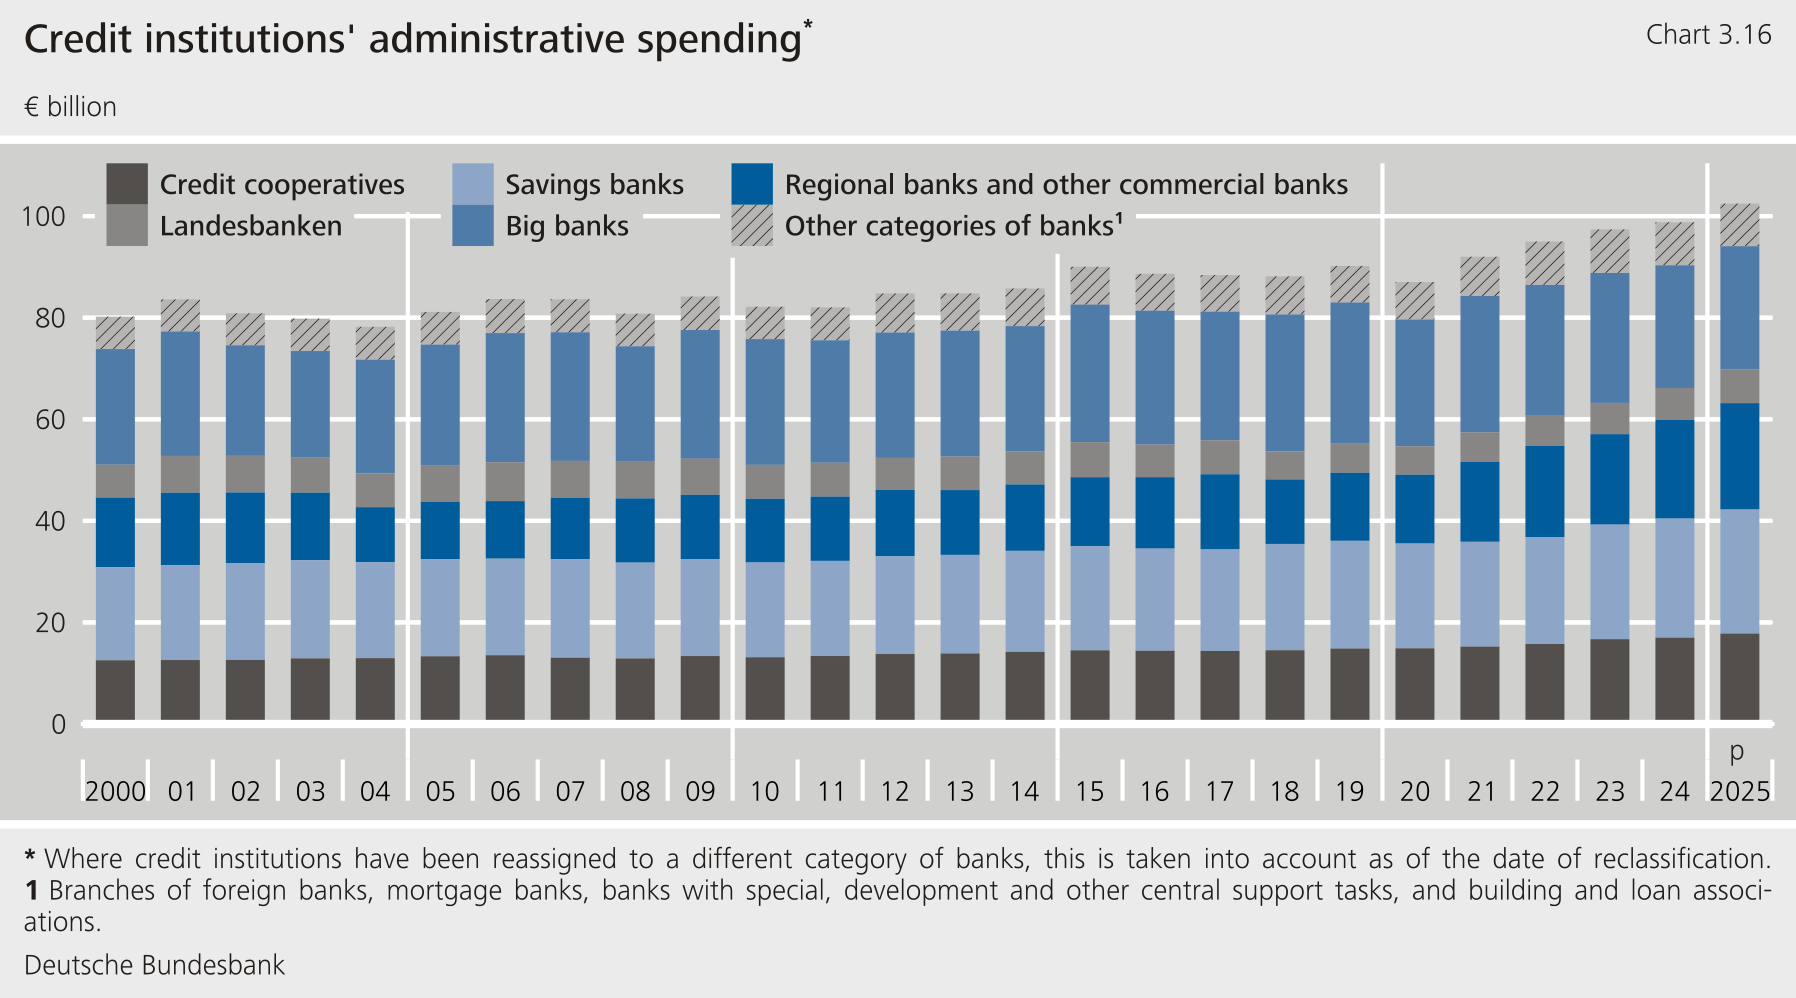
****Administrative spending** [\[41\]](#_ftn_root_41)**rose again significantly in the reporting year.**An increase of 3.7 % to €102.5 billion continued the growth trend that has been ongoing since 2020.**{#par-ouii9u}
****The increase in aggregate terms was mainly driven by higher staff costs.**These increased by a total of €2.8 billion (+ 5.7 %), primarily owing to higher wages and salaries. In addition, social security contributions and costs relating to pensions also continued to rise. Other administrative spending's contribution to the overall increase only amounted to €0.8 billion (+ 1.7 %).**{#par-u971i5}
****The increase in administrative spending was once again particularly pronounced at regional banks and other commercial banks (+ 7.8 %).** Both staff costs and other administrative spending rose markedly.[\[42\]](#_ftn_root_42)**{#par-o5o34o}
****Credit cooperatives and savings banks also recorded significant increases in administrative spending (+ 4.7 % and + 4.2 %, respectively).** In absolute terms, the increase in staff costs was substantially larger than the increase in other administrative expenses in each case. This was primarily attributable to wage increases. In relative terms, however, other administrative spending also rose markedly.[\[43\]](#_ftn_root_43) This was due, amongst other things, to an increase in investment and generally higher costs owing to the general rise in prices during the reporting period.**{#par-ao2577}
**At Landesbanken, administrative spending also rose significantly (+ 6.3 %). Meanwhile, big banks' administrative spending hovered roughly around the level of the previous year overall.**{#par-a5oioo}
****The picture was fairly clear when looking at all institutions covered by the profit and loss statistics individually.**988 out of a total of 1,171 institutions recorded an increase in their administrative spending. For savings banks, this figure was 90 %, while for credit cooperatives it was almost 85 %. Meanwhile, the share of institutions in the category of regional and other commercial banks reporting an increase stood at almost 80 %.**{#par-a65ie7}
{#par-e1a357}
****
#### **2.1.4 Balance in the other and extraordinary account** {#tar-11}
****The negative balance in the other and extraordinary account** [\[44\]](#_ftn_root_44)**increased significantly on the year by €3.5 billion.**In absolute terms, however, this was mainly due to one-off effects at individual institutions. Within the group of regional banks and other commercial banks, income from value readjustments to participating interests, shares in affiliated enterprises and securities treated as fixed assets declined, following a significant increase in the previous year as a result of the sale of a subsidiary. One institution in the group of big banks formed restructuring provisions for staff reductions in Germany, whilst at the same time, value readjustments to the carrying amounts of investments were significantly lower than in the previous year.**{#par-uo8ee4}
| **Table 3.3: Breakdown of extraordinary result** € million ||||
| Item | 2023 | 2024 | 2025^p^ |
| Other and extraordinary result | -- 8,007 | -- 2,403 | -- 5,864 |
| Income (total) | 2,675 | 6,621 | 3,163 |
| Value readjustments to participating interests, shares in affiliated enterprises, and securities treated as fixed assets | 1,567 | 5,934 | 2,770 |
| from loss transfers | 26 | 41 | 56 |
| Extraordinary income | 1,082 | 646 | 337 |
| Charges (total) | -- 10,682 | -- 9,024 | -- 9,027 |
| Depreciation of and value adjustments to participating interests, shares in affiliated enterprises, and securities treated as fixed assets | -- 2,609 | -- 922 | -- 1,403 |
| from loss transfers | -- 480 | -- 334 | -- 739 |
| Extraordinary charges | -- 753 | -- 537 | -- 1,883 |
| Profits transferred under profit pooling, a profit transfer agreement or a partial profit transfer agreement | -- 6,840 | -- 7,231 | -- 5,002 |
|--------------------------------------------------------------------------------------------------------------------------------------------|-----------|----------|----------|
{#par-e751uo}
### **2.2 Profitability and cost efficiency** {#tar-12}
**Measured in terms of the return on assets and return on equity, profitability remained at a high level by long-term standards. Cost efficiency -- as measured in terms of the cost/income ratio -- remained virtually unchanged compared with the previous year.**{#par-ao4267}
#### **2.2.1 Return on assets and equity** {#tar-13}
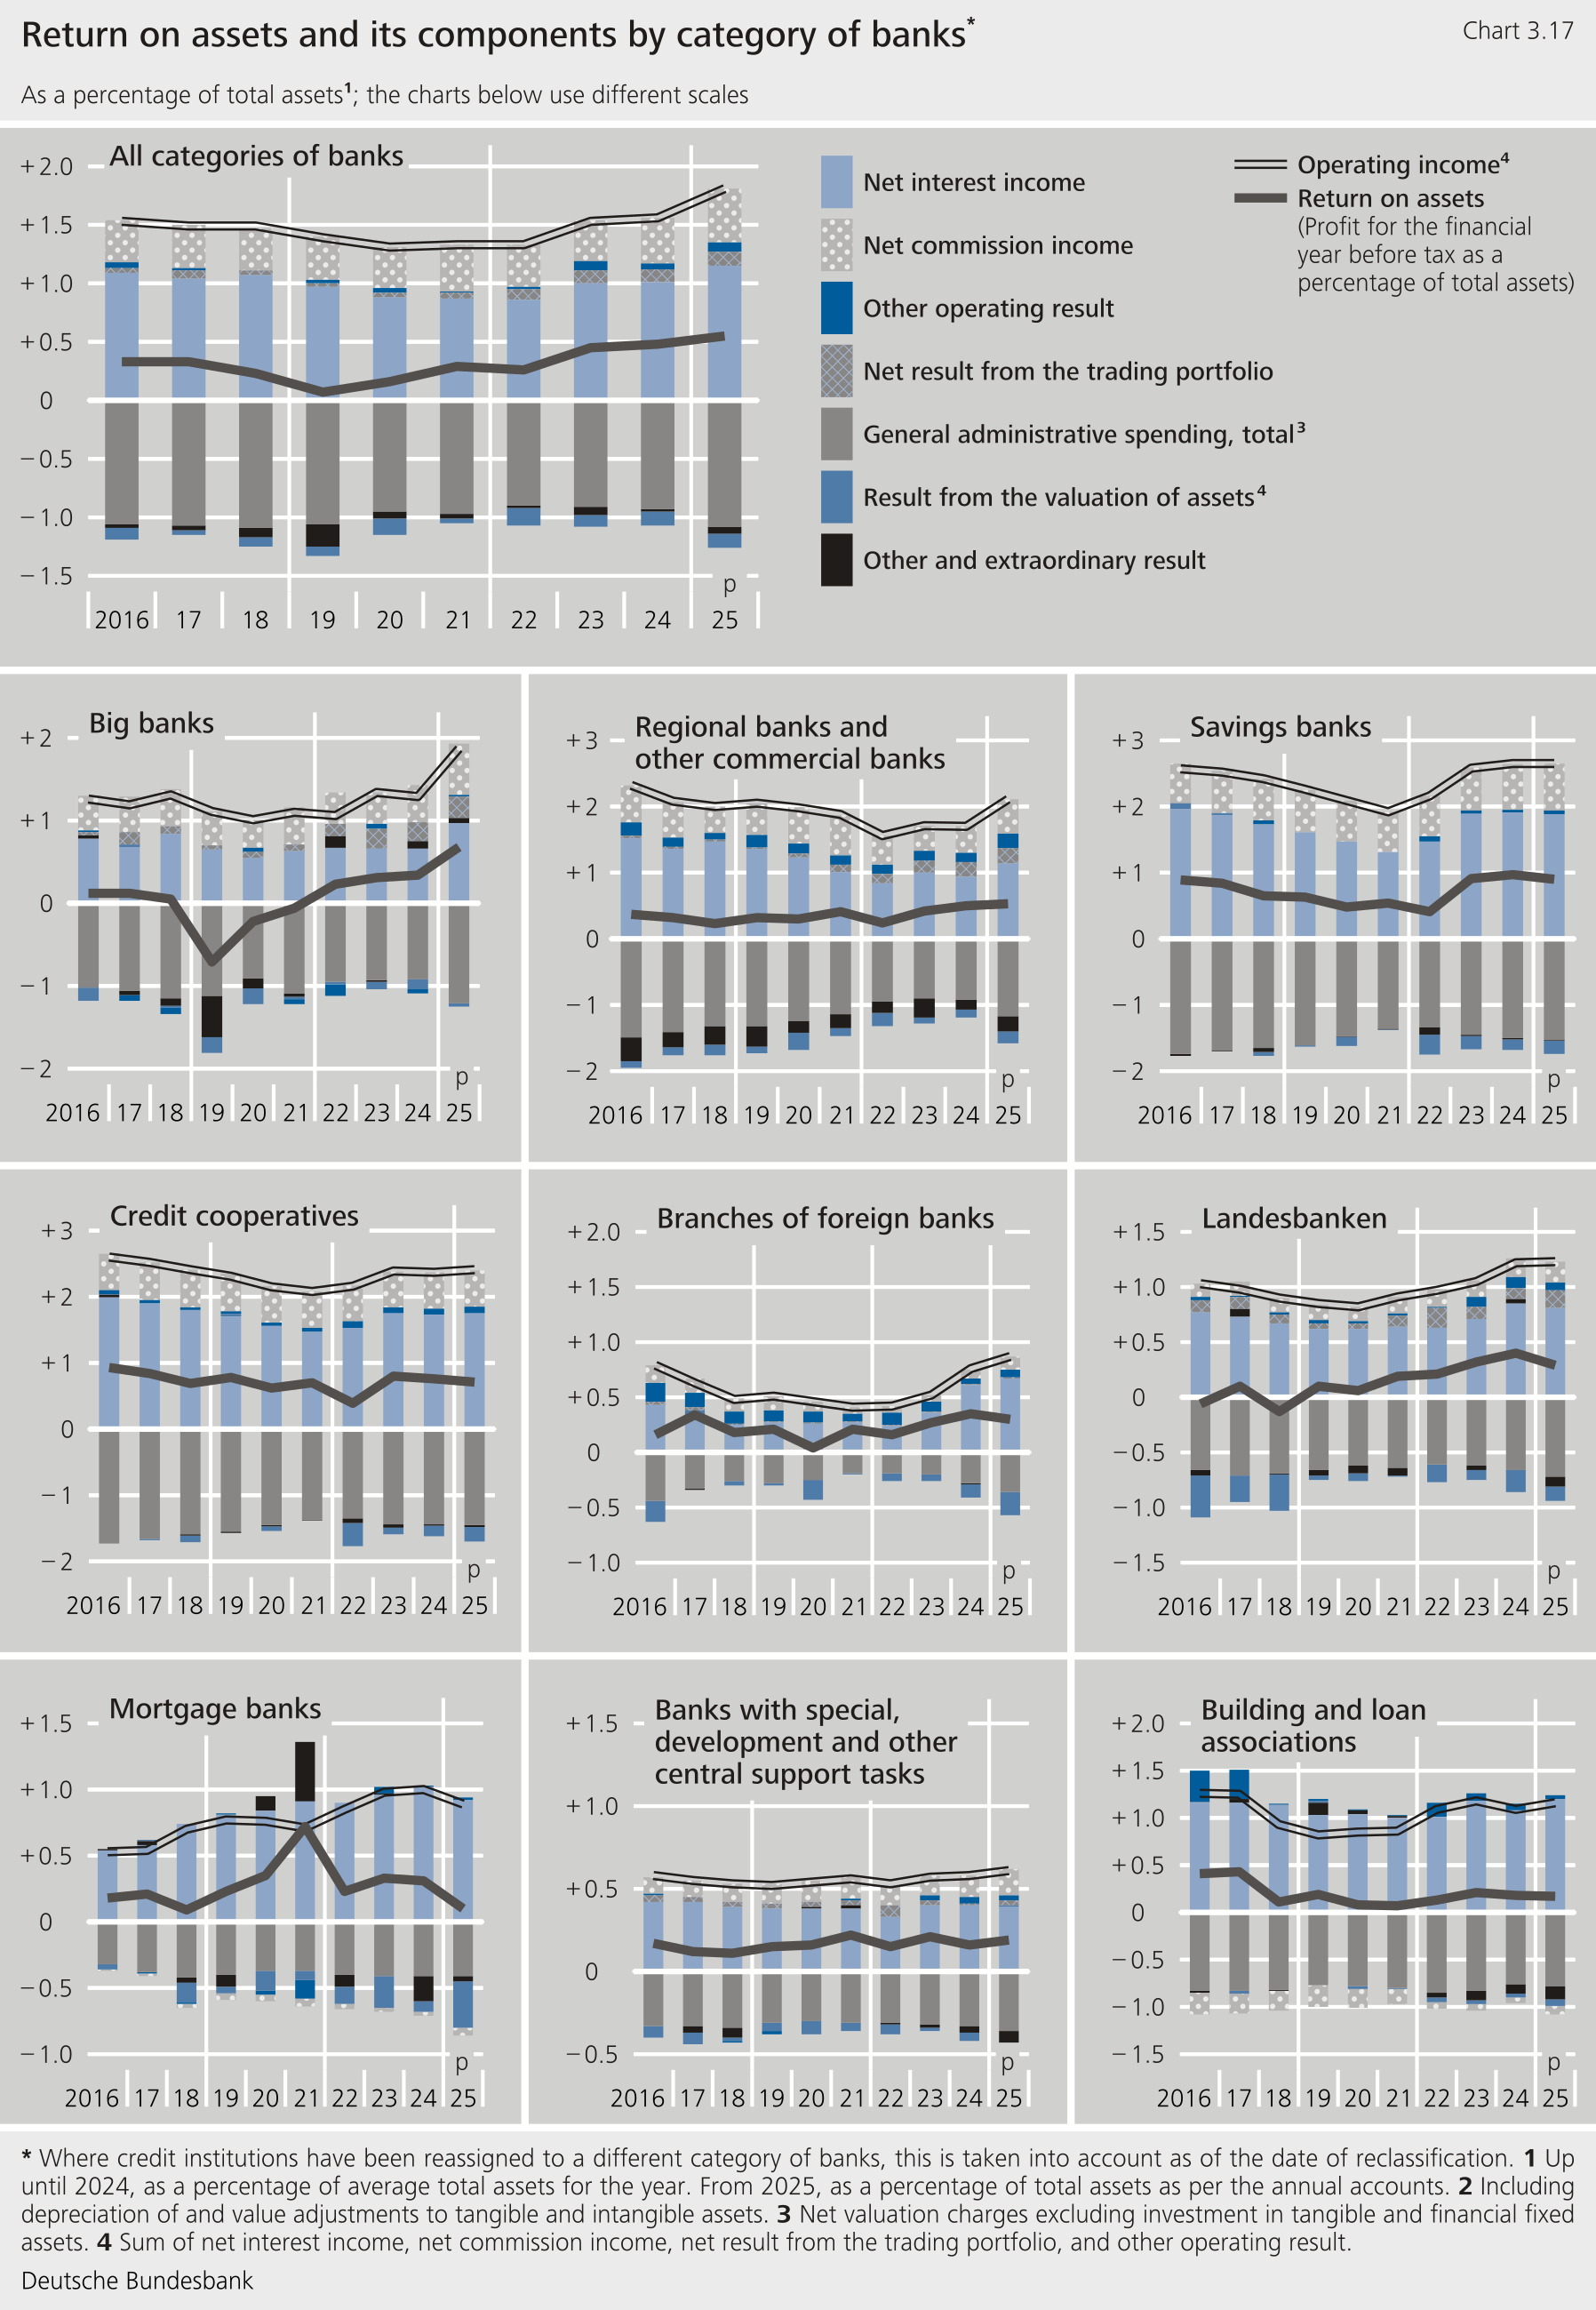
****At 0.55 % in the reporting year, the return on assets** [\[45\]](#_ftn_root_45)**of German credit institutions remained roughly at the level of the previous year.** The slight rise in total assets more or less offset the overall slight increase in profit for the financial year. Savings banks continued to record the highest return on assets (0.90 %). At 0.71 %, credit cooperatives likewise generated a return on assets well above the average across all categories of banks.**{#par-io5765}
{#par-u1777u}
****
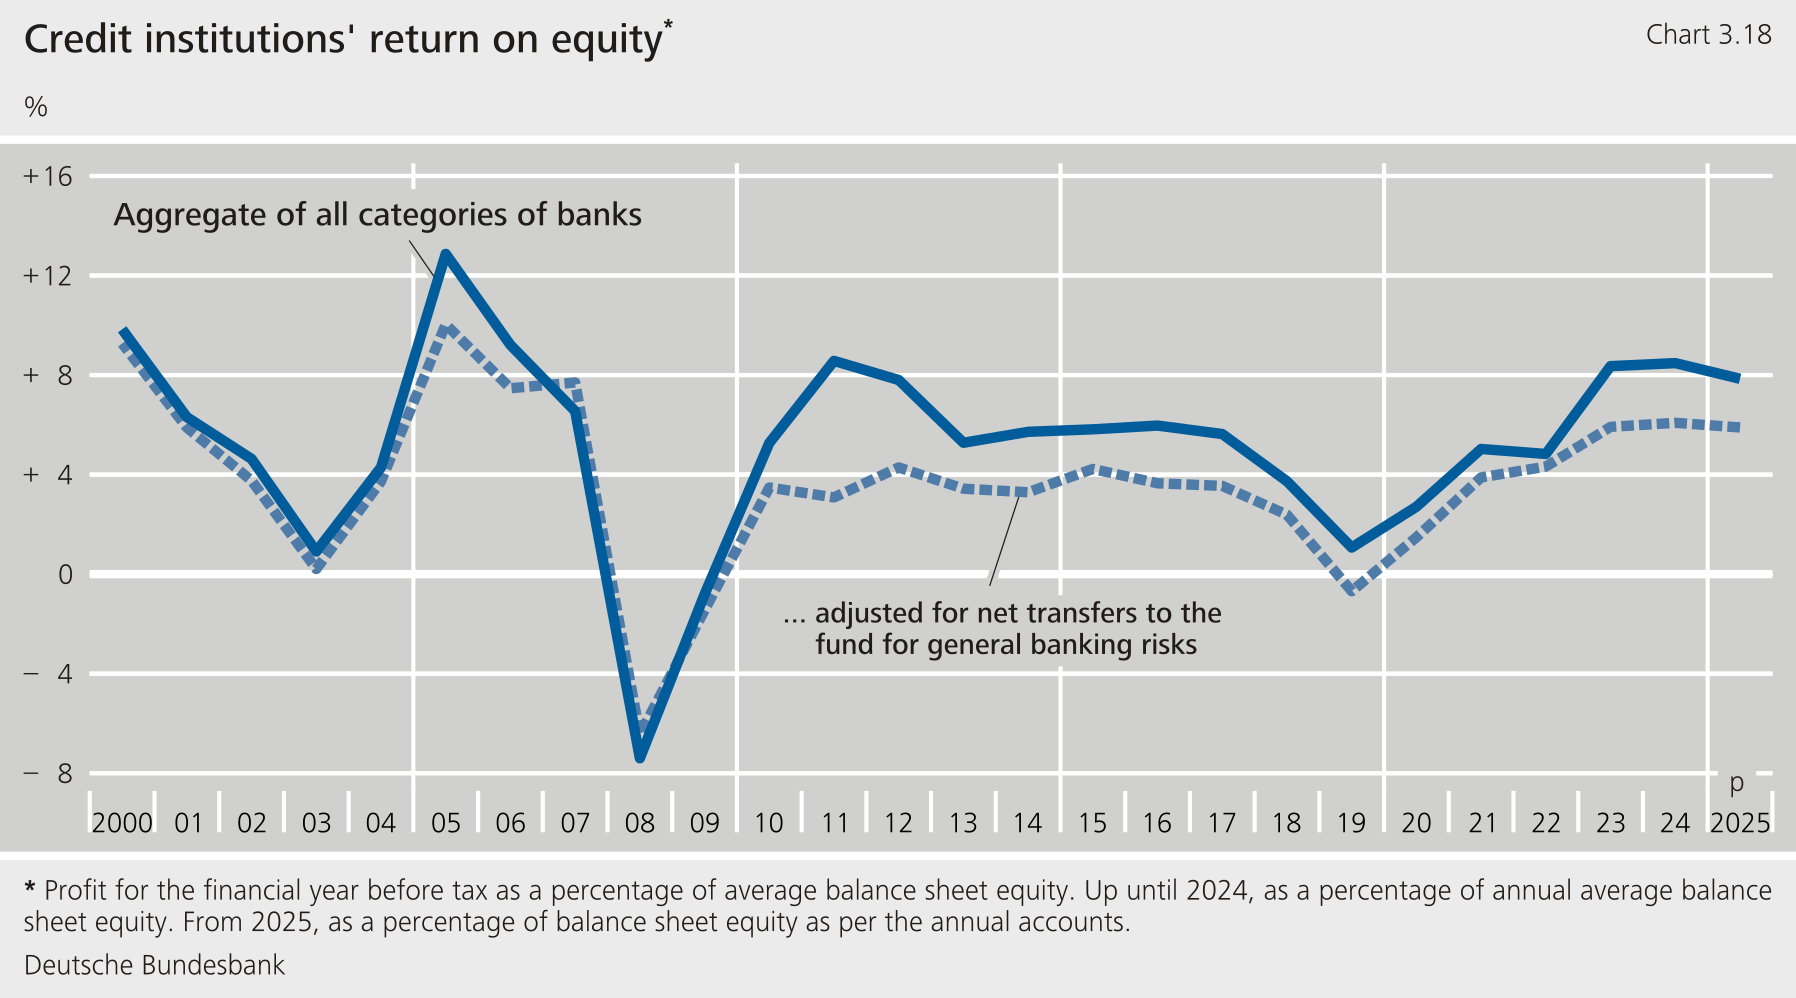
****The return on equity** [\[46\]](#_ftn_root_46)**stood at 7.85 % in the reporting year and was thus down slightly on the year (previous year: 8.04 %).** Looking solely at the aggregate development of profit for the financial year, the return on equity should have increased slightly. However, the concurrent rise in balance sheet equity more than offset this effect.**{#par-u6eua2}
{#par-o87ii5}
****
**Big banks continued to report the highest return on equity (16.92 %). At 8.55 %, the return on equity was also above average in the case of savings banks. Regional banks and other commercial banks reported a return on equity of 7.37 %. For credit cooperatives, it stood at 7.03 % at the end of 2025.**{#par-o23e51}
{#par-a65217}
| **Table 3.4: Return on equity of individual categories of banks^1^** % |||||||||||
| Category of banks | 2021 || 2022 || 2023 || 2024 || 2025^p^ ||
| All categories of banks | 5.03 | (3.22) | 4.83 | (3.86) | 8.36 | (6.18) | 8.48 | (6.19) | 7.85 | (5.56) |
| Commercial banks | 2.65 | (1.41) | 6.05 | (5.97) | 9.16 | (7.02) | 9.99 | (7.17) | 10.75 | (7.52) |
| of which: | ||||||||||
| Big banks | -- 2.26 | (-- 2.13) | 9.12 | (12.29) | 12.12 | (11.91) | 11.81 | (9.26) | 16.92 | (13.01) |
| Regional banks and other commercial banks | 6.00 | (3.81) | 4.27 | (2.25) | 7.49 | (4.15) | 9.04 | (6.00) | 7.37 | (4.45) |
| Landesbanken | 4.02 | (2.26) | 4.77 | (2.72) | 7.45 | (5.01) | 8.84 | (7.31) | 5.65 | (4.45) |
| Savings banks | 6.27 | (4.22) | 4.74 | (2.82) | 10.17 | (7.09) | 10.31 | (7.23) | 8.55 | (5.96) |
| Credit cooperatives | 8.37 | (6.19) | 4.59 | (3.46) | 8.92 | (6.47) | 8.23 | (5.82) | 7.03 | (4.78) |
| Mortgage banks | 16.91 | (5.73) | 5.99 | (3.76) | 8.89 | (5.69) | 7.95 | (4.47) | 2.32 | (-- 0.83) |
| Building and loan associations | 1.41 | (0.50) | 2.79 | (1.65) | 4.14 | (1.99) | 3.60 | (3.17) | 3.21 | (2.08) |
|-------------------------------------------|---------|-----------|------|---------|-------|---------|-------|--------|-------|-----------|
{#par-aa5a42}
#### **2.2.2 Cost efficiency** {#tar-14}
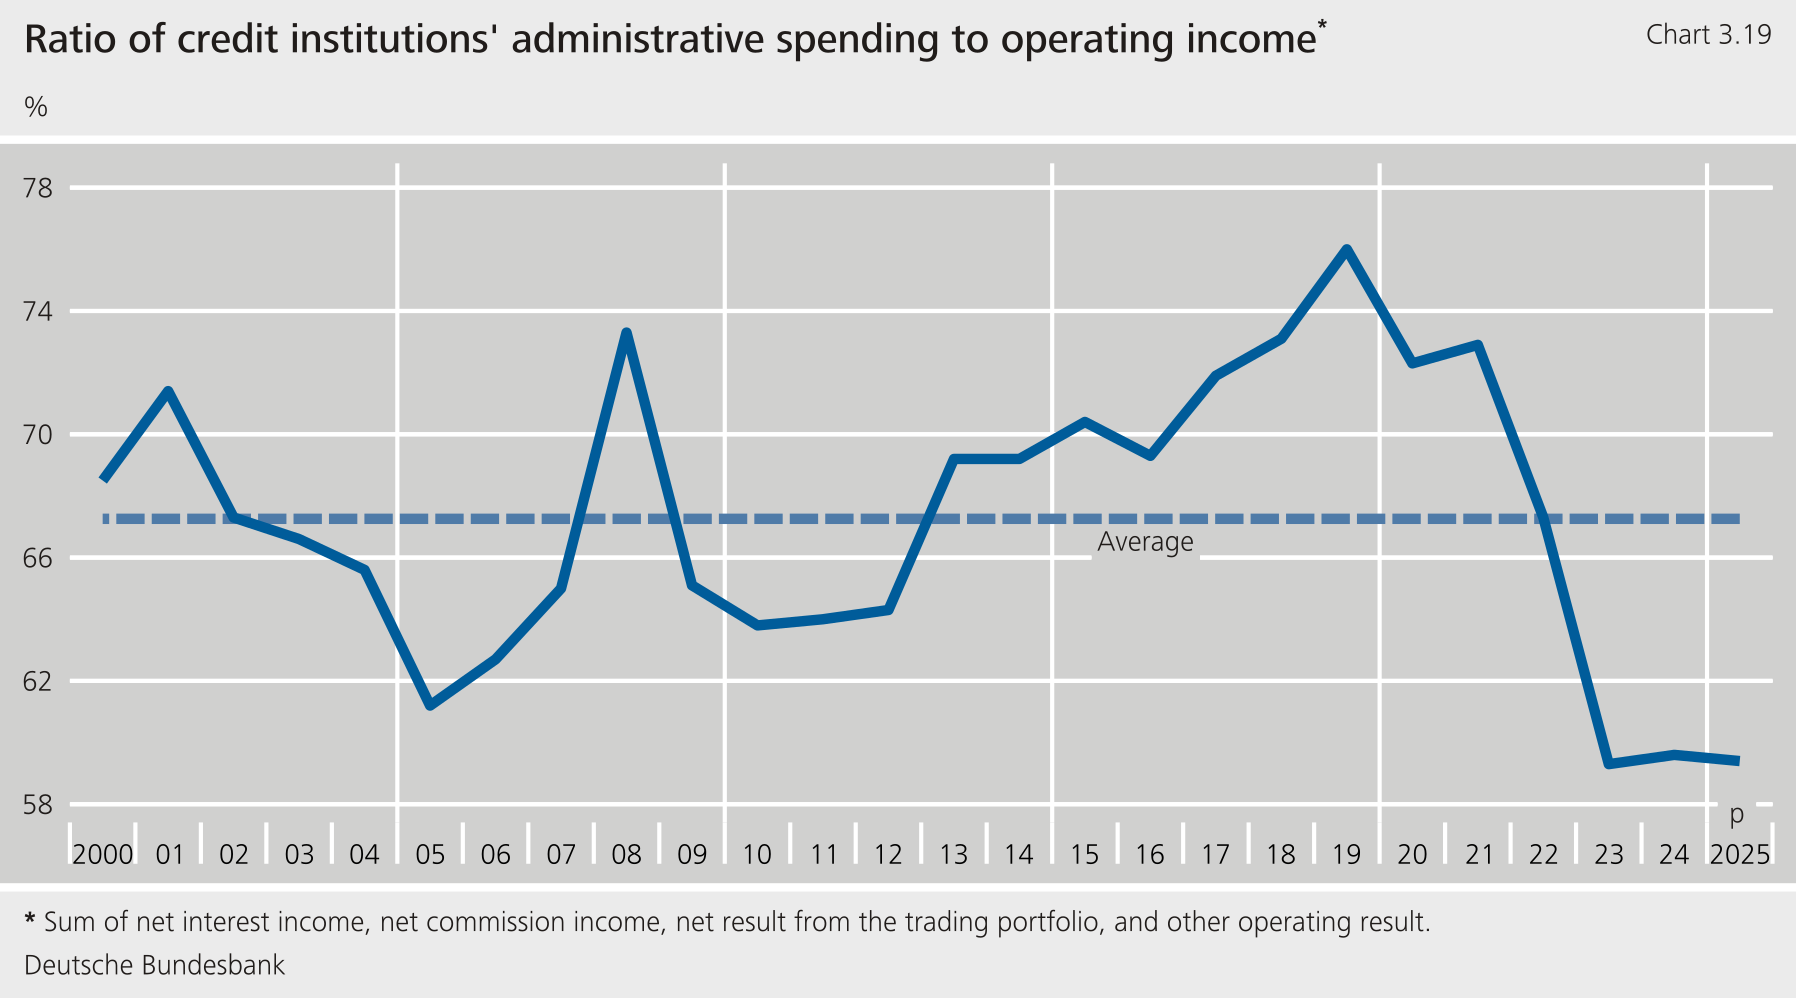
****At 59.4 % in the reporting year, the cost/income ratio in its broad definition** [\[47\]](#_ftn_root_47)**was roughly at the level of the previous year.**Banks have continuously improved their cost efficiency since 2019 and have since lowered their cost/income ratio by 17 percentage points.**{#par-u79188}
{#par-ai3888}
****
**Despite the significant increase in big banks' operating income, their cost/income ratio was still the least favourable, with high administrative spending remaining almost unchanged overall. However, it was lowered by 6.7 percentage points on the year to 64.8 %.**{#par-i1a45e}
**Credit cooperatives, too, continued to report a slightly above-average cost/income ratio of 60.4 % overall. It has not been reduced over the past three years and was virtually unchanged on the year.**{#par-ao463i}
**For savings banks, the cost/income ratio deteriorated on the year to 57.8 % (+ 1 percentage point), and for Landesbanken by as much as 4.5 percentage points to 58.6 %.**{#par-o1e356}
**Against the backdrop of the significant increase in administrative spending, regional banks and other commercial banks likewise recorded a deterioration in their cost/income ratio (+ 1.3 percentage points to 55.6 %). It remained low in a comparison across all categories of banks, however.**{#par-eoe3uo}
**Overall, the cost/income ratios for all these categories of banks remained well below their respective long-term averages.**{#par-u3e84i}
| **Table 3.5: Cost/income ratios by category of banks** % ||||
| Category of banks | General administrative spending in relation to operating income^1^ |||
| Category of banks | 2023 | 2024 | 2025^p^ |
| All categories of banks | 59.3 | 59.6 | 59.4 |
| Commercial banks | 61.1 | 62.4 | 60.0 |
| Big banks | 69.0 | 71.5 | 64.8 |
| Regional banks and other commercial banks | 53.0 | 54.3 | 55.6 |
| Branches of foreign banks | 38.2 | 37.4 | 41.7 |
| Landesbanken | 58.4 | 54.1 | 58.6 |
| Savings banks | 56.2 | 56.8 | 57.8 |
| Credit cooperatives | 60.4 | 60.5 | 60.4 |
| Mortgage banks | 42.0 | 41.4 | 45.6 |
| Building and loan associations | 70.5 | 70.4 | 67.2 |
| Banks with special, development and other central support tasks | 56.7 | 56.8 | 59.2 |
|-----------------------------------------------------------------|------|------|---------|
{#par-e819o2}
**3 Outlook** {#tar-15}
-----------------------
****Although banks have been making record profits for three years, the underlying conditions require our full attention. For instance, the macroeconomic environment for German credit institutions in 2026 is fraught with numerous risks and remains challenging.** Trade and geopolitical uncertainties remain high and structural weaknesses regarding the competitiveness of the German economy persist. Although German banks have a comfortable capital base with surplus capital totalling €180 billion, the ongoing weakness in the real economy could have a dampening effect on the performance of German credit institutions this year via rising credit risk and subdued lending activity. However, credit risk is likely to continue to materialise in an orderly manner, provided that the German economy does not enter an unexpectedly strong downturn.[\[48\]](#_ftn_root_48)**{#par-e25885}
****Credit institutions' general administrative costs are likely to increase further.** Increased cyber risk combined with advances in artificial intelligence require extensive investment in cyber and security.This is also relevant with regard to the outsourcing of information and communication technologies to critical third-party service providers.[\[49\]](#_ftn_root_49) In addition, ongoing investment in digitalisation remains highly relevant in view of increased customer requirements, the need for efficiency gains and growing competition with fintech firms.**{#par-eoio64}
****Furthermore, rising competitive pressure in the German banking sector could worsen the performance of German credit institutions in the medium to long term.**Foreign banks and neobanks are entering the German retail market with large growth ambitions. These and already established direct banks are increasingly competing with traditional banks for customer deposits, which remain a favourable source of financing. This is likely to further increase the pressure to adapt existing business and price models.**{#par-a3i2a9}
**Further information can be found in the table appendix.**{#par-a858u9}
**[Performance -- table appendix](https://publikationen.bundesbank.de/content/1008264)**{#par-io1478}
**List of references** {#tar-16}
--------------------------------
**Deutsche Bundesbank (2026a), [January results of the Bank Lending Survey in Germany](https://www.bundesbank.de/content/936652), press release of 3 February 2026.**{#par-ua3947}
**Deutsche Bundesbank (2026b), [Annual Report 2025](https://publikationen.bundesbank.de/content/974388), March 2026.**{#par-aeu349}
**Deutsche Bundesbank (2026c), [Forecast for Germany: Energy price shock fuels inflation and slows the economic recovery](https://publikationen.bundesbank.de/content/999218), Monthly Report, June 2026.**{#par-u73428}
**Deutsche Bundesbank (2026d), [Monthly Report -- February 2026](https://publikationen.bundesbank.de/content/988816), February 2026.**{#par-ua6912}
**Deutsche Bundesbank (2025a), [October results of the Bank Lending Survey (BLS) in Germany](https://www.bundesbank.de/content/969438), press release of 28 October 2025.**{#par-uuu44e}
**Deutsche Bundesbank (2025b), [July results of the Bank Lending Survey in Germany](https://www.bundesbank.de/content/961486), press release of 22 July 2025.**{#par-eaiu3a}
**Deutsche Bundesbank (2025c), [April results of the Bank Lending Survey (BLS) in Germany](https://www.bundesbank.de/content/945438), press release of 15 April 2025.**{#par-iio782}
**Deutsche Bundesbank (2025d), [Monthly Report -- May 2025](https://publikationen.bundesbank.de/content/957960), May 2025.**{#par-o53e27}
**Deutsche Bundesbank (2025e), [Monthly Report -- August 2025](https://publikationen.bundesbank.de/content/962902), August 2025.**{#par-i145u9}
**Deutsche Bundesbank (2025f), [Monthly Report -- November 2025](https://publikationen.bundesbank.de/content/970814), November 2025.**{#par-a62u87}
**Deutsche Bundesbank (2025g), [Monthly Report -- September 2025](https://publikationen.bundesbank.de/content/965138), September 2025.**{#par-eu3i85}
**Deutsche Bundesbank (2024a), [Financing costs for banks in Germany in the monetary policy interest rate cycle](https://publikationen.bundesbank.de/content/947286), Monthly Report, December 2024.**{#par-uo8ou4}
**Deutsche Bundesbank (2024b), [Monthly Report -- September 2024](https://publikationen.bundesbank.de/content/939206), September 2024.**{#par-a452uu}
**Deutsche Bundesbank (2023a), [Monthly Report -- June 2023](https://www.bundesbank.de/content/724440), June 2023.**{#par-o6o253}
**Deutsche Bundesbank (2023b), [Negative interest rate policy led to negative interest rates on corporate deposits and higher fees](https://www.bundesbank.de/content/665708), Research Brief, 56th edition, March 2023.**{#par-ieu43u}
**Deutsche Bundesbank (2020), [Monthly report - August 2020](https://www.bundesbank.de/content/841054), August 2020.**{#par-o541u8}
**Deutsche Bundesbank (2017), [Monthly Report - April 2017](https://www.bundesbank.de/content/667334), Monthly Report, April 2017.**{#par-e25aoi}
**Federal Statistical Office (2025), [Press release No 035 of 30 January 2026](https://www.destatis.de/EN/Press/2026/01/PE26_035_811.html).**{#par-u9e31e}
**Financial Stability Committee (2026), [Thirteenth report to the Bundestag on financial stability in Germany](https://www.afs-bund.de/afs/Content/EN/Downloads/Financial-Stability-Committe-Reports/13th-report-fsc.pdf?__blob=publicationFile&v=8), July 2026.**{#par-uau868}
1. **{#_ftn_root_1} See Deutsche Bundesbank (2025a, 2025b, 2025c, 2026a).**
2. **{#_ftn_root_2} See Federal Statistical Office (2025) and Deutsche Bundesbank (2026b), p. 16.**
3. **{#_ftn_root_3} See Deutsche Bundesbank (2026b), p. 15 and p. 17, Financial Stability Committee (2026), p. 1 and p. 5, and Deutsche Bundesbank (2026c), p. 13.**
4. **{#_ftn_root_4} See Deutsche Bundesbank (2026b), p. 17, and Deutsche Bundesbank (2026c), p. 13.**
5. **{#_ftn_root_5} See Deutsche Bundesbank (2026b), p. 15, and Financial Stability Committee (2026), p. 1 and p. 5.**
6. **{#_ftn_root_6} See Deutsche Bundesbank (2026b), p. 17.**
7. **{#_ftn_root_7} See Deutsche Bundesbank (2026b), p. 19.**
8. **{#_ftn_root_8} See Deutsche Bundesbank (2026b), p. 20.**
9. **{#_ftn_root_9} See Deutsche Bundesbank (2025a).**
10. **{#_ftn_root_10} See Financial Stability Committee (2026), p. 7 and Deutsche Bundesbank (2026b), p. 35.**
11. **{#_ftn_root_11} See Deutsche Bundesbank (2025d), p. 8 and p. 9, and Deutsche Bundesbank (2025e), p. 100.**
12. **{#_ftn_root_12} See Deutsche Bundesbank (2026d), p. 95, and Financial Stability Committee (2026), p. 7.**
13. **{#_ftn_root_13} See Deutsche Bundesbank (2026d), p. 96.**
14. **{#_ftn_root_14} See Financial Stability Committee (2026), p. 7.**
15. **{#_ftn_root_15} The total number of credit institutions fell by 39 to 1,266 in 2025, and the number of domestic branches declined by 1,068 to a total of 16,789.**
16. **{#_ftn_root_16} See Financial Stability Committee (2026), p. 10.**
17. **{#_ftn_root_17} At 2.4 %, however, growth in loans to households for house purchase remained well below the levels of up to 7.0 % observed during the period of low interest rates.**
18. **{#_ftn_root_18} See Deutsche Bundesbank (2025d), p. 11, Deutsche Bundesbank (2025e), p. 12, Deutsche Bundesbank (2025f), p. 13, Deutsche Bundesbank (2026d), p. 11.**
19. **{#_ftn_root_19} See Deutsche Bundesbank (2025d), p. 74, Deutsche Bundesbank (2025e), p. 68, Deutsche Bundesbank (2025f), p. 56, Deutsche Bundesbank (2026d), p. 69.**
20. **{#_ftn_root_20} See Deutsche Bundesbank (2025e), p. 75, Deutsche Bundesbank (2025f), p. 57, and Deutsche Bundesbank (2026d), p. 69.**
21. **{#_ftn_root_21} See Deutsche Bundesbank (2026d), p. 70.**
22. **{#_ftn_root_22} See Deutsche Bundesbank (2025f), p. 57.**
23. **{#_ftn_root_23} See Deutsche Bundesbank (2025d), p. 76, and Deutsche Bundesbank (2026d), p. 71.**
24. **{#_ftn_root_24} See Deutsche Bundesbank (2025a, 2025b, 2025c, 2026a).**
25. **{#_ftn_root_25} See Deutsche Bundesbank (2025b, 2026a).**
26. **{#_ftn_root_26} See Financial Stability Committee (2026), p. 2, p. 14 and p. 20.**
27. **{#_ftn_root_27} See Deutsche Bundesbank (2025d), p. 71, Deutsche Bundesbank (2025e), p. 65, Deutsche Bundesbank (2025f), p. 53, and Deutsche Bundesbank (2026d), p. 62.**
28. **{#_ftn_root_28} Big banks, regional and other commercial banks, branches of foreign banks, Landesbanken, savings banks, credit cooperatives as well as banks with special, development and other central support tasks.**
29. **{#_ftn_root_29} Operating income less administrative spending and net valuation charges plus the balance in the other and extraordinary account. Hereinafter, "profit for the financial year" refers to profit for the financial year before tax.**
30. **{#_ftn_root_30} Banks with special, development and other central support tasks recorded a slight increase in their profit for the financial year, though this was not significant overall.**
31. **{#_ftn_root_31} 164 out of a total of 341 savings banks under review and 352 out of a total of 643 credit cooperatives reported a higher profit for the financial year.**
32. **{#_ftn_root_32} Sum of net interest income, net commission income, net result from the trading portfolio and other operating result.**
33. **{#_ftn_root_33} Interest income in the stricter sense of the term -- that is to say, interest income from lending and money market transactions as well as fixed income securities and debt register claims -- plus current income from shares and other variable-yield securities, participating interests and shares in affiliated enterprises as well as income from profit pooling, profit transfer agreements and partial profit transfer agreements, less interest expenses.**
34. **{#_ftn_root_34} See Deutsche Bundesbank (2026b), pp. 90 ff.**
35. **{#_ftn_root_35} Net interest income in relation to total assets. As a result of the structural break in the reporting year (see the supplementary information entitled ["Methodological notes on the profit and loss analysis](#par-ao8777)"), an assessment is now carried out based on total assets as per the annual accounts, which differs from previous practice. Year-on-year comparisons in the text all follow the new definition to aid comparability. In this respect, the aforementioned annual figures deviate from the values shown in the set of tables. The figures up to and including 2024 are shown based on the average total assets for the year.**
36. **{#_ftn_root_36} Landesbanken also recorded a relatively significant increase (+ 10.1 %), but starting from a very low level as a whole; they therefore played less of a role in overall developments.**
37. **{#_ftn_root_37} Net commission income in relation to total assets. As a result of the structural break in the reporting year (see the supplementary information entitled "[Methodological notes on the profit and loss analysis](#par-ao8777)"), an assessment is now carried out based on total assets as per the annual accounts, which differs from previous practice. Year-on-year comparisons in the text all follow the new definition to aid comparability. In this respect, the aforementioned annual figures deviate from the values shown in the set of tables. The figures up to and including 2024 are shown based on the average total assets for the year.**
38. **{#_ftn_root_38} Summary item used to record income and charges from operating business that have no connection to net interest income, net commission income or the trading result. It includes leasing expenses and income, the gross result for transactions in goods and subsidiary transactions, depreciation of assets leased, other operating charges and income, and other taxes as well as withdrawals from and transfers to the fund required by the building and loan association rules (only for building and loan associations).**
39. **{#_ftn_root_39} Net valuation charges comprise the effects of value readjustments and depreciation of accounts receivable and securities in the liquidity reserve. In addition, income and charges in connection with transfers from and to loan-loss provisions are taken into account, as are transfers and releases relating to undisclosed reserves pursuant to Section 340f of the German Commercial Code (*Handelsgesetzbuch*). However, due to the cross-offsetting option permissible under the Commercial Code, the annual accounts do not show the extent to which undisclosed reserves have been formed or released.**
40. **{#_ftn_root_40} See Deutsche Bundesbank (2024b), pp. 75 ff.**
41. **{#_ftn_root_41} General administrative spending encompasses staff costs and other administrative spending. Other administrative spending includes, for example, investment in product development, information technology, and digitalisation. In addition, other administrative spending also comprises depreciation of and value adjustments to tangible and intangible assets.**
42. **{#_ftn_root_42} At €0.9 billion (+ 9.6 %), however, the increase in staff costs was somewhat more pronounced than the likewise considerable increase in other administrative spending of €0.7 billion (+ 6.3 %).**
43. **{#_ftn_root_43} Staff costs for credit cooperatives rose by €0.5 billion (+ 5.2 %), whilst other administrative spending increased by €0.3 billion (+ 4.1 %). Staff costs for savings banks rose by €0.7 billion (+ 4.8 %), whilst other administrative spending increased by €0.3 billion (+ 3.3 %).**
44. **{#_ftn_root_44} The other and extraordinary account includes depreciation of and value adjustments to participating interests, shares in affiliated enterprises and securities treated as fixed assets, income from value readjustments to participating interests, shares in affiliated enterprises and securities treated as fixed assets, charges and income from loss transfers, extraordinary charges and income as well as profits transferred under profit pooling, a profit transfer agreement or a partial profit transfer agreement.**
45. **{#_ftn_root_45} Ratio of profit for the financial year before tax to total assets. As a result of the structural break in the reporting year (see the supplementary information entitled "[Methodological notes on the profit and loss analysis](#par-ao8777)"), an assessment is now carried out based on total assets as per the annual accounts, which differs from previous practice. Year-on-year comparisons in the text all follow the new definition to aid comparability.**
46. **{#_ftn_root_46} Ratio of profit for the financial year before tax to balance sheet equity, adjusted for the net transfer to the fund for general banking risks. As a result of the structural break in the reporting year (see the supplementary information entitled "[Methodological notes on the profit and loss analysis](#par-ao8777)"), an assessment is now carried out based on equity as per the annual accounts, which differs from previous practice. Year-on-year comparisons in the text all follow the new definition to aid comparability. In this respect, the aforementioned annual figures deviate from the values shown in the set of tables. The figures up to and including 2024 are shown based on average equity for the year.**
47. **{#_ftn_root_47} General administrative spending in relation to operating income.**
48. **{#_ftn_root_48} See Financial Stability Committee (2026), p. 20.**
49. **{#_ftn_root_49} See Financial Stability Committee (2026), p. 3 and p. 33.**
*[**CRR**]: Capital Requirements Regulation
*[ECB]: European Central Bank
*[BLS]: Bank Lending Survey
*[AI]: artificial intelligence
*[IT]: information technology
*[**EU**]: European Union
*[HICP]: Harmonised Index of Consumer Prices
*[COVID]: coronavirus disease
*[MFI]: monetary financial institution
*[GDP]: gross domestic product
*[**ECB**]: European Central Bank
*[**MFIs**]: monetary financial institutions
*[US]: United States