# German balance of payments in 2023
* [*1 Current account*](#tar-1 "1 Current account")
* *[*The role of regional trade agreements in international trade flows*](#tar-2 "The role of regional trade agreements in international trade flows")*
* **[*Current account balances: determinants over time and between countries*](#tar-3 "Current account balances: determinants over time and between countries")**
* ***[*2 Capital movements*](#tar-4 "2 Capital movements")***
* ***[*3 List of references*](#tar-5 "3 List of references")***
****In 2023, the German current account surplus increased by 1¾ percentage points to just shy of 6 % of nominal gross domestic product (). The main reason for the increase following the substantial decline in 2022 was that the goods balance recovered significantly as prices for imported commodities (especially natural gas and other energy imports) fell. On the other hand, the deficit in the German services account widened. This is likely to have been driven in part by catch-up effects relating to cross-border travel. The tightening of monetary policy in Germany and abroad was reflected in higher investment income to a roughly equal extent on the asset and liability sides. The balance of primary and secondary income remained more or less unchanged. Aggregate net lending/net borrowing rose relative to in the reporting year. First, on the investment side, non-financial corporations' inventories, which had been increased in the previous year for price and crisis-related reasons, returned to normal levels. Second, domestic saving increased again from the subdued level of the previous year as firms distributed fewer profits.****{#par-e1e496}
****Reflecting the higher current account balance, German net capital exports likewise went back up in 2023. In an environment of rising financing costs and geopolitical tensions, there was robust cross-border demand for interest-bearing securities and, until and into autumn, a pronounced reluctance to invest in shares and mutual fund shares that typically involve higher risks. The restraint also affected German foreign direct investment (). Both German outward and inward were distinctly lower than in the previous year. In other investment, Germany's claims fell significantly as a result of the Eurosystem's tighter monetary policy. For example, the more restrictive monetary policy also meant that reinvestments under the asset purchase programme () were discontinued as of July 2023. In previous years, net purchases under the monetary policy asset purchase programmes had been an important factor in Germany's high claims. Towards the end of the year, inflation fell somewhat more sharply than expected. Market participants accordingly revised the short-term inflation outlook downwards, and the markets deemed it more likely that key interest rates would fall over the course of 2024. This was also reflected in falling longer-term capital market rates. With listed companies continuing to boast a robust earnings situation, demand for their shares resurged globally.****{#par-eii792}
***1 Current account*** {#tar-1}
--------------------------------
### ***1.1 Underlying trends in the current account***
*****The German current account surplus increased significantly in 2023.** It rose by €78½ billion to €243 billion. The balance increased by 1¾ percentage points to just shy of 6 % of nominal . However, the increase only partially offset the decline in the current account balance in the previous year, during which energy prices had risen sharply. At the end of the year, too, the balance was below its peak in the years before the outbreak of the war in Ukraine and of the − 19 pandemic.***{#par-u24494}
{#par-oa8u13}
***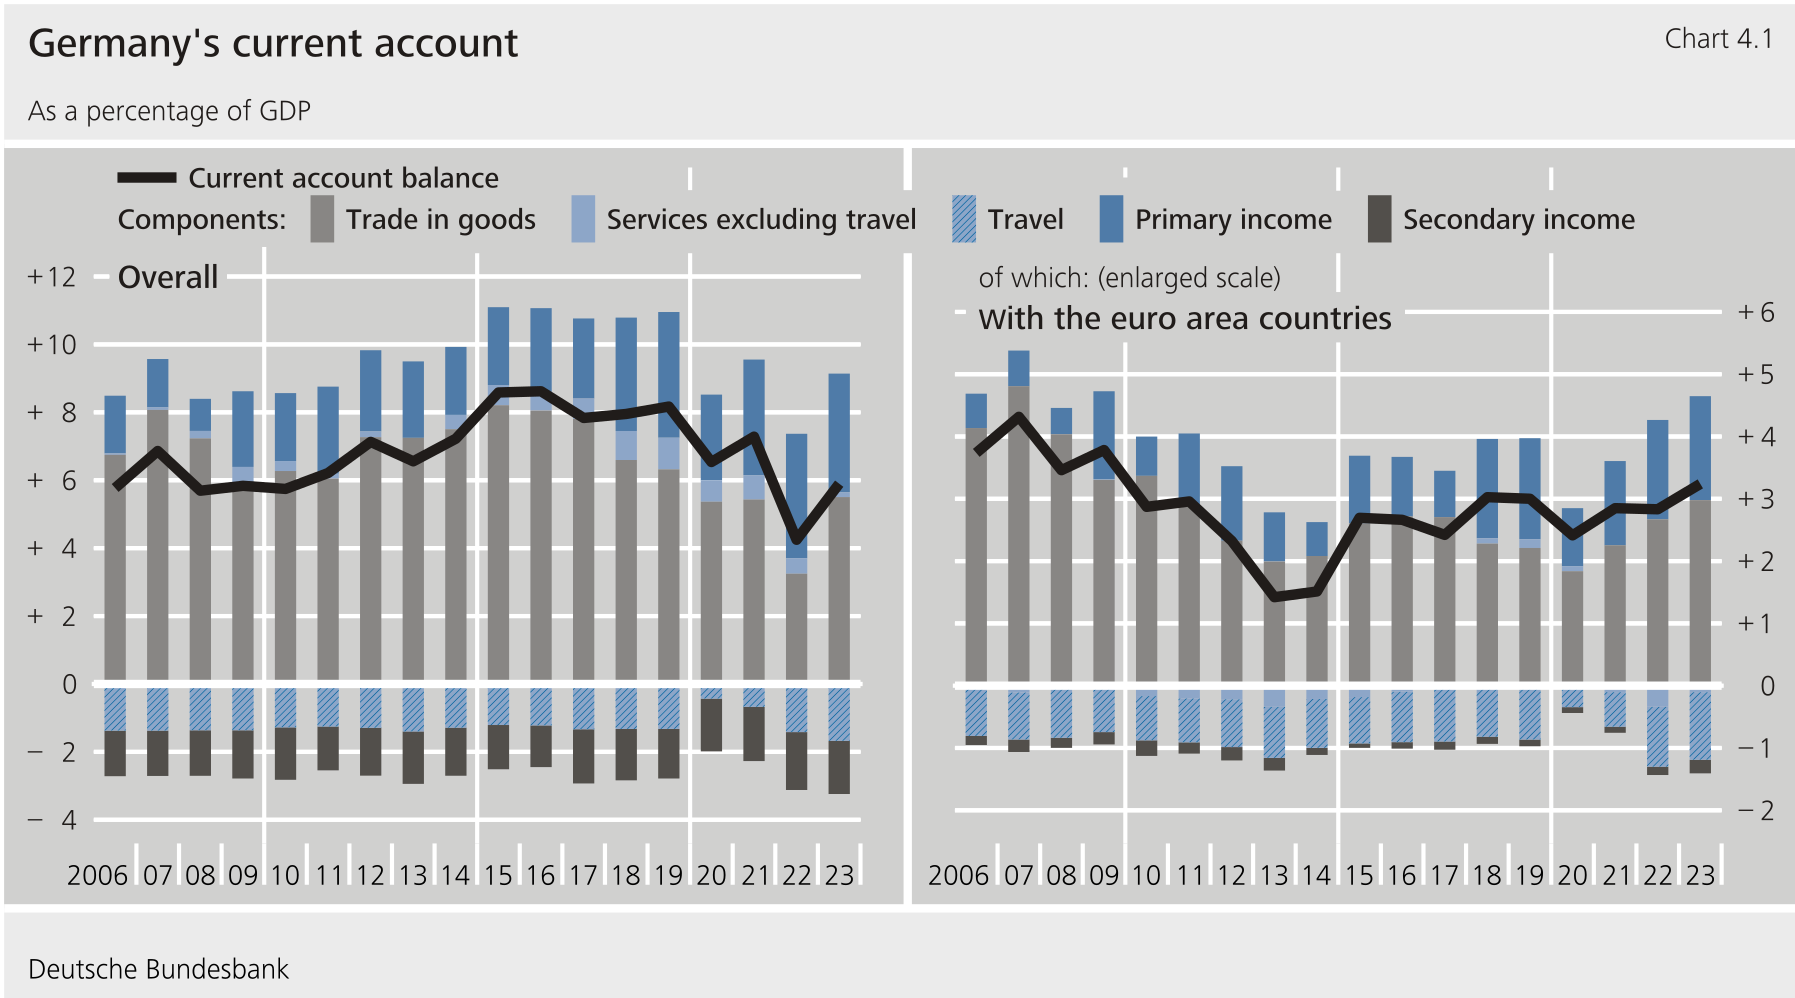***
*****In 2023, a major driver of developments in the German current account was the significant recovery in the goods trade balance.** Prices for imported commodities (especially natural gas and other energy imports) fell, causing the terms of trade to improve. The deficit in the services account, however, widened markedly. The still-pent-up cross-border travel probably played a role here. In addition, special revenue from vaccines was no longer being generated. The monetary policy reversal in Germany and abroad was reflected in higher investment income to a roughly equal extent on the asset and liability sides. The balance of primary and secondary income remained more or less unchanged.***{#par-a76u33}
*****Overall, the global setting was rather subdued in 2023 amidst weaker goods demand.** The global economy continued to recover from the effects of the − 19 pandemic and the Russian war of aggression against Ukraine. The central banks' tighter monetary policy contributed to the declining inflation rates in numerous countries. However, higher financing costs and the expiry and lifting of fiscal support measures constrained demand. According to estimates by the International Monetary Fund, global trade in goods and services increased only marginally in 2023 compared with the previous year. The euro appreciated significantly, and German price competitiveness declined accordingly. Global commodity prices, especially those for natural gas and other energy imports, fell in 2023 after having risen the previous year in the wake of the Ukraine war. On average, however, they remained well above the long-run average.***{#par-uoui63}
{#par-u2e5i9}
***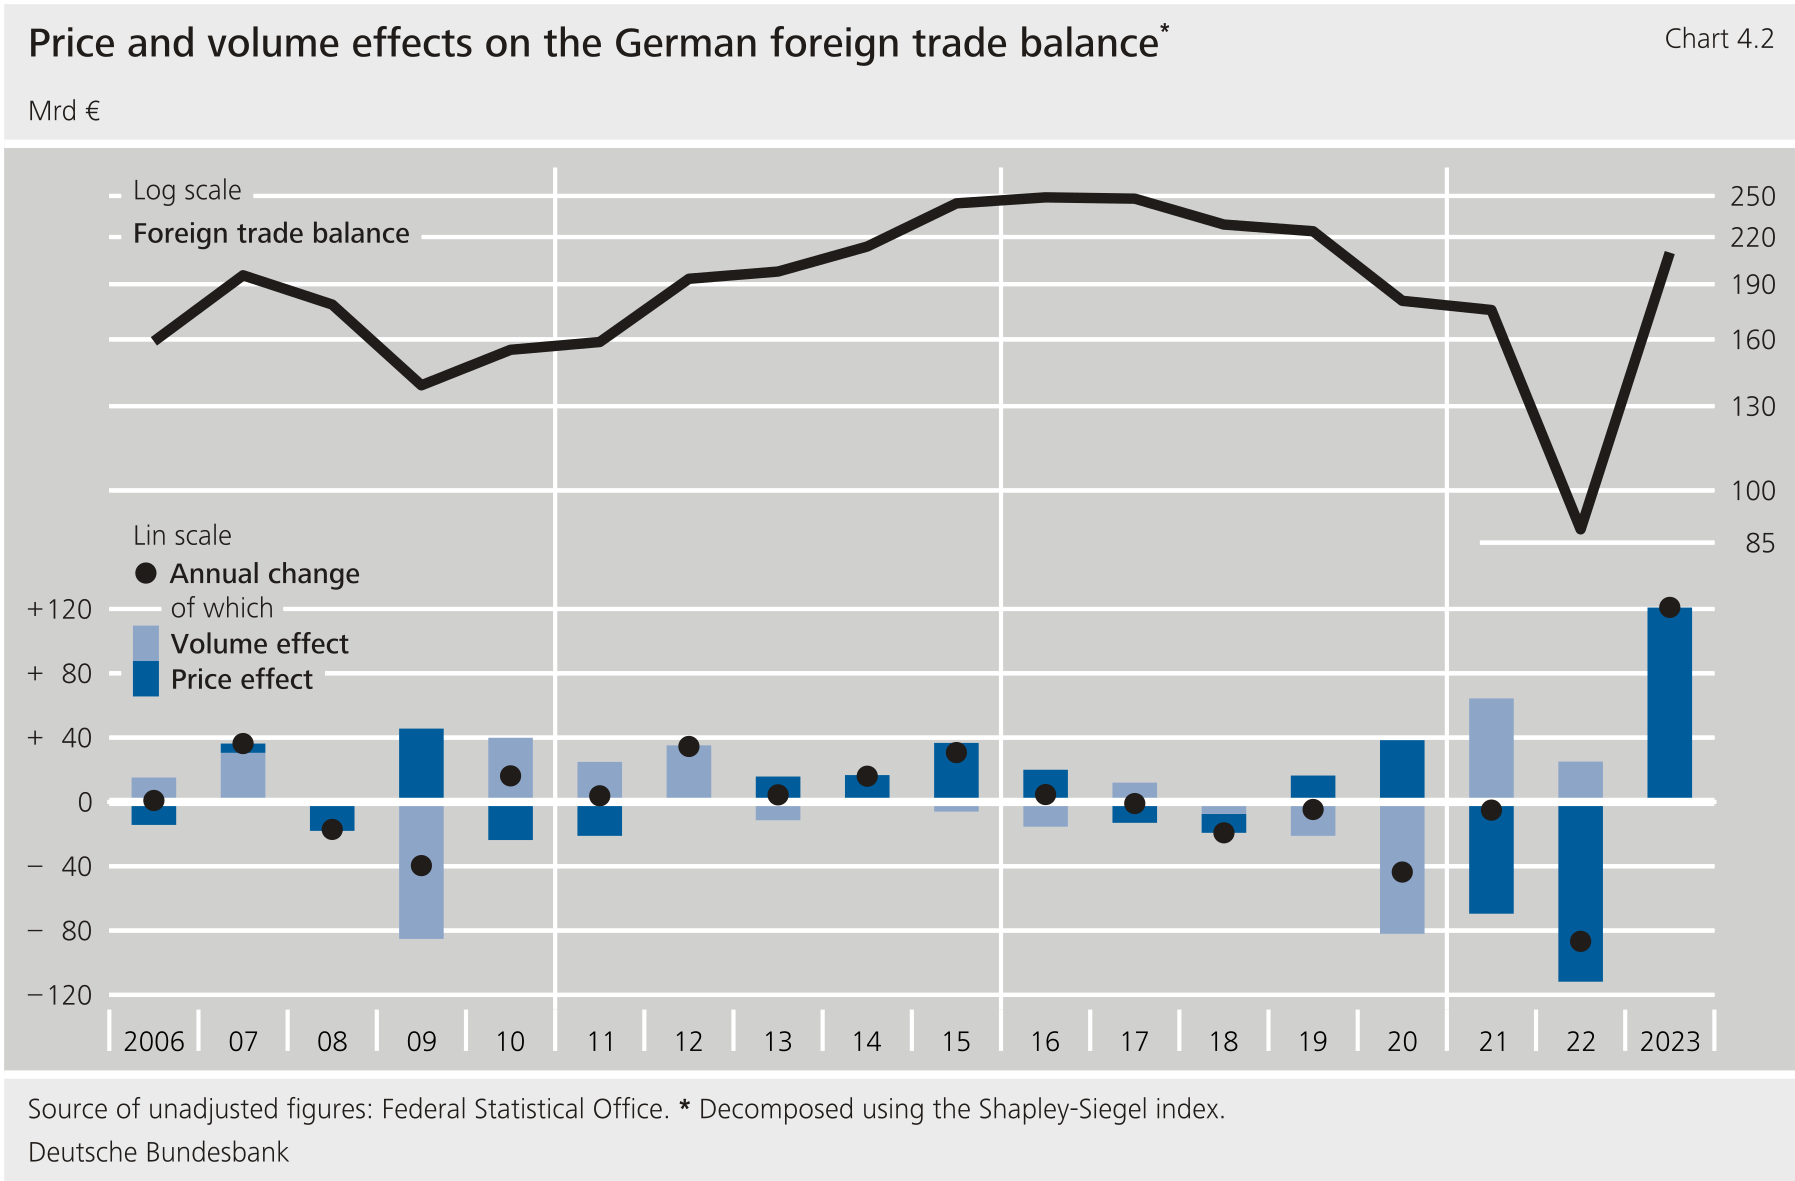***
*****Germany's foreign trade surplus rose considerably in 2023.** This was mainly because, as mentioned above, import prices fell whilst export prices remained largely unchanged. The German terms of trade improved by just under 9 % on the year. In terms of volume, however, the balance barely changed, as imports and exports alike declined markedly.***{#par-oa5a2e}
*****In regional terms, the current account surplus rose particularly vis-à-vis non-euro area countries, where it picked up by 1¼ percentage points to 2¾% of** **.** In particular, the surplus in the goods account was higher, while the larger deficit in the services account dampened the increase. On the other hand, the German current account surplus vis-à-vis the rest of the euro area rose by only ¼ percentage point to 3¼% of . In this case, too, the goods surplus increased, in particular.***{#par-ea9412}
{#par-u5419o}
***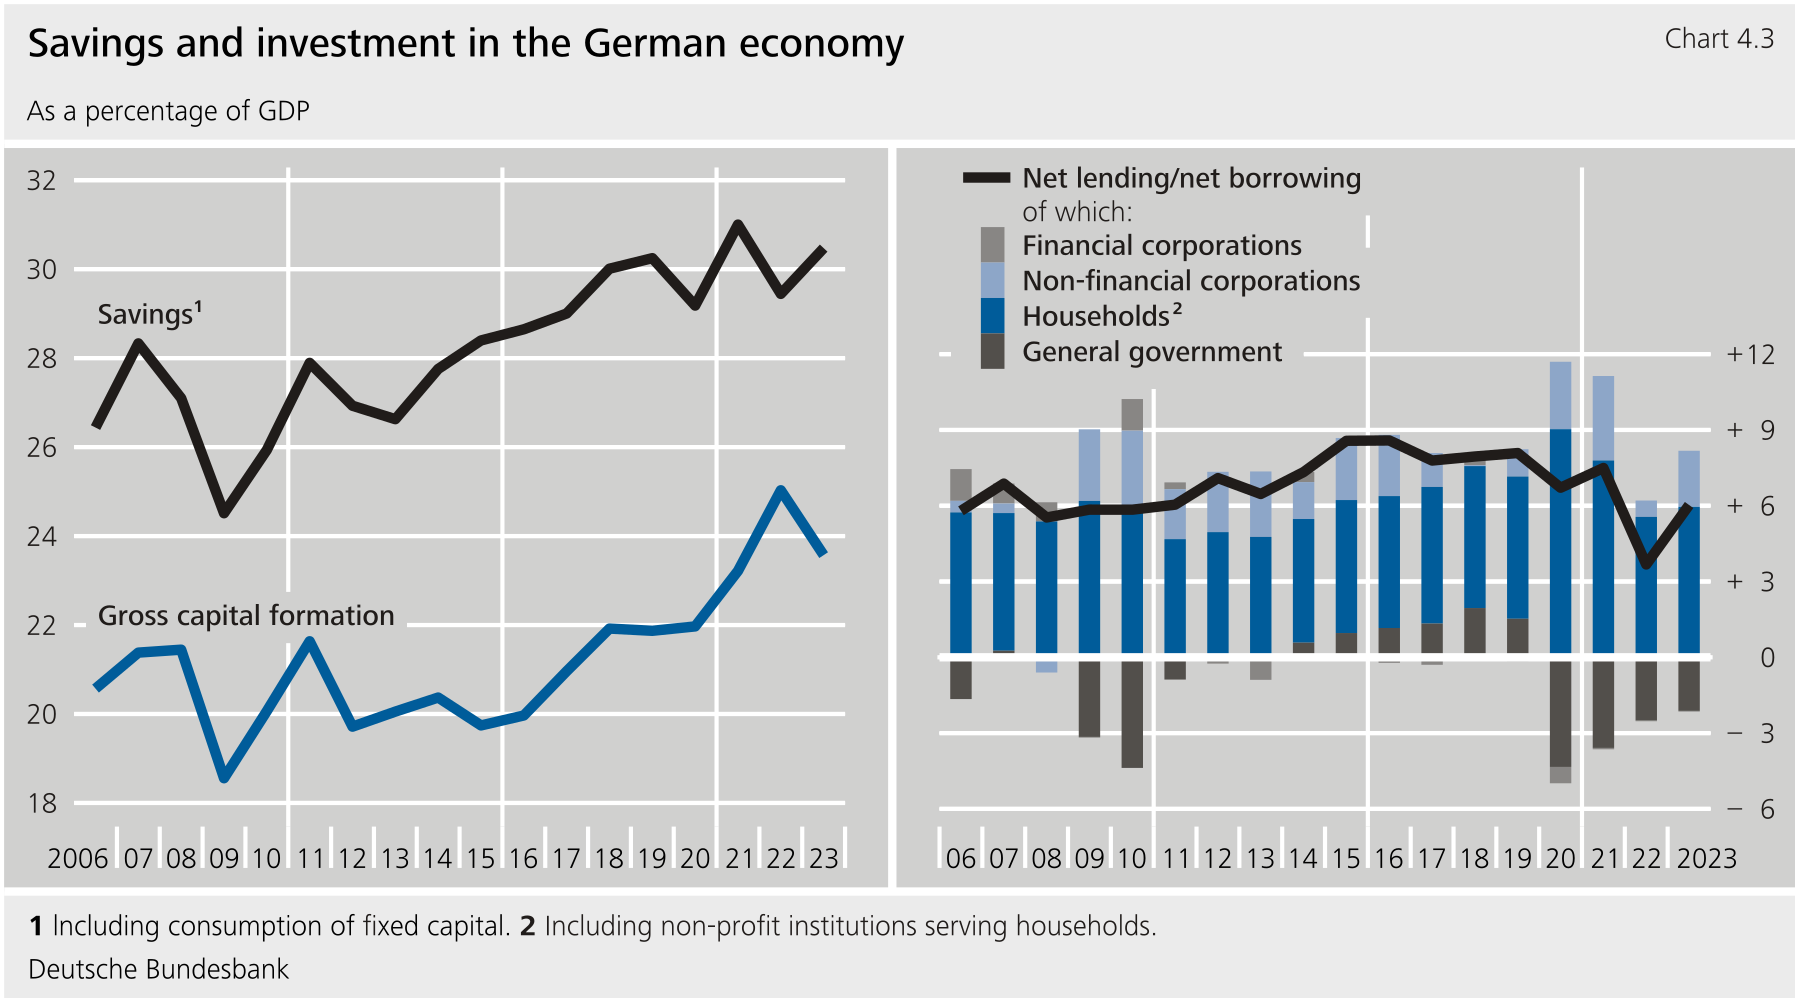***
*****In the year under review, aggregate net lending/net borrowing (i.e. the balance of saving and investment) relative to** **increased considerably, particularly on account of developments concerning non-financial corporations.** This was driven chiefly by the decline in gross investment over and, in particular, the fact that inventories, which had increased in the previous year for price and crisis-related reasons, returned to normal levels. However, non-financial corporations' other investment remained unchanged relative to . Housing investment also declined in the year under review. In 2023, domestic saving went back up from its subdued level of the previous year. It was particularly higher corporate saving that contributed to the increase in aggregate net lending/net borrowing. This was due, amongst other things, to smaller profit distributions. As regards capital transfers, the general government deficit fell because government assistance granted in the wake of the − 19 pandemic was phased out. The balance of non-financial corporations' capital transfers contracted. However, this shift did not affect aggregate net lending/net borrowing. Compared with the pre-pandemic period, aggregate net lending/net borrowing relative to was considerably lower in 2023. This is attributable primarily to general government posting a deficit, after having still recorded surpluses in the years before the pandemic.***{#par-i68eau}
### ***1.2 Goods flows and balance of trade***
*****On an annual average, price-adjusted foreign trade was noticeably more subdued than in the previous year.** Goods exports fell by 1¾%, and imports by 2 %, in price-adjusted terms.[\[1\]](#_ftn_root_1) Exports declined somewhat more sharply in terms of value than in real terms. Nominal imports fell much more sharply than in price-adjusted terms, mainly because energy products became far cheaper. On balance, the foreign trade surplus increased by €121 billion to €209½ billion.***{#par-eu78a5}
{#par-e9u916}{#par-i326a2}{#par-a9a725}{#par-e3116a}{#par-ue6464}{#par-oa6121}{#par-a3e798}{#par-uuoe55}{#par-a6849u}{#par-ii47iu}{#par-e7o441}{#par-i3382e}{#par-ee4138}{#par-i683a3}{#par-ei46e3}{#par-oi1o7u}{#par-e766ea}{#par-eo9ea1}{#par-i8u9ie}{#par-aia763}{#par-e1uu22}{#par-i4u56i}{#par-eie6i3}{#par-e79ii6}{#par-o886a7}{#par-o454ie}
| **Table 4.1 Foreign trade by region** % |||||
| Country/group of countries | Percentage share | Annual percentage change |||
| Country/group of countries | 2023 | 2021 | 2022 | 2023 |
| **Exports** | ||||
| Euro area | 38.1 | 18.1 | 17.3 | − 3.5 |
| Other countries | 61.6 | 12.0 | 14.2 | − 1.0 |
| of which: | ||||
| United Kingdom | 5.0 | − 3.1 | 13.5 | 6.2 |
| Central and eastern European countries^1^ | 12.8 | 19.5 | 16.9 | − 3.5 |
| Switzerland | 4.3 | 7.8 | 16.4 | − 5.7 |
| Russia | 0.6 | 15.3 | − 45.4 | − 38.8 |
| United States | 10.1 | 17.9 | 28.1 | 1.1 |
| Japan | 1.3 | 4.9 | 12.4 | − 1.3 |
| Newly industrialised economies in Asia^2^ | 2.8 | 8.4 | 14.2 | − 5.6 |
| China | 6.2 | 8.1 | 3.1 | − 8.8 |
| South and east Asian emerging market economies^3^ | 2.4 | 15.5 | 14.3 | 5.4 |
| ^4^ | 1.6 | 2.2 | 10.5 | 11.2 |
| All countries | 100.0 | 14.3 | 15.6 | − 2.0 |
| **Imports** | ||||
| Euro area | 35.0 | 18.1 | 15.1 | − 6.6 |
| Other countries | 64.9 % | 16.9 | 30.7 | − 12.0 |
| of which: | ||||
| United Kingdom | 2.7 | − 7.9 | 25.0 | − 8.8 |
| Central and east European countries^1^ | 15.0 | 13.8 | 16.5 | 3.6 |
| Switzerland | 3.8 | 8.1 | 13.1 | − 7.1 |
| Russia | 0.3 | 54.2 | 9.8 | − 90.0 |
| United States | 7.0 | 6.8 | 29.1 | 1.1 |
| Japan | 1.9 | 9.6 | 8.2 | 0.5 |
| Newly industrialised economies in Asia^2^ | 2.7 | 11.6 | 27.8 | − 6.4 |
| China | 11.5 | 21.8 | 34.9 | − 19.2 |
| South and east Asian emerging market economies^3^ | 4.2 | 15.8 | 33.1 | − 7.5 |
| ^4^ | 1.4 | 58.3 | 90.8 | 18.8 |
| All countries | 100.0 | 17.3 | 25.0 | − 10.1 |
|-----------------------------------------------------|-----------------:|------:|-------:|-------:|
{#par-o93371}
****In regional terms, revenue from non-euro area exports and from euro area exports alike fell.** German exporters recorded a marked and, in some cases, sharp decline in revenue from their exports to major sales markets in the euro area, other regions of Europe, and South and East Asia. Exports to China dropped off very sharply, with a decline in motor vehicle deliveries also playing a role. Exports to Russia once again fell quite considerably, not least as a result of sanctions. However, not all exports fell across the board. For example, sales to the United States grew slightly, supported by buoyant economic activity. Deliveries to the United Kingdom rose sharply, including those of motor vehicles. Exports to Ukraine expanded quite considerably. This was mainly due to deliveries of goods in connection with the war.[\[2\]](#_ftn_root_2)**{#par-aoea1i}
{#par-u79765}
**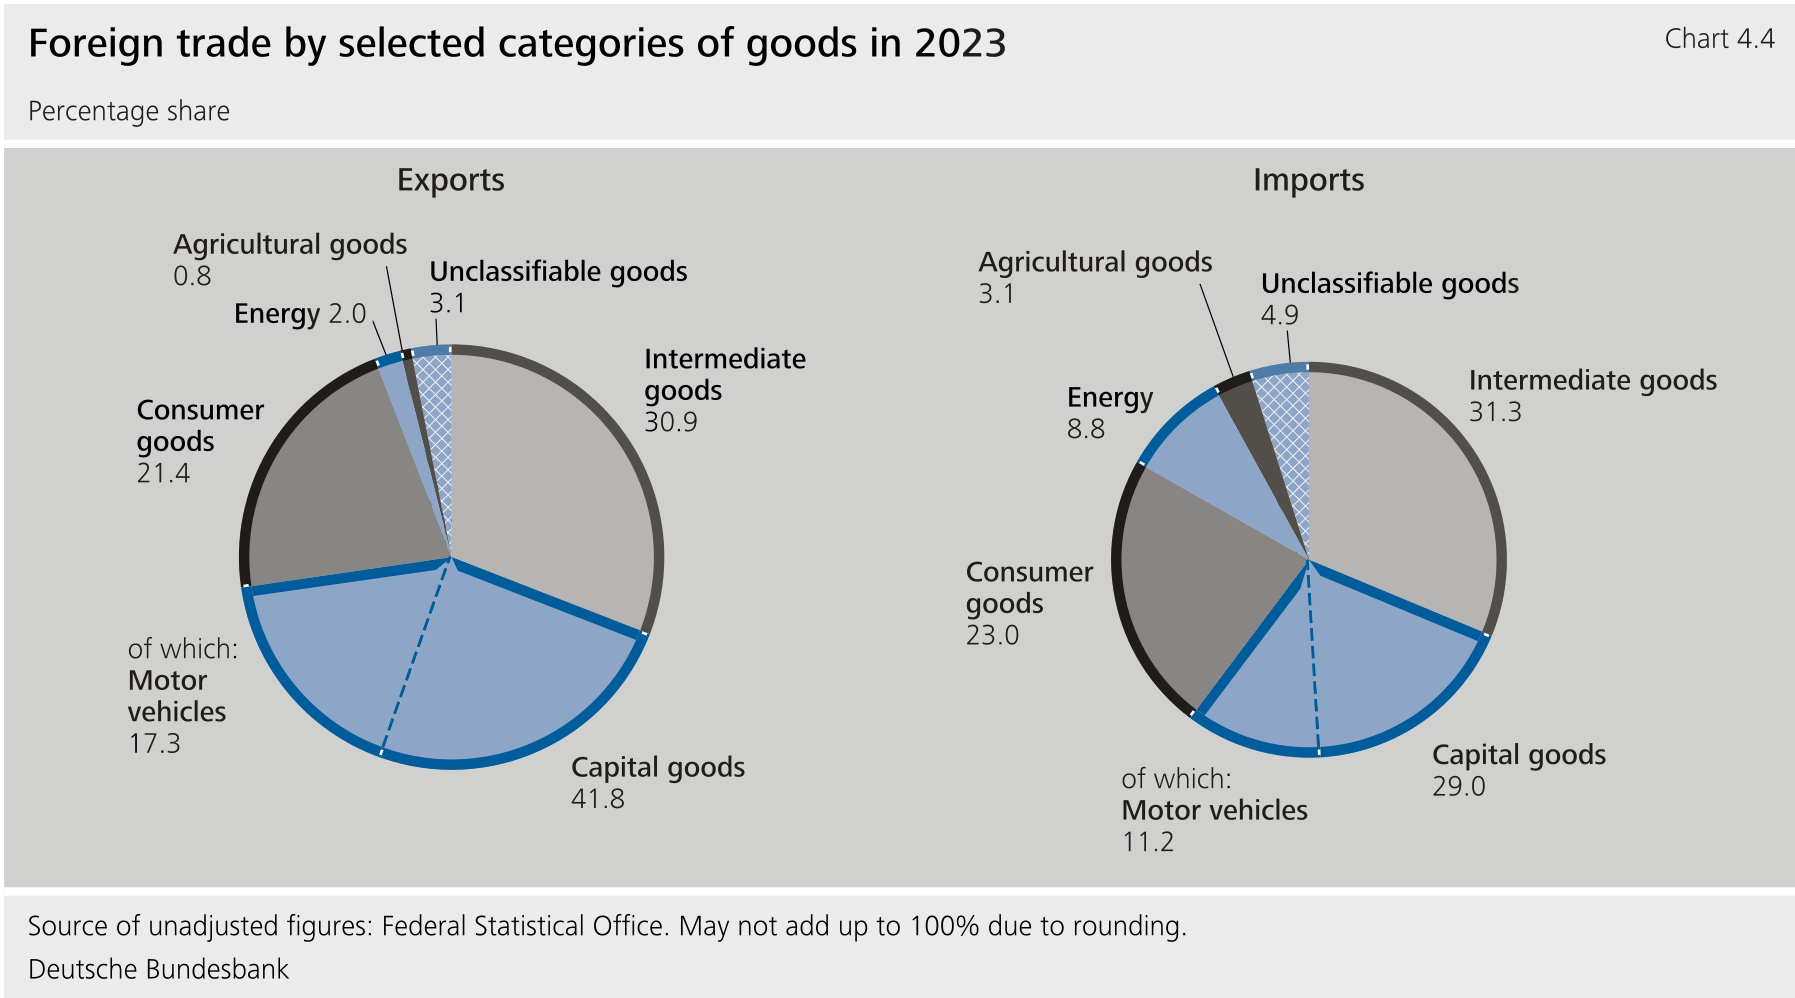**
****In terms of the product mix, price-adjusted exports fell broadly, but motor vehicle exports increased.** Exports of consumer goods recorded a sharp decline in price-adjusted terms, with deliveries of pharmaceutical products falling particularly sharply. As the − 19 pandemic subsided, global demand for − 19 vaccines declined. In addition, export goods such as fabricated metal products and, above all, chemical products saw considerable setbacks. Their energy-intensive production took a hit from the persistently high energy costs. In addition, exports of energy products such as electricity and gas fell very sharply.[\[3\]](#_ftn_root_3) There was also a lack of demand stimulus for traditional machinery and equipment, and deliveries of capital goods such as computers and communications technology fell significantly. By contrast, exports of motor vehicles and motor vehicle parts expanded sharply on an annual average.[\[4\]](#_ftn_root_4) Only a moderate development was observed over the course of 2023, however. Furthermore, German car exporters' annual average sales in important sales markets varied. Exports to the euro area and the United Kingdom rose considerably. Deliveries to the United States remained at the hugely elevated level of the previous year. By contrast, German exporters posted considerable declines in their business with China. In e-mobility, in particular, which is a growth industry, Chinese demand for motor vehicles was increasingly being covered by local production.**{#par-u4u88e}
****From a regional perspective, imports from non-euro area countries declined significantly more sharply than those from the euro area in nominal terms.** German importers were afforded relief not only by falling energy prices but also by significantly lower prices for intermediate goods. In terms of value, the losses in revenue sustained by non-euro area producers as a whole were nearly twice those of euro area suppliers. One factor was that imports from China fell sharply across the board.[\[5\]](#_ftn_root_5) In addition, imports from Russia, which consist largely of energy products and were feeling the effects of sanctions, fell to very low levels. Moreover, imports of oil and natural gas, most of which originate from third countries, became cheaper. In terms of value, deliveries from Norway fell considerably. Almost three-fifths of them are natural gas. This was driven by the decline in prices and also the lower volume of imported natural gas. By contrast, imports of crude oil and oil products from the countries rose sharply. In this case, the increase in quantities more than offset the decline in oil prices.**{#par-u83o26}
****Imports fell in price-adjusted terms for a wide range of products, but imports of motor vehicles rose sharply.** Price-adjusted imports of consumer goods declined considerably. Imports of pharmaceutical products also contracted, with the decline in demand for − 19 vaccines an important driver. Given weak industrial activity in Germany, foreign manufacturers' deliveries of important intermediate and capital goods such as metals and metal products, computers and communications technology and machinery shrank very significantly. Imports of electrical equipment declined markedly over the course of the year following an initial surge in 2022. After rising massively in the previous year, imports of chemical products fell markedly. In addition, imports of energy products receded significantly by volume. This is because energy consumption in Germany fell, which was associated mainly with weaker domestic economic output, especially in the energy-intensive sectors.[\[6\]](#_ftn_root_6) Considerably less natural gas was sourced from abroad.[\[7\]](#_ftn_root_7) In addition, imports of crude oil and bituminous coal dropped sharply. This was only partly offset by the considerable increase in imports of refined petroleum products and, in particular, electricity.[\[8\]](#_ftn_root_8) Imports of motor vehicles and motor vehicle parts rose very strongly. The bringing-forward of purchases played a role here. In the late summer, the government environmental bonus for the purchase of electric vehicles was restricted.**{#par-au2a7u}
****Merchanting trade and supplementary trade items dampened goods trade on balance.** The other components of trade in goods -- which include the supplementary trade items, net goods exports in merchanting trade, and trade in non-monetary gold -- mitigated the rise in the goods trade balance considerably on the whole.[\[9\]](#_ftn_root_9) On balance, the goods surplus increased by €101 billion to €227 billion.**{#par-uu72a6}
**The role of regional trade agreements in international trade flows** {#tar-2}
-------------------------------------------------------------------------------
****This analysis is based on a research paper by Nagengast and Yotov (2024).****{#par-oeuu12}
****Regional trade agreements (** **) have recently attracted increased attention.** World trade has lost significant momentum since the outbreak of the 2008‑09 global financial crisis.[\[1\]](#_ftn_root_1) In recent years, protectionist measures such as tariffs and non-tariff barriers to trade have probably curbed international trade.[\[2\]](#_ftn_root_43f4987c_2) In addition, supply chain disruptions caused by the − 19 pandemic and potential geopolitical tensions have recently shifted attention towards the diversification of inputs.[\[3\]](#_ftn_root_43f4987c_3) In this context, regional free trade agreements could help to boost international trade, growth and employment. They could also make it easier for firms to diversify their trading partners. The European Union is therefore seeking to conclude a new generation of free trade agreements, especially with growth regions.[\[4\]](#_ftn_root_43f4987c_4)**{#par-ee32o5}
****The impact of** **on international trade flows is one of the most widely studied and controversial topics in the literature on international trade.** Empirical estimates of how affect international trade flows are sometimes seen as unrealistically small. When conventional estimation methods are applied to gravity models, are estimated to increase trade between their member states by one-fifth.[\[5\]](#_ftn_root_43f4987c_5) Moreover, several papers indicate significant differences in the impact of regional trade agreements; these can vary widely depending on the agreements.[\[6\]](#_ftn_root_43f4987c_6) A more recent strand of the econometric literature has shown that conventional estimators of two-way fixed effects, however, may be severely biased if the effects of policy measures do indeed differ widely.[\[7\]](#_ftn_root_43f4987c_7) It proposes robust alternatives in this regard.[\[8\]](#_ftn_root_43f4987c_8)**{#par-e97243}
{#par-a89iee}
**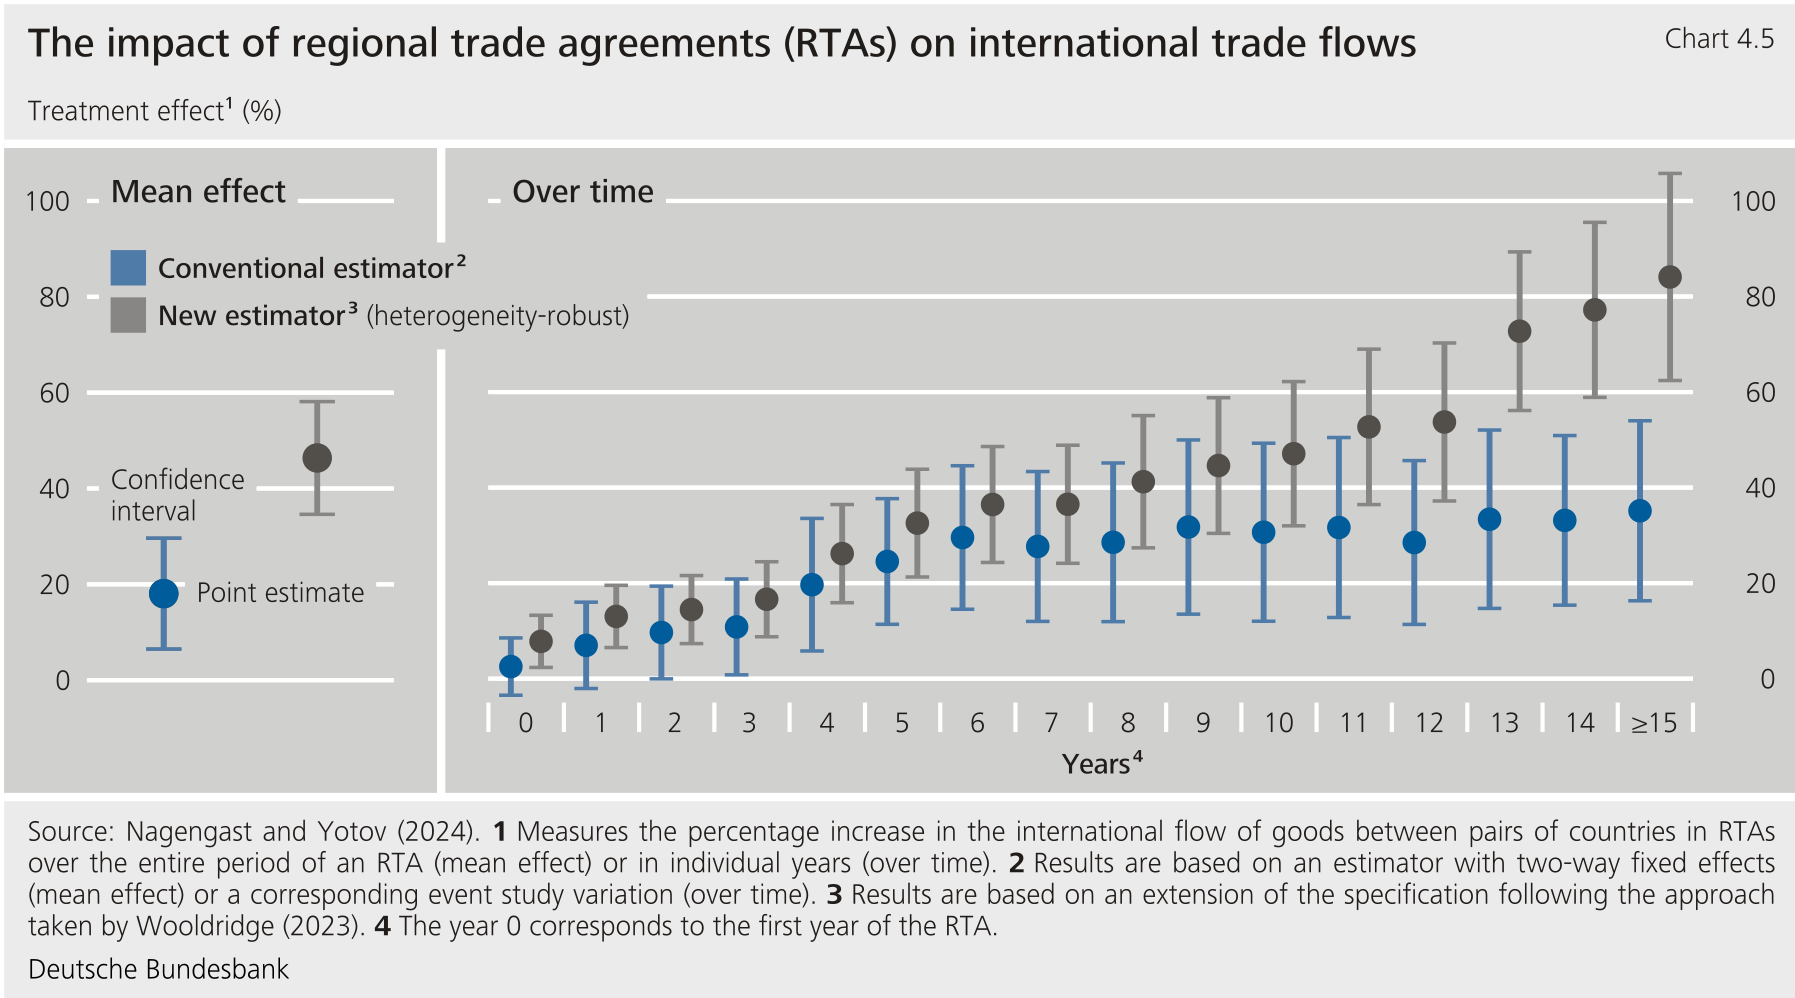**
****A new estimation approach suggests that** **have a significantly larger and longer-lasting effect on international trade flows.** [\[9\]](#_ftn_root_43f4987c_9) This approach adapts the methods proposed by Wooldridge (2023) to the characteristics of gravity models and is not affected by large differences in the impact of trade agreements.[\[10\]](#_ftn_root_43f4987c_10) The results show that increase trade between their member states by around 46 %. This figure is more than twice as large as the result obtained using conventional methods.[\[11\]](#_ftn_root_43f4987c_11) The result is also stable with regard to a number of robustness checks.[\[12\]](#_ftn_root_43f4987c_12) An event study variant of the conventional approach -- that allows the effects over time to be analysed -- also suggests that the positive effects of are exhausted relatively quickly, i.e. after around six years. By contrast, results obtained using the new estimation approach show that the effects of grow relatively evenly over the years and are still perceptible more than 15 years after these agreements have been signed.**{#par-i96991}
****The new estimator also suggests that newer trade agreements from the 2000s onward have been less effective in boosting international trade than earlier agreements.** [\[13\]](#_ftn_root_43f4987c_13) A breakdown of the average effect of trade agreements by date of conclusion shows that the effects were largest and mostly above average in the 1990s. There are a number of possible reasons for this. First, the trade agreements that were particularly natural in terms of geographical factors and existing cross-border value chains were already signed in the 1980s and 1990s. The economic potential of the more recent agreements signed in the 2000s was therefore smaller and more limited.[\[14\]](#_ftn_root_43f4987c_14) Second, the first two decades of the 2000s were marked by significant economic crises, such as the bursting of the dotcom bubble in 2000 and the global financial crisis. Third, the average applied most-favoured nation tariffs fell significantly over the sample period,[\[15\]](#_ftn_root_43f4987c_15) thereby leaving less scope for trade-enhancing effects of -related tariff reductions.**{#par-uu9e54}
****On balance, the effects of** **based on analyses using the new estimator are significantly larger than previously assumed.** They therefore also offer a positive outlook for remaining pairs of countries without trade agreements, as illustrated by a scenario based on a further estimation in which all pairs of countries without a trade agreement sign one.[\[16\]](#_ftn_root_43f4987c_16) The results provide preliminary indications that trade agreements between remaining pairs of countries would significantly boost trade, albeit to a lesser extent than the historical average. Looking ahead, the results thus provide an encouraging message that additional trade agreements, particularly ones that are deeper and more comprehensive, may further enhance international trade and make an important contribution to the diversification of suppliers and customers.[\[17\]](#_ftn_root_43f4987c_17)**{#par-ou614e}
{#par-ie25o8}
1. **{#_ftn_root_43f4987c_1} See Deutsche Bundesbank (2016).**
2. **{#_ftn_root_43f4987c_2} See Deutsche Bundesbank (2023a).**
3. **{#_ftn_root_43f4987c_3} See Deutsche Bundesbank (2023b, 2024).**
4. **{#_ftn_root_43f4987c_4} See **
5. **{#_ftn_root_43f4987c_5} See Baier et al. (2019) and Larch and Yotov (2023).**
6. **{#_ftn_root_43f4987c_6} See Baier et al. (2019).**
7. **{#_ftn_root_43f4987c_7} This stems from what are known as "forbidden comparisons". In this case, a comparison is being made with earlier episodes in which similar policy measures already yielded results -- instead of with a situation in which no measures were taken whatsoever. As a result, the estimator corresponds to a weighted average of the actual treatment effects. It can thus be biased either upwards or downwards. The weights can even be negative. The overall effects estimator is therefore not guaranteed to have the same sign as the individual treatment effects. See Borusyak et al. (2024).**
8. **{#_ftn_root_43f4987c_8} See de Chaisemartin and D'Haultfœuille (2020), Callaway and Sant'Anna (2021), Sun and Abraham (2021), Wooldridge (2021), and Borusyak et al. (2024). A comprehensive overview of the literature can be found in de Chaisemartin and D'Haultfœuille (2023) and Roth et al. (2023).**
9. **{#_ftn_root_43f4987c_9} For a more detailed description of the estimation approach and other results, see Nagengast and Yotov (2024). The analysis is based on trade data including domestic trade from the Structural Gravity Database of the World Trade Organization for the 1980‑2016 period, as well as data on free trade agreements from the Dynamic Gravity Dataset of the United States International Trade Commission. See Larch et al. (2019) and Gurevich and Herman (2018). encompass all bilateral trade agreements, such as free trade agreements, currency unions and economic integration agreements. This analysis assumes an "onset" of three years before their actual entry into force. This is because, when an is announced, which is usually several years before it is actually implemented, a number of trade barriers begin to fall and/or some economic agents begin to adjust their behaviour in anticipation of the agreement. See Moser and Rose (2012) and Egger et al. (2022).**
10. **{#_ftn_root_43f4987c_10} The new estimator takes into account varying effects at the cohort-year level and thus excludes "forbidden comparisons" with pairs of countries in which policy measures have already yielded results. The characteristics of gravity models are taken into account through the use of the non-linear Poisson pseudo maximum likelihood () estimator and the fixed effects structure that is standard in the literature.**
11. **{#_ftn_root_43f4987c_11} A calculation of the implied weights of the conventional estimator using the method presented in de Chaisemartin and D'Haultfœuille (2020) suggests that it is biased downward compared to the new estimator since it puts larger weights on short-run effects and the effects of recent agreements, both of which tend to be smaller.**
12. **{#_ftn_root_43f4987c_12} For details, see Nagengast and Yotov (2024).**
13. **{#_ftn_root_43f4987c_13} We reach this finding even though have become deeper and more comprehensive over time. Empirical results for this analysis show that deeper trade agreements lead to more trade than shallower trade agreements (see, inter alia, Osnago et al. (2019) and Larch and Yotov (2023)). However, this effect is overshadowed by other factors that lead to trade agreements having a smaller impact over time.**
14. **{#_ftn_root_43f4987c_14} See Baier and Bergstrand (2004) and Fontagné and Santoni (2021).**
15. **{#_ftn_root_43f4987c_15} See Teti (2020).**
16. **{#_ftn_root_43f4987c_16} To this end, the differences in the impact of trade agreements are first explained using bilateral determinants -- such as geographical distance, common language, colonial ties and tariffs -- as well as country-specific determinants such as market size (see, inter alia, de Chaisemartin and D'Haultfœuille (2022), Shahn (2023) and Baier et al. (2019)). These results are then used in a partial model framework to calculate the counterfactual scenario in a back-of-the-envelope manner. It should be noted, however, that the counterfactual scenario does not take into account general equilibrium effects such as trade diversion. These probably to tend to weaken the partial equilibrium results.**
17. **{#_ftn_root_43f4987c_17}For an analysis of the effectiveness of individual provisions in trade agreements, see, inter alia, Breinlich et al. (2022).**
### **1.3 Invisible current transactions**
****In 2023, the deficit in the cross-border services account increased considerably on the year to €63 billion.** That is the largest deficit in this account in more than two decades. Both lower receipts and higher expenditure contributed to this result. Exports of services declined slightly by ½% to €407 billion, after having risen markedly in the two preceding years. The primary reason for the decline was the disappearance of two special effects from the previous year. First, German transport freight rates fell from their exceptionally high level in 2022. Second, some intellectual property revenue in the pharmaceutical sector was eliminated. Services imports grew by just over 5 % to €470 billion, having already surged in the two preceding years. It was particularly cross-border travel expenditure which increased. However, expenditure in other services sectors was also up, in some cases significantly. This was only partly counteracted by a fall in German contractors' expenditure on goods transport services provided by foreign vendors.**{#par-e7u228}
****The travel account made by far the largest contribution to the high deficit in the services account.** At €69 billion in 2023, this sub-account once again posted the highest nominal deficit since records began. This represents an increase in the deficit by roughly €14 billion compared with 2022. Travel receipts -- which Germany generates largely through travel for trade fairs, events and business trips -- increased by around one-seventh. However, they continued to fall short of pre-pandemic levels. By contrast, the travel expenditure of German residents travelling abroad, which is characterised by holiday bookings, has already been above pre-pandemic levels since 2022. In 2023, it increased again by more than one-fifth to €103½ billion. These funds are now being channelled to a greater extent than before the pandemic to other countries, while spending on long-distance travel, especially to Asia, has not yet recovered to the same extent.**{#par-ee1ii6}
****In 2023, cross-border transport services represented a substantial sub-item in the services account in terms of turnover.** Following massive increases in freight rates, in particular, in 2021 and 2022, prices went back down in the reporting year. However, given weakness in foreign trade, volume effects may also have played a dampening role. Residents' receipts from transport services -- which includes not only German transport companies' proceeds from sea, land and air transport but also the operation of pipelines and electricity transmission -- as well as domestic expenditure on transport services both fell by one-sixth. Compared with the previous year, the deficit in this area fell marginally by €1½ billion. Other components of the services account related to the goods trade -- manufacturing, maintenance and repair services -- posted a slightly reduced surplus.**{#par-e79223}
****In 2023, the surplus in the item "Charges for the use of intellectual property" decreased by €8 billion compared with the previous year.** The main reason for this development was the disappearance of the high revenues associated with the development of vaccines, which had led to high one-off revenues in 2021 and 2022.**{#par-a598e9}
****In the year under review, turnover in other knowledge-based and business services rose distinctly.** The sub-account for cross-border telecommunications, computer and information services continued to post a deficit similar to that of the previous year. By contrast, the account for other business services, which include research and development, professional, technical and commercial services, as well as management consultancy services, contracted markedly by €4 billion. This was mainly due to increased expenditure on research and development abroad. The balance in cross-border insurance, pension and financial services barely increased.**{#par-a68oi1}
****In the reporting year, the primary income balance recorded a massive and virtually unchanged surplus of €144 billion.** The surplus was only around €2 billion higher than in 2022, after having risen sharply in the two preceding years. As a result, net primary income alone represented some 3½% of .**{#par-ae85i9}
{#par-i2e957}
**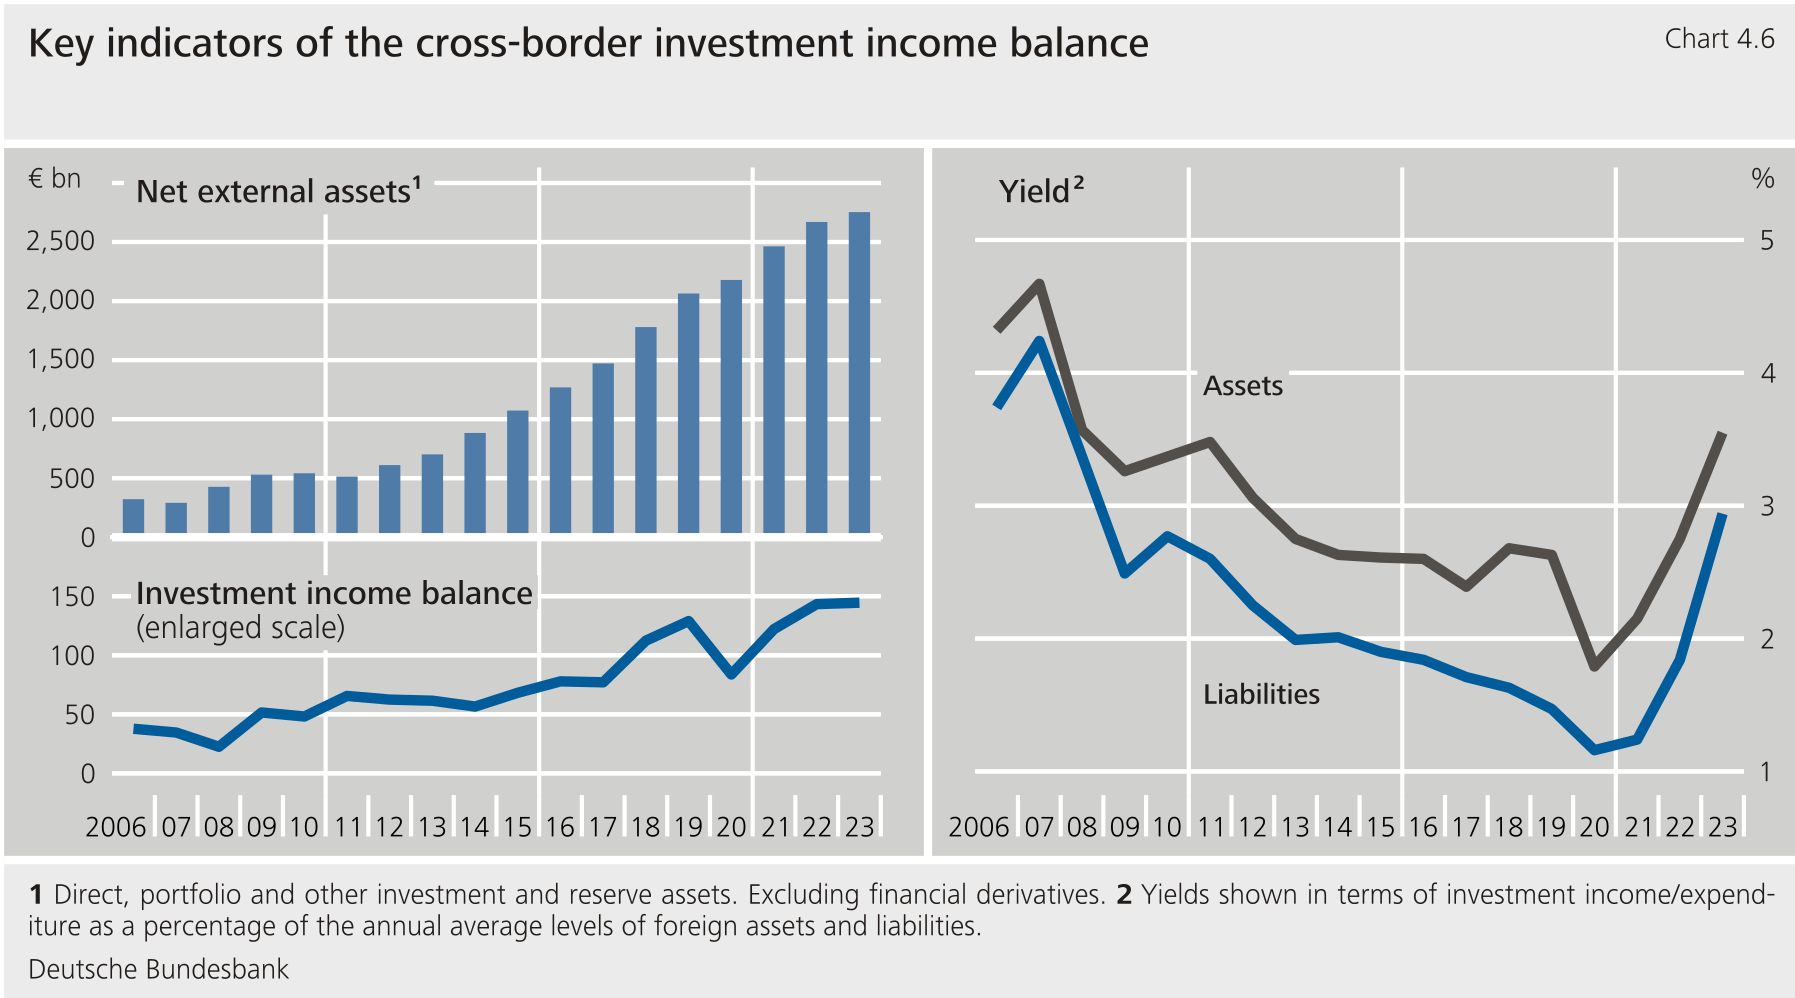**
****The high primary income balance is primarily the result of net investment income.** Payments by residents to foreign investors rose substantially on the year. Owing to the considerable net external assets of German residents, domestic investors' and lenders' income from cross-border investment far exceeded their expenditure. Income increased significantly on the year. On both sides of the balance sheet, this increase is mainly attributable to the higher level of interest rates.**{#par-i4i195}
****The deficit in the cross-border secondary income account, which had grown in recent years, shrank slightly in 2023.** In the reporting year, expenditure exceeded revenue by €65½ billion, or by €1½ billion less than a year earlier. Both revenue (+€6½ billion) and expenditure (+€5 billion) increased moderately. With the balance having changed little, it was primarily non-government cross-border secondary income which saw turnover growth. The underlying payment flows are predominantly insurance premiums or insurance claims adjustments by internationally active insurance companies. By contrast, remittance amounts remained stable. Aggregate government payment flows remained at the same level as in the previous year. On the revenue side, this relates, among other things, to taxes on income and wealth generated in Germany by non-residents. On the expenditure side, expenditure on Germany's contributions to the budget, which are measured in terms of gross national income, fell. However, other payments relating to international cooperation, such as government assistance to Ukraine, largely offset this decline.**{#par-a81a77}
{#par-ie74oe}{#par-oei3a6}{#par-oe39u1}{#par-e81947}{#par-i73i5i}{#par-ae2974}{#par-o549o3}{#par-e8oau7}{#par-e959ei}{#par-e9o1e4}{#par-e64o27}{#par-u94577}{#par-ii9725}{#par-i5oe6e}{#par-u37i59}{#par-o1355e}{#par-eoi476}{#par-a1i5i4}{#par-au3132}{#par-e3257a}{#par-a1ee43}
| **Table 4.2: Major items of the balance of payments** billion ||||
| Item | 2021^r^ | 2022^r^ | 2023^r^ |
| I. Current account | + 263.5 | + 164.6 | + 243.1 |
| 1. Goods | + 196.5 | + 125.9 | + 226.8 |
| Receipts | 1,375.1 | 1,580.0 | 1,539.2 |
| Expenditure | 1,178.6 | 1,454.1 | 1,312.4 |
| Memo item: | |||
| Foreign trade^1^ | + 175.3 | + 88.6 | + 209.6 |
| Exports | 1,379.3 | 1,594.0 | 1,562.4 |
| Imports | 1,204.0 | 1,505.4 | 1,352.8 |
| 2. Services | + 1.6 | − 37.3 | − 63.0 |
| of which: | |||
| Travel | − 24.3 | − 54.9 | − 68.9 |
| 3. Primary income | + 123.2 | + 142.1 | + 143.9 |
| of which: | |||
| Investment Income | + 122.2 | + 143.3 | + 144.5 |
| 4. Secondary income | − 57.8 | − 66.1 | − 64.6 |
| II. Capital account | − 2.6 | − 21.6 | − 27.3 |
| III. Financial account^2^ | + 209.0 | + 198.2 | + 232.6 |
| 1. Direct investment | + 81.5 | + 112.2 | + 59.7 |
| 2. Portfolio investment | + 197.2 | + 10.7 | + 1.2 |
| 3. Financial derivatives^3^ | + 47.9 | + 41.5 | + 40.0 |
| 4. Other investment^4^ | − 149.5 | + 29.3 | + 130.9 |
| 5. Reserve assets | + 31.9 | + 4.4 | + 0.9 |
| IV. Errors and omissions^5^ | − 51.9 | + 55.2 | + 16.7 |
|-----------------------------|---------|---------|---------|
{#par-eo7622}
**Current account balances: determinants over time and between countries** {#tar-3}
-----------------------------------------------------------------------------------
****As part of the balance of payments, the current account is primarily a record of a country's economic transactions with the rest of the world.** The current account balance is influenced by numerous factors, some of which are structural, and others cyclical in nature. What is always relevant to the current account balance is how domestic factors perform relative to those abroad. Structural factors include, for example, the energy intensity of an economy or demographics; they are typically long-term in nature. Cyclical factors change continuously and show, for instance, whether a country's domestic economy is performing better or worse than that of other countries.**{#par-aieou5}
****The analysis presented here focuses on the factors influencing the current account balance via savings and investment behaviour domestically and abroad.** The current account balances are estimated using domestic and foreign variables over time that have an important influence on savings and investment behaviour. A panel regression with correlated random effects () is used for the estimation. This estimation method allows for the simultaneous, yet separate, analysis of a panel's time series and cross-sectional variation.[\[1\]](#_ftn_root_47f2b759_1)**{#par-a6a17u}
****The selection of variables used in this approach is based on the** **'s estimations of current account balances as part of its External Balance Assessment.** [\[2\]](#_ftn_root_47f2b759_2) Disparities arise, inter alia, from the fact that the , in accordance with its mandate, also includes many emerging market economies in its analyses. Only advanced economies are included in the panel used in the estimation presented here.[\[3\]](#_ftn_root_47f2b759_3) The approach draws on annual data from a total of 24 countries. The period covers the years from 1999 to 2022. Unless stated otherwise, all variables enter the estimation as differences to the global average.[\[4\]](#_ftn_root_47f2b759_4) This ensures that any developments that are common to all countries have no effect on the estimated current account balances.[\[5\]](#_ftn_root_47f2b759_5)**{#par-o934u3}
****The explanatory variable is the current account ratio, defined as the current account balance in relation to nominal** **.** Standardisation using facilitates a comparison across countries and over time. Given that -- with the exception of statistical discrepancies -- on aggregate the national current account balances must be balanced worldwide, this variable is not defined as a difference to the global average.[\[6\]](#_ftn_root_47f2b759_6) The variables described below serve as regressors.**{#par-o7ou3o}
****The net external position in relation to** **:** a high net external asset position tends to generate higher investment income, which is a component of the current account balance. Consequently, in and of themselves, higher net external positions are likely to have a positive effect on current account balances. However, a higher asset position also enables increased consumption, which then promotes a lower current account balance. The previous year-end figure is applied to show the effect on net investment income. Differences to the global average are not calculated here for the same reasons that apply to the current account balance.**{#par-ei1e6u}
****Energy balance in relation to** **:** as trade in energy sources is recorded in the trade balance, the energy balance is included directly in the current account balance. However, the correlation does not necessarily translate one-to-one due to second-round effects. Therefore, the energy balance is not simply deducted from the current account balance (this would be equivalent to restricting the relevant coefficient to one); rather, its effect on the current account balance is estimated without restrictions. However, a positive sign is to be expected. It is not necessary to calculate a difference to the world average.**{#par-iu6eeu}
****Real economic growth** contains a demand and a supply component. For demand-related reasons, higher consumption and investment demand is more likely to have a negative effect on the current account balance. This effect correlates strongly with the "utilisation rate" and "lending" control variables described below. On the supply side, rising output is likely to go hand in hand with growth in exports, which would give rise to the expectation of a positive effect on the current account balance. However, a high level of international competitiveness, for instance, not only benefits the domestic economy's exports, but also its local investment activity, meaning that the net effect on the current account balance is not clearly defined a priori.**{#par-e59322}
****The economy's utilisation rate:** the percentage deviation of actual real from potential output is a typical cyclical variable. It takes account of the observation that in an economic upturn, economies tend to have current account deficits as a result of increased domestic demand.[\[7\]](#_ftn_root_47f2b759_7)**{#par-ie6738}
****Lending to the private sector in relation to** provides information on domestic consumption and investment demand. It is also strongly cyclical and is often responsible for the emergence of financial and macroeconomic imbalances, especially if the economy overheats.[\[8\]](#_ftn_root_47f2b759_8) Viewed from this perspective, a negative sign is to be expected as an effect on the current account balance over time.**{#par-u327u8}
****The share of comparatively high incomes in an economy:** when the share of total national income accruing to the top 10 % of incomes goes up, the current account balance is expected to increase as a direct result. The reason is that this segment of the population is more likely to utilise income gains for additional savings and wealth creation than for additional consumption.[\[9\]](#_ftn_root_47f2b759_9)**{#par-ui8a84}
****Net lending/borrowing by general government in relation to** represents government savings less public investment and therefore indicates the contribution made by general government to a country's current account balance. Like the energy balance, it is directly included in the current account balance. Although the sign should therefore be positive, the coefficient may deviate from one due to second-round effects.**{#par-eoai56}
****Percentage of primary savers in the labour force:** it is assumed that the population group aged between 45 and 64 typically saves more than the other age groups in the population. It is referred to here as the "primary savers" group. Therefore, a relatively high percentage of primary savers in the labour force is more likely to be associated with higher savings. With respect to the current account balance, a positive correlation is expected here.**{#par-uia729}
****However, the analysis not only considers the current share of primary savers, but also their average life expectancy** .[\[10\]](#_ftn_root_47f2b759_10) The higher the life expectancy is for this population group, the more they should save for old age. Viewed in isolation, this should increase the current account balance.**{#par-a76ai4}
****Conversely, the ratio of the population aged over 64 to the working age population** expresses the relative significance of older people in relation to the labour force. Within the context of the current account estimation, a negative sign is expected for this variable because it is assumed that older people are at a stage in their lives when they are more likely to use up their savings ("dissave") than to continue to accumulate additional assets.**{#par-ae2551}
****Population growth** is used to approximate the influence exerted by other segments of the population in the economy that initially make no direct contribution to the accumulation of savings in a country. This makes it possible to capture the influence of population growth through births and migration. We would also expect a negative sign for this variable within the context of the current account estimation.**{#par-i99eu6}
****The following panel regression is estimated using a** **approach:** [\[11\]](#_ftn_root_47f2b759_11)**{#par-eaii2u}
**$$ ca\\,gdp=(x_{it}-\\bar{x}_{i})\\beta_{1}+\\bar{x}_{i}\\beta_{2}+c+\\mu_{i}+\\gamma_{t}+\\varepsilon_{it} $$**{#par-e5a9o7}
**where \\( ca\\,gdp_{it} \\) is the current account ratio defined as the current account balance in relation to the nominal of country \\( i \\) at time \\( t \\) and \\( x_{it} \\) is a vector containing k variables corresponding to the determinants described above. \\( \\bar x_i \\) is a vector of the time series averages of the k variables of \\( x_{it} \\); \\( c \\) is a constant, \\( \\mu_i \\) is an unobserved country-specific random effect, \\( \\gamma_t \\) stands for time-specific fixed effects and \\( \\varepsilon_{it} \\) is the error term.**{#par-e3i5o1}
****The estimated coefficients of the vector** \\( \\hat \\beta_1 \\)**map the effect of the time series variation in a country's data and are therefore referred to as "within group"; the estimated coefficients of the vector** \\( \\hat \\beta_2 \\)**reflect the effects of the cross-sectional variation in the data, are equivalent to a "between-effects" estimator and referred to as "between group".** The two effects combined determine the result of the estimated current account balances. The model permits the effect of deviations over time within the individual countries ("within group") and between countries ("between group") to be estimated simultaneously and separately. The approach is thus more general than the usual fixed-effects estimator.[\[12\]](#_ftn_root_47f2b759_12) Based on the estimation presented here, no normative statements are made as to whether the values for the current account balances determined in this way are appropriate or in equilibrium.**{#par-oi2495}
{#par-e1a996}{#par-a38452}{#par-ou9ae1}{#par-ao946i}{#par-e5e5i7}{#par-u23321}{#par-i59uei}{#par-eai8uu}{#par-ouua87}{#par-ie145e}{#par-o3o766}{#par-o85ea3}{#par-ou95eu}
| **Table 4.3: Current account balance in relation to** **: estimation results based on the correlated random effects approach (** **approach)** |||
| Item | (1) | (2) |
| Coefficient | \\( \\hat \\beta_1 \\) Within Group | \\( \\hat \\beta_2 \\) Between Group |
|--------------------------------------------------------------------|-------------------------------------|--------------------------------------|
| Net external position in relation to | 0.016 \*\*\*{#par-i35ao5} (0.006) | 0.065 \*\*\*{#par-aeu816} (0.005) |
| Energy balance in relation to | 0.008 \*\*\*{#par-iuio11} (0.001) | − 0.001 \*\*\*{#par-u52973} (0.000) |
| Real economic growth | 0.045{#par-o3ue62} (0.086) | 1.915 \*\*\*{#par-uu121o} (0.397) |
| Economy's utilisation rate | − 0.537 \*\*\*{#par-i7429i} (0.090) | − 0.401 \*\*{#par-e4u3u4} (0.200) |
| Lending to the private sector in relation to | − 0.047 \*\*\*{#par-e4au89} (0.011) | 0.033 \*\*\*{#par-i64ie9} (0.006) |
| Share of comparatively high incomes in an economy (top 10 %) | 0.385 \*\*\*{#par-u69e87} (0.084) | − 0.096 \*\*{#par-u89oo8} (0.045) |
| Net lending/borrowing by general government in relation to | 0.282 \*\*\*{#par-a9o2oi} (0.062) | 0.267 \*\*\*{#par-e9a49u} (0.093) |
| Percentage of primary savers in the labour force | 0.011{#par-oa9317} (0.096) | 0.221{#par-e83554} (0.168) |
| Average life expectancy of primary savers | 0.086{#par-i4a6eo} (0.187) | 0.328 \*\*\*{#par-a5451e} (0.058) |
| Ratio of the population aged over 64 to the working age population | 0.132 \*\*{#par-ao3751} (0.058) | 0.146 \*\*\*{#par-u8842o} 0.033 |
| Population growth | − 1.185 \*\*{#par-o8oo71} (0.481) | − 0.671{#par-i264u2} (0.448) |
| Constant | − 0.606{#par-i347ei} (1.093) ||
| Observations | 493 ||
| Years | 1999‑2022 ||
| R² | 0.72 ||
| Between group R² | 0.87 ||
| Within group R² | 0.44 ||
{#par-i62o62}
****The results of the estimated coefficient largely confirm the considerations applied when selecting the variables.** In Table 4.3, column (1) contains the within-group coefficients . The within-group coefficient shows how a variable affects a country over time. The strength of the effect is assumed to be the same over the entire period and for all countries. As expected, net external assets in the preceding period, the balance of trade in energy sources, general government net lending/borrowing and the share of comparatively high incomes exert a positive effect on the current account balance.[\[13\]](#_ftn_root_47f2b759_13) Also as expected, the utilisation rate and lending to the private sector -- both cyclical factors -- have a negative effect. Among the demographic factors, population growth has the anticipated negative impact on the accumulation of savings. The share of the population of retirement age relative to the working population also influences the result, but, contrary to the assumption made, with a positive sign. It appears that older people in advanced economies often continue to accumulate assets instead of gradually using them up. The reasons for this may include uncertainty with regard to their own life expectancy or future nursing care needs, as well how the pension system is structured and a desire to leave assets to future generations.**{#par-e2363i}
****The within-group estimation demonstrates, for example, the relevance of the balance of trade in energy sources** **with regard to the decline in the German current account balance in 2022 compared with the previous year.** The panel approach yielded a significant positive coefficient of 0.008 for this variable. Germany's current account balance in relation to was 4.2 % in 2022, having stood at 7.3 % the previous year. The deterioration in Germany's balance of trade in energy sources had a particularly significant impact and (with an estimated coefficient of 0.008), when viewed in isolation, accounted for one percentage point (i.e. around one-third) of this decline.**{#par-o24e82}
****In the cross-country comparison -- column 2, between-group coefficients -- the country-specific average life expectancy of primary savers has the anticipated positive impact on the current account balance.** The cross-sectional view also confirms the positive contribution to savings made by the older population. Moreover, in a cross-country comparison, external assets in the preceding period and net lending/borrowing by general government also have a positive effect on the current account balance, while the utilisation rate has a dampening effect, as expected.**{#par-oo8o7e}
****However, the cross-country comparison also shows that structural measures which, for example, strengthen competitiveness tend to have a positive effect on the current account balance.** This is indicated by the positive coefficient for economic growth. This effect was uncertain a priori, as a high level of international competitiveness not only benefits the domestic economy's exports, but also local investment activity.**{#par-a9uu14}
****The** **estimation method shows that differences between countries can play a significant role in explaining current account balances.** The estimation's comparatively high R² (0.72) is due largely to the explanatory power of the "between" variation; the corresponding R² is 0.87. Consequently, it is higher than that of the "within" heterogeneity (0.44).**{#par-e31o74}
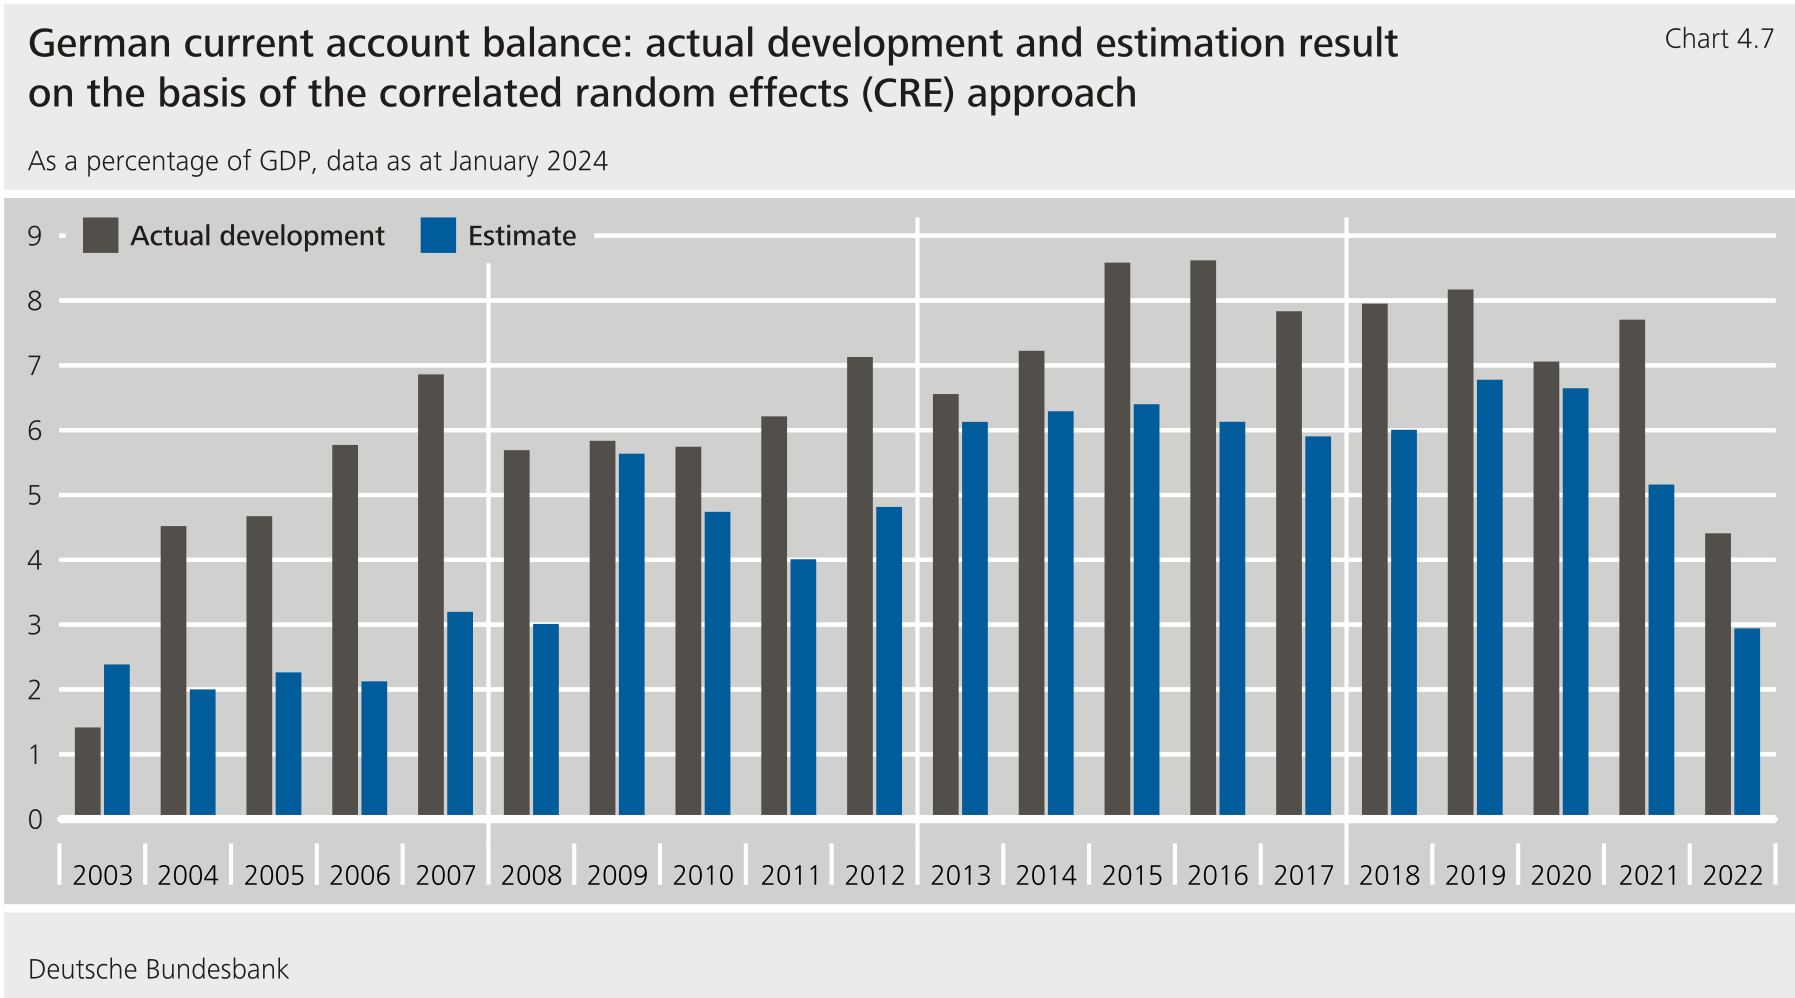
****The model presented, which was estimated using the** **approach, exhibits a comparatively high explanatory power for Germany's current account ratio in recent years.** This applies both to the extended period of very high current account surpluses in relation to and to the decline in 2022.**{#par-a9i9ai}
{#par-oeo64o}
****
1. **{#_ftn_root_47f2b759_1} For a detailed description of the method, see Deutsche Bundesbank (2023c) and Fischer (2019).**
2. **{#_ftn_root_47f2b759_2} See Allen et al. (2023); Cubeddu et al. (2019); International Monetary Fund (2018).**
3. **{#_ftn_root_47f2b759_3} For example, the takes account of, inter alia, the relevance of capital controls, which are only of secondary importance for advanced economies.**
4. **{#_ftn_root_47f2b759_4} Calculated on the basis of the data available for a larger group of 56 countries.**
5. **{#_ftn_root_47f2b759_5} The bulk of the data originate from the 's database; lending to the private sector is taken from the 's International Financial Statistics, the international investment position from the 's Balance of Payments Statistics, population data by age group and life expectancy at birth from the United Nations World Population Prospects, data on the export and import of energy sources from the International Energy Agency, and the share of the top 10 % of national income from the World Inequality Database. The current account balance for Germany is calculated by the Bundesbank and Germany's is calculated by the Federal Statistical Office.**
6. **{#_ftn_root_47f2b759_6} However, because the estimation uses current account balances in relation to and the sample does not cover every country, the variable's annual average is different from zero. Time-specific fixed effects take this fact into account in the panel estimation.**
7. **{#_ftn_root_47f2b759_7} Data on the utilisation rate for all countries are taken from the International Monetary Fund's database.**
8. **{#_ftn_root_47f2b759_8} As financing via the capital market became increasingly important for enterprises during the period of low interest rates, this may also affect the "lending to the private sector" variable. See Deutsche Bundesbank (2017a).**
9. **{#_ftn_root_47f2b759_9} The ratio can be interpreted as a (one-sided) indicator for income inequality. See Dao (2020).**
10. **{#_ftn_root_47f2b759_10} The average life expectancy at birth of people aged between 45 and 50 is used here. Although the remaining life expectancy of primary savers would be preferable from a methodological viewpoint, it is not available for all countries.**
11. **{#_ftn_root_47f2b759_11} For detailed information on the methodology used, see Deutsche Bundesbank (2023c) and Fischer (2019).**
12. **{#_ftn_root_47f2b759_12} In the special case of \\( \\hat \\beta_1 \\)and \\( \\hat \\beta_2 \\)being identical, the estimation is equivalent to a conventional random effects estimation. This can be verified using a Hausmann test and was rejected in the present case.**
13. **{#_ftn_root_47f2b759_13} All variables discussed here are statistically significant at a level of at least 5 %.**
****2 Capital movements**** {#tar-4}
------------------------------------
### **2.1 Underlying trends in capital movements**
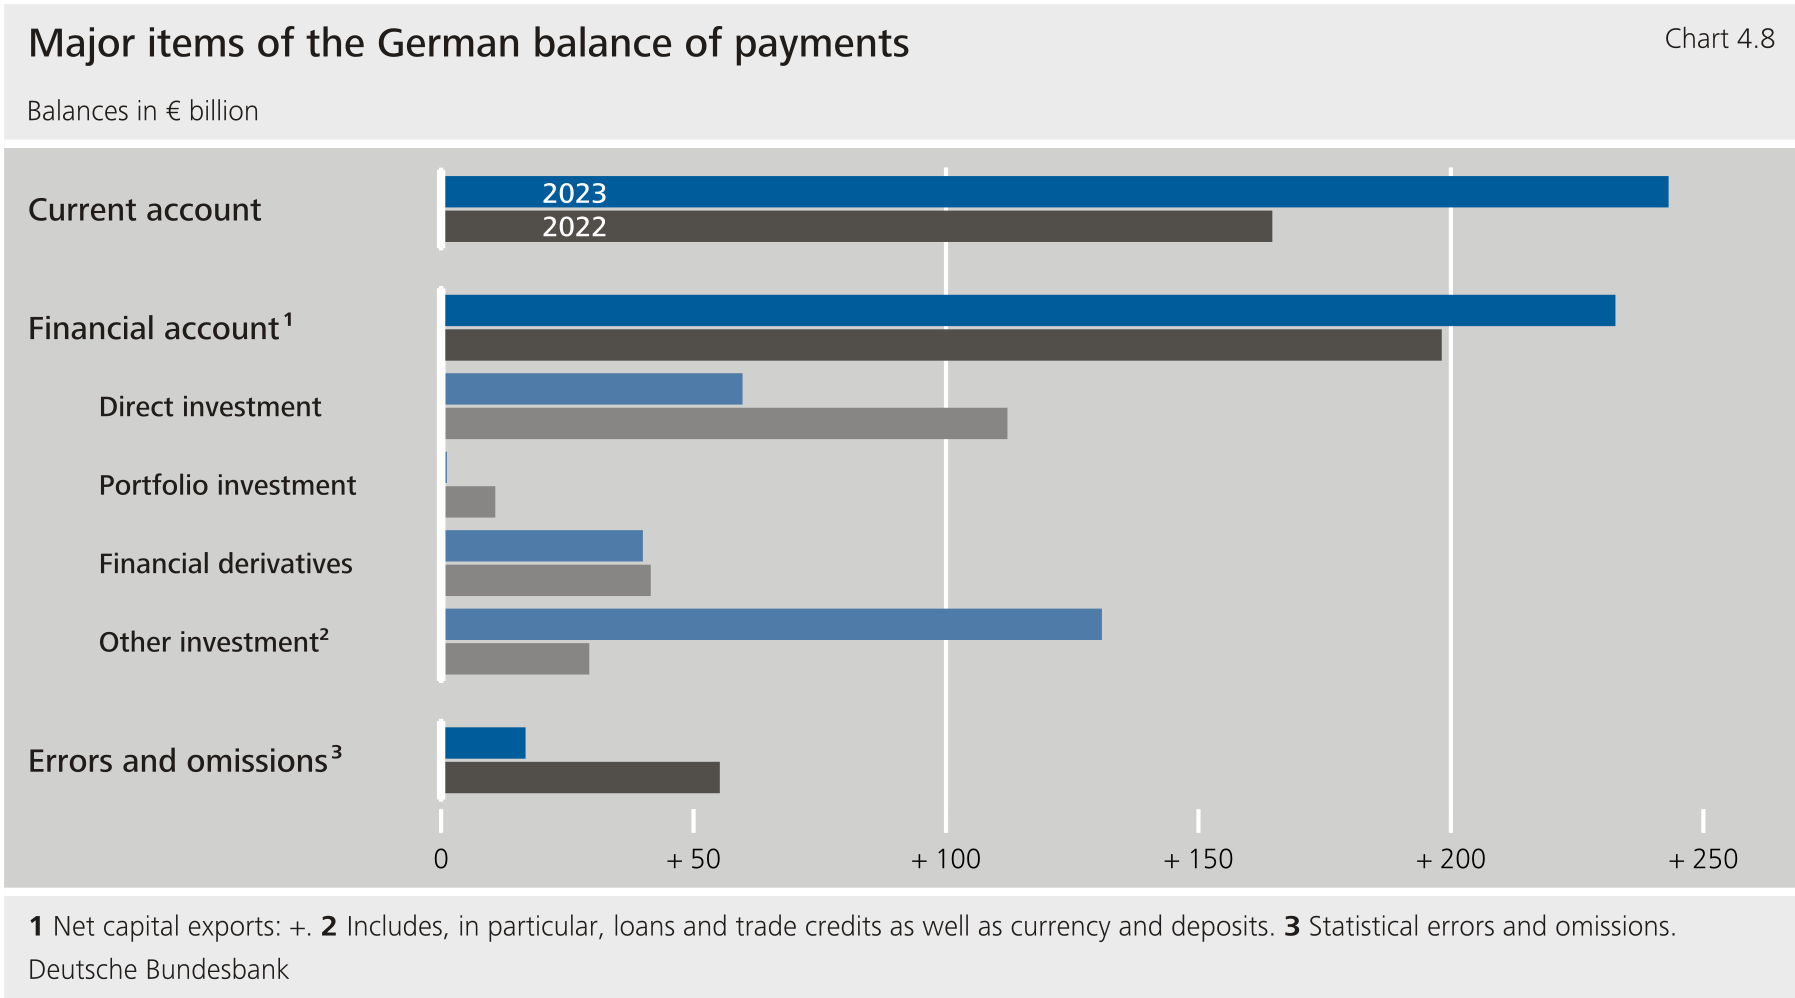
****Germany's net capital exports came to €232½ billion in 2023, which was significantly higher than in the previous year (€198 billion).** This rise was in line with the marked increase in the current account surplus, but was smaller in scale. As the third component of the balance of payments, the capital account closed with a deficit of €27½ billion. The capital account records capital transfers and transactions in non-produced, non-financial assets, such as trading in emissions allowances or transactions in certain cryptocurrencies.[\[10\]](#_ftn_root_10) The remaining difference between the balance on the current account and the capital account and the balance on the financial account is attributable to statistical errors and omissions (€16½ billion).**{#par-e19aee}
{#par-oe8324}
****
****The tight monetary policy with which central banks responded to high inflation led to rising financing costs for enterprises on the global financial markets into the autumn.** At the beginning of the year, the financial markets temporarily experienced strong tensions, as some credit institutions in the United States and Europe came under pressure from rising interest rates. The tensions in the banking sector, however, were institution-specific and did not have any wider repercussions.**{#par-i284e7}
****Towards the end of the year, inflation developments were unexpectedly favourable, increasing the likelihood that key interest rates would fall over the course of 2024.**In the United States, robust economic data boosted confidence that the economy could achieve a soft landing in the event of declining inflation. This outlook increased investors' risk appetite and was reflected, among other things, in rising stock prices worldwide.**{#par-a9564i}
****The more restrictive monetary policy had an impact on German portfolio investment throughout the year.** First, interest rates rose, making interest-bearing securities more attractive again. Second, the Eurosystem discontinued reinvestments under the in the course of 2023. In the past, the Eurosystem's net monetary policy purchases had played a major part in the declining volume of European debt securities held abroad. Under the changed monetary conditions, German investors added significantly more securities from other euro area countries to their portfolios in 2023 than in previous years. Conversely, German debt securities likewise attracted lively interest abroad again. Gross portfolio investment flows in the German balance of payments came to €47 trillion, which was around the same amount as in the previous two years. After 2020, flows had increased rapidly after the United Kingdom left the European Union and a number of banks shifted their intra-group business.[\[11\]](#_ftn_root_11) This process now appears to be complete, at least with regard to trading activities.**{#par-a76u75}
****Germany's direct investment flows fell dramatically in the face of the multiple challenges described above.** This affected both inflows and outflows. Running counter to this trend, however, German direct investment flows to China remained quite high. This is all the more noteworthy given that heavy dependence on China is viewed critically in the economic policy debate, and that other Western countries tended to reduce their investment in China. However, it is important to bear in mind that the bulk of Germany's direct investment flowed to other European countries last year.**{#par-aii1u3}
****On balance, Germany's higher net capital exports were reflected in other investment.** The increase in the claims of enterprises and households in the form of deposits with foreign credit institutions and cash was a particularly striking development. This finding is indicative of low risk appetite among market participants, which prevailed for much of 2023. By contrast, the Bundesbank's net external position in other investment declined. This was due to lower claims on the compared with the previous year. These fell as a result of the tighter monetary policy stance and the resulting decrease in excess liquidity in the Eurosystem.**{#par-ai855a}
### **2.2 Portfolio investment**
****As outlined above, monetary policy in the major economies had a key influence on portfolio investment over the course of the year.** In addition, divergent economic prospects for the major currency areas affected events on the financial markets in general. In the first three quarters of 2023, inflation rates on both sides of the Atlantic were surprisingly persistent. In the United States, the raised the lower bound on the target range for the federal funds rate from 4.25 % to 5.25 %, implementing its final interest rate hike to date on 27 July 2023. The Eurosystem also raised its key interest rates, increasing them by a total of two percentage points in six interest rate steps up to the end of September. This tightening of the monetary policy reins beginning in July 2022 was the sharpest in the euro's history. The deposit facility rate has been at 4 % since 20 September 2023.[\[12\]](#_ftn_root_12) The Eurosystem also increased the degree of monetary policy restriction by gradually phasing out reinvestment under the by the end of June. In combination with investors' low risk appetite, these measures resulted in rising financing costs for enterprises in Germany and the rest of the world. In the final quarter of 2023, inflation developments were unexpectedly favourable, which raised expectations that key interest rates would fall faster over the course of 2024 than previously expected. This confidence, combined with positive economic data from the United States and robust profitability, drove up stock market indices worldwide.**{#par-i9e164}
****For Germany's cross-border portfolio investment, these factors resulted in only low net capital exports of €1 billion in 2023, compared with €10½ billion in the previous year.** However, this figure masks a significant increase in cross-border purchases and sales of securities, marked by a lively trade in long-term debt securities.**{#par-a4ua63}
****German investors purchased €149½ billion in foreign securities, of which €131 billion was accounted for by debt securities.** Their main focus was on bonds (€122 billion), primarily from other euro area countries. The popularity of these longer-dated debt securities was due to their increased attractiveness in view of the comparatively high interest rates.[\[13\]](#_ftn_root_13) In addition, the Eurosystem no longer fully replaced maturing debt securities from its portfolio with newly acquired securities, and even discontinued these reinvestments altogether in July 2023.[\[14\]](#_ftn_root_14) Among others, commercial banks stepped in to replace the Eurosystem as holders of public debt instruments.[\[15\]](#_ftn_root_15) In addition, there were substantial new issuances of securities by the European Commission and some euro area countries. In keeping with this, German investors also made significant purchases of public bonds from the European Commission (€13½ billion), France (€9 billion) and Italy (€6 billion). Among non-European securities, government bonds were particularly in demand (€6½ billion). Debt securities with a maturity of up to one year were also purchased (for €9**½** billion net), but they saw less benefit from the high interest rates than long-dated securities. Demand for other assets was subdued. German investors placed only €23½ billion net in foreign mutual fund shares, while, for shares, sales actually outweighed purchases on balance (€5½ billion). This mainly affected equities from the United States and Ireland (€8½ billion each). Investors seem to have had disproportionately small bond holdings during the period of low interest rates and were now using rising yields to tilt their portfolios more towards interest-bearing securities.**{#par-u335oa}
{#par-u59ee9}
**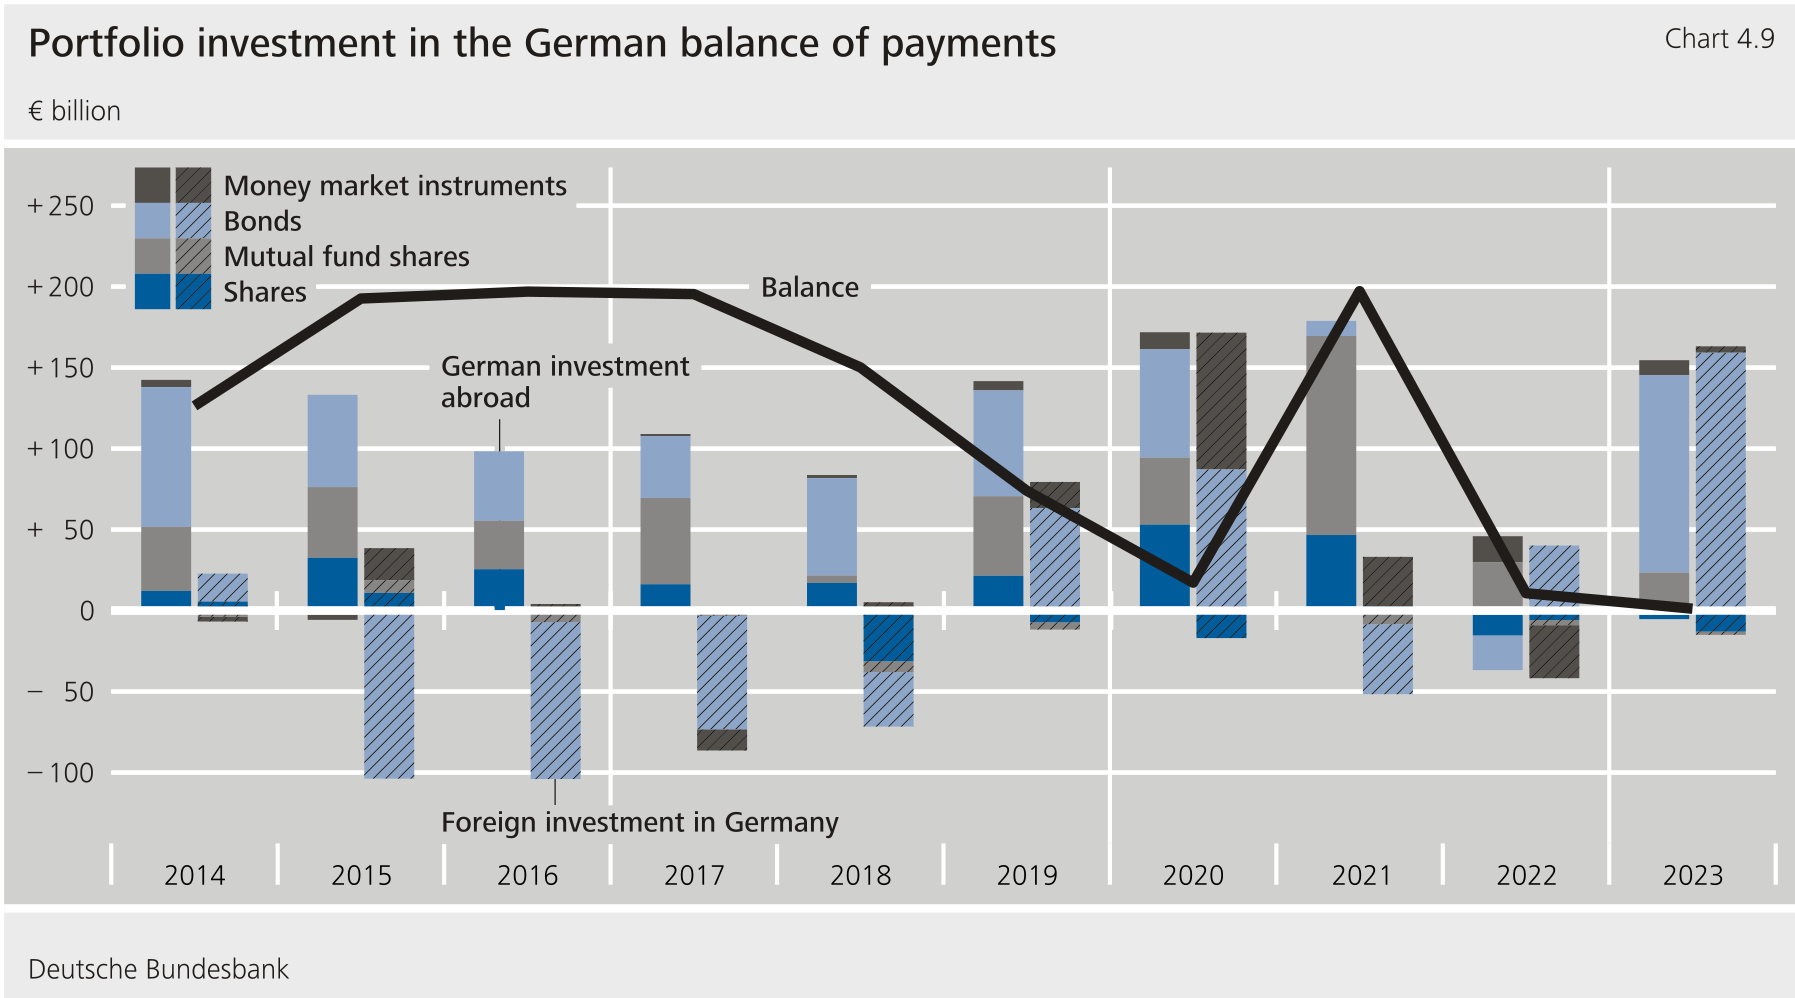**
****Conversely, foreign investors purchased German securities worth €148 billion net, likewise primarily debt securities.**Demand was greatest for public bonds (€120½ billion). This was more than the total net issuance of government bonds in 2023 (€82 billion). It appears that, with the phase of low interest rates coming to an end, there was substantial pent-up demand for German securities among international investors. Private bonds accounted for a further €39 billion, with demand for bank bonds, above all, starting in the middle of the year. The uncertainty surrounding the banking sector following the crisis affecting regional banks in the United States and the distress suffered by a major Swiss bank at the beginning of the year left no lasting mark in this area. However, the general interest in interest-bearing securities did not carry over to short-term securities. Net purchases of this instrument by foreign investors totalled a moderate €4 billion over the course of the year. For the most part, foreign investors shed German shares (€13 billion) and mutual fund shares (€2 billion) from their portfolios, shifting to net purchases of bonds -- this, too, was a mirror image of German market participants' behaviour.**{#par-e7o1uu}
****Financial derivatives (which are aggregated to form a single item in the balance of payments) recorded net capital exports of a similar size to the previous year** . They amounted to €40 billion, compared with €41½ billion in the previous 12-month period. Options trades were the main factor contributing to the outflow of funds. They account for just over one-half of the total balance of derivatives.[\[16\]](#_ftn_root_16) Forward transactions also remained relevant. Forward and futures contracts relating to gas, however, fell by just under one-half compared with 2022, when they had gained considerably in importance following the Russian attack on Ukraine in February of that year.**{#par-i62u2a}
{#par-ai435a}{#par-aa77ue}{#par-eeoe28}{#par-o4ei7u}{#par-iie3e9}{#par-oo4i75}{#par-aua3ui}{#par-o85355}{#par-a742e6}{#par-o739ae}{#par-i811u6}{#par-a62u9o}{#par-o88a63}{#par-a427o9}{#par-ia2962}{#par-u7eou4}{#par-o8o67a}{#par-ueaa11}{#par-eua495}{#par-o4346e}{#par-o45358}{#par-a2734u}{#par-eaiu17}{#par-o952e8}{#par-aao9o9}{#par-ie3116}{#par-oe1836}{#par-a7ua86}{#par-u2o415}
| **Table 4.4: Financial account** billion ||||
| Item | 2021^r^ | 2022^r^ | 2023^r^ |
| Financial account balance^1^ | + 209.0 | + 198.2 | + 232.6 |
| 1. Direct investment | + 81.5 | + 112.2 | + 59.7 |
| Domestic investment abroad^2^ | + 167.5 | + 170.3 | + 74.7 |
| Foreign investment in the reporting country^2^ | + 86.0 | + 58.1 | + 15.0 |
| 2. Portfolio investment | + 197.2 | + 10.7 | + 1.2 |
| Domestic investment in foreign securities^2^ | + 178.7 | + 9.2 | + 149.3 |
| Shares^3^ | + 46.7 | − 15.3 | − 5.3 |
| Investment fund shares^4^ | + 122.9 | + 29.7 | + 23.5 |
| Short-term debt securities^5^ | − 0.1 | + 16.2 | + 9.3 |
| Long-term debt securities^6^ | + 9.3 | − 21.4 | + 121.8 |
| Foreign investment in domestic securities^2^ | − 18.5 | − 1.6 | + 148.2 |
| Shares^3^ | + 2.6 | − 5.8 | − 13.0 |
| Investment fund shares | − 8.4 | − 3.2 | − 2.0 |
| Short-term debt securities^5^ | + 30.5 | − 32.7 | + 3.9 |
| Long-term debt securities^6^ | − 43.2 | + 40.2 | + 159.2 |
| 3 Financial derivatives^7^ | + 47.9 | + 41.5 | + 40.0 |
| 4. Other investment^8^ | − 149.5 | + 29.3 | + 130.9 |
| Monetary financial institutions^9^ | − 48.4 | − 93.5 | + 97.4 |
| Short-term | − 15.9 | − 125.9 | + 104.8 |
| Long-term | − 32.8 | + 32.3 | − 7.4 |
| Enterprises and households^10^ | + 6.1 | + 37.4 | + 60.2 |
| Short-term | + 14.8 | + 33.3 | + 68.7 |
| Long-term | − 27.3 | − 16.1 | − 15.7 |
| General government | − 3.8 | − 19.4 | + 7.3 |
| Short-term | − 5.1 | − 20.2 | + 3.2 |
| Long-term | + 1.3 | + 0.8 | + 3.9 |
| Bundesbank | − 103.4 | + 104.9 | − 34.1 |
| 5. Reserve assets | + 31.9 | + 4.4 | + 0.9 |
|--------------------------------------------------|---------|---------|---------|
{#par-u3927o}
### **2.3 Direct investment**
****In 2023, enterprises operating internationally were confronted with uncertainties and challenges, which dampened cross-border direct investment.** Although growth prospects developed differently in individual regions of the world, they were subdued in many countries. High inflation and rising interest rates across major currency areas shaped the economic environment. Geopolitical conflicts, sanctions and, in some cases, additional requirements[\[17\]](#_ftn_root_17) for cross-border business activities affected corporate decisions. In this environment, cross-border direct investment remained weak worldwide in 2023. According to initial preliminary data from the United Nations Conference on Trade and Development (), global direct investment increased by 3 % in 2023 compared with the previous year.[\[18\]](#_ftn_root_18) However, suggests that this growth was mainly driven by transactions in a few European countries (such as Luxembourg and the Netherlands), which often tend to hold a pass-through function for cross-border investment.[\[19\]](#_ftn_root_19) Excluding these transactions from the overall development, the reported global direct investment flows would be around 18 % lower in 2023 than in 2022. Countries in the European Union, excluding Luxembourg and the Netherlands, likewise recorded significantly lower direct investment inflows (by 23 %) than in 2022. According to data, foreign direct investment () in North America stagnated, whilst in other advanced economies and developing countries it was likewise down on the year in 2023. Preliminary data suggest that the volume of cross-border mergers and acquisitions worldwide remained significantly below the previous year's level. Furthermore, according to this source, there were fewer announcements about international project finance deals and greenfield investment activity in 2023.**{#par-e488ia}
****A similar picture was presented for cross-border investment projects by German enterprises operating internationally in 2023.** According to the German Chamber of Commerce and Industry (), the share of German industrial enterprises planning to invest abroad at the beginning of 2023 was noticeably lower than the average of the previous ten years.[\[20\]](#_ftn_root_20) In 2023, the cost savings motive for foreign investment had gained importance again. Overall, German enterprises had modest expectations with regard to economic activity abroad in 2023, with differences across locations.[\[21\]](#_ftn_root_21)**{#par-i393ua}
****In the difficult economic environment, cross-border** **flows to and from Germany led to net capital exports of €59½ billion in 2023.** German was significantly more subdued last year than in 2022. There was an even sharper decline in flows to Germany compared with the previous year. Direct investment is generally longer-term in nature.[\[22\]](#_ftn_root_22) On the one hand, in a rapidly changing economic environment, it provides enterprises with an important tool to adapt to change. On the other hand, direct investment also poses particular challenges for enterprises, as management cannot easily change decisions at a later point, or at least not without considerable costs.[\[23\]](#_ftn_root_23)**{#par-u91ieo}
****German** **amounted to €74½ billion in 2023, which was down noticeably on the previous year.** In 2022, German amounted to €170**½** billion, which was quite high in historical terms. In the past year, equity investments accounted for almost 85 % of German direct investment (€62**½** billion) on balance, with the majority of this figure taking the form of reinvested earnings (€46 billion). This meant that reinvested earnings again played a greater role last year than equity capital in the narrower sense, which is determined as the balance of new investment and liquidation in direct investment. Cross-border corporate takeovers by firms based in Germany played a significant role in 2023. Despite the subdued global trend in this area, corporate takeovers by German enterprises were up significantly in a year-on-year comparison and in terms of volume, while the number of transactions declined somewhat.[\[24\]](#_ftn_root_24) German-based firms provided affiliated enterprises abroad with €12 billion via intra-group lending. Financial loans were provided both to subsidiaries and affiliates abroad and from subsidiaries domiciled in Germany to their foreign parent companies. By contrast, intra-group trade credits to affiliated enterprises abroad were mainly redeemed.**{#par-a1u452}
****Europe was by far the most popular destination for German direct investment last year.** Of the €74**½** billion net invested in affiliates abroad, around two-thirds flowed into other countries within the European Union. Luxembourg, which is an important holding company location, attracted particularly large amounts (€13**½** billion). Enterprises domiciled in Germany also sharply stepped up their direct investment in France (€7 billion), Belgium (€5**½** billion) and Austria, Spain and Denmark (€5 billion each). Among European countries outside the European Union, the United Kingdom was once again an important destination for intra-group funding (€19 billion). Lending dominated, but firms domiciled in Germany also stepped up their equity capital in affiliated enterprises in the United Kingdom.**{#par-ooie79}
****In 2023, direct investment outside Europe was strongly affected by fund flows moving in opposite directions.** In the case of China and the United States, this was not in line with assessments of the economic outlook in the two countries: in China, German-based enterprises engaged in relatively large (€6**½** billion) last year. Reinvestment of earnings generated there played a key role. By contrast, direct investment relationships with the United States saw larger return flows of funds to Germany (€18 billion). However, this sharp decline in direct investment in the United States last year does not reflect the assessment of German enterprises operating there of their business prospects in the country. This was quite positive and also more favourable than in some other regions.[\[25\]](#_ftn_root_25) By contrast, direct investment in China increased even though the macroeconomic outlook there is more muted.[\[26\]](#_ftn_root_26) The change in sentiment could therefore also be reflected in direct investment actually recorded in the next few years.**{#par-u4ae99}
{#par-ea7ooa}
**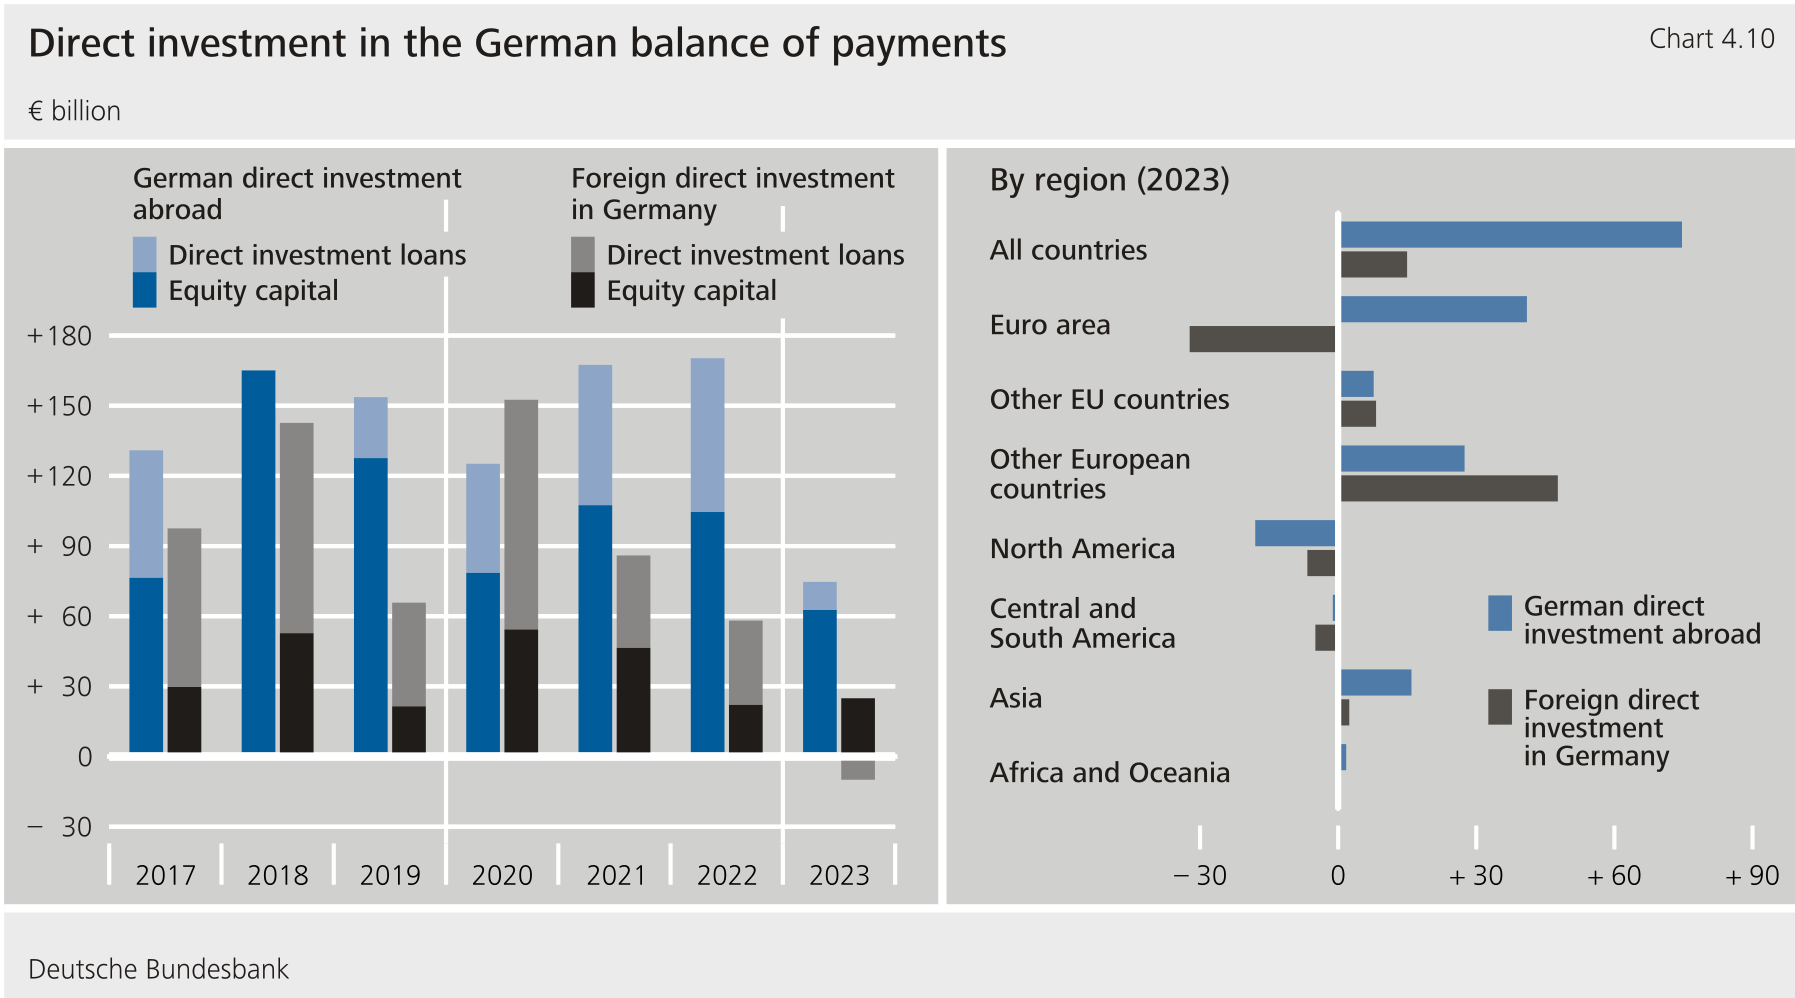**
****Foreign enterprises provided affiliated enterprises in Germany with funds totalling €15 billion net last year, which was only around one-quarter of the amount recorded in the previous year (€58 billion).** Inward into Germany thus declined for the third year in succession. It is not yet possible to pinpoint the extent to which this development reflects more recent cyclical influences or also longer-term structural factors relating to Germany as a business location.[\[27\]](#_ftn_root_27) As described above, data for many regions and countries indicated global restraint last year, as is likely to have also been reflected in inward into Germany. In the ten years between 2013 and 2022, in Germany totalled €78 billion on an annual average and only once was below the 2023 figure -- €14 billion in 2014. At that time, the decline was largely influenced by the transaction of a foreign enterprise which had withdrawn large amounts of intra-group lending. By contrast, in 2023 it was not possible to discern any single transaction which dominated the result.**{#par-u4e27o}
****By augmenting their equity capital, foreign enterprises provided affiliated companies in Germany with €25 billion, predominantly through equity capital in the narrower sense.** With regard to credit transactions, redemptions outweighed, on balance, the granting of new loans (€10 billion). In particular, domestic parent companies redeemed financial loans they had previously received from foreign subsidiaries. By contrast, domestic subsidiaries and affiliates received additional funds from abroad through intra-group lending and, in turn, redeemed some of their existing long-term financial loans. Cross-border trade credits were also dominated by repayments.**{#par-a6ouo3}
****In particular, enterprises domiciled in other European countries provided direct investment funds to German firms last year.** Affiliated enterprises from the United Kingdom made particularly substantial direct investments (€38**½** billion), mainly via intra-group credit transactions. Belgium (€7 billion), Switzerland (€6 billion), Sweden (€4 billion) and France (€3 billion) were also the sources of larger inflows to Germany. However, return flows of funds predominated in the euro area countries (€32**½** billion), mainly due to the cross-border repayment of previously drawn loans. The Netherlands (€29**½** billion) and Ireland (€10 billion) observed particularly significant return flows. Outside Europe, particularly the United States recorded higher return flows of funds (€7½ billion). The fact that German-based enterprises redeemed loans previously granted by affiliated enterprises had a bearing here, too.**{#par-u858au}
### **2.4 Other investment**
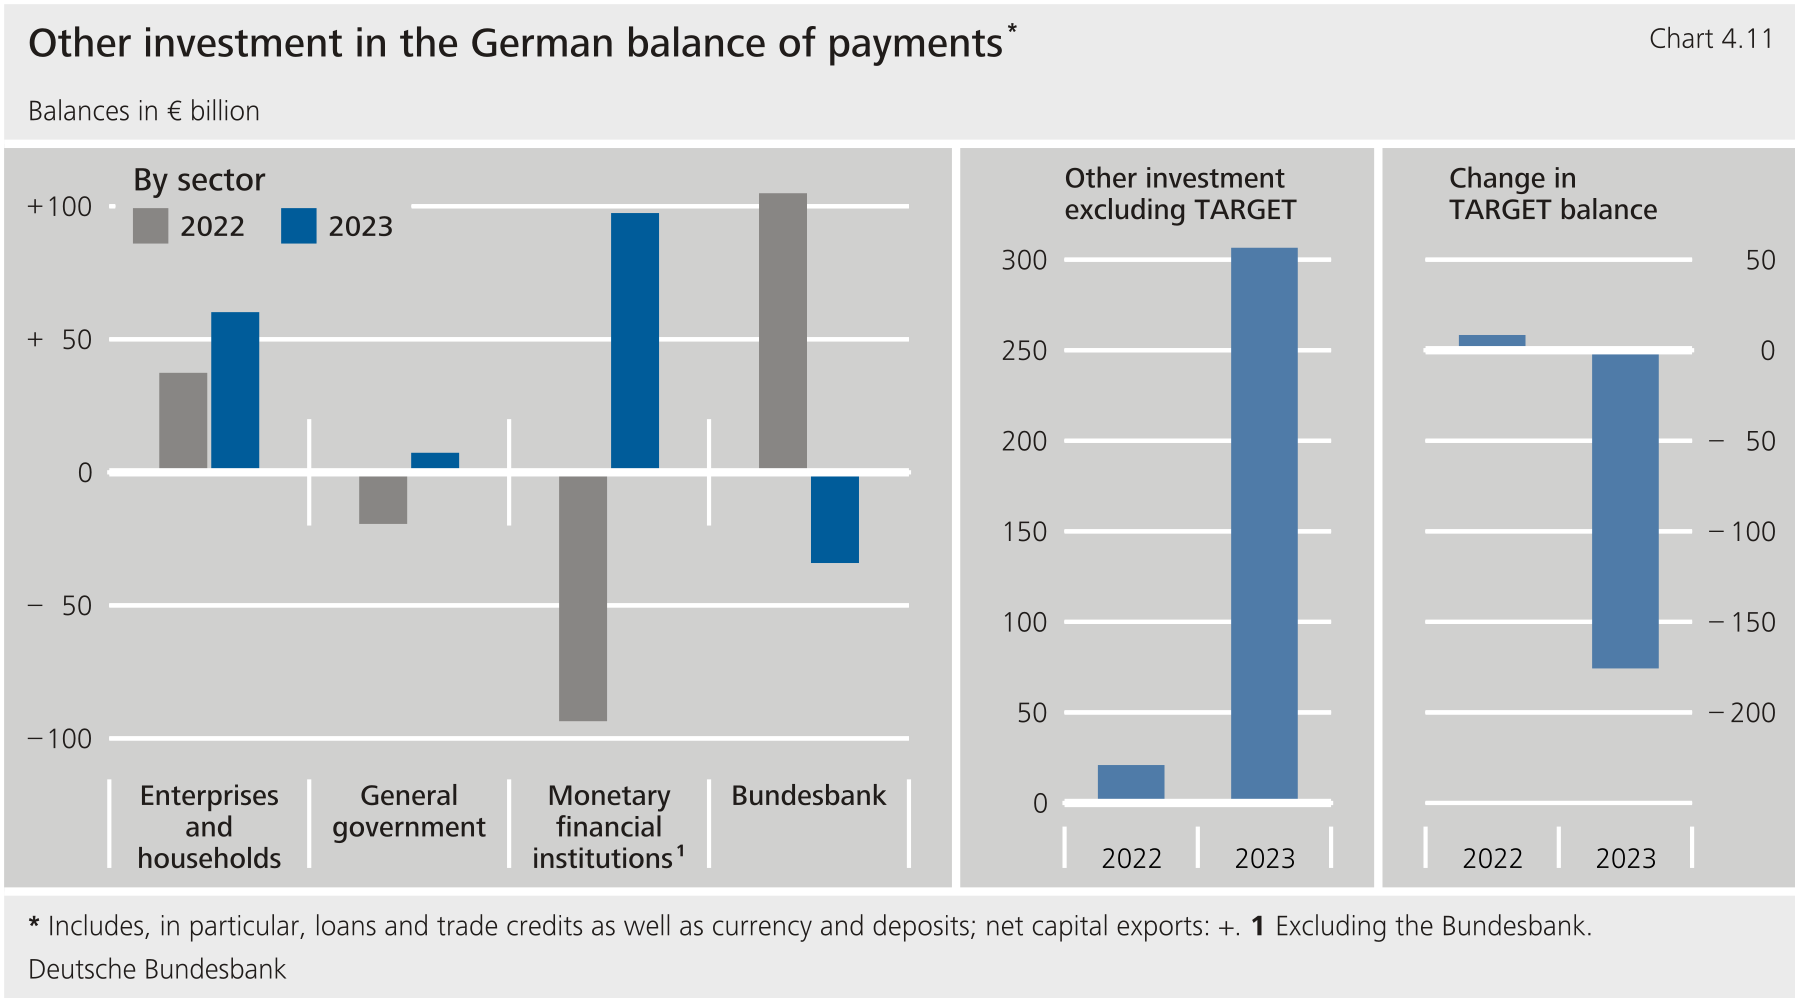
****Other investment recorded net capital exports of €131 billion in 2023.** It comprises loans and trade credits (where these do not constitute direct investment) as well as bank deposits and other investment. In 2022, other investment had given rise to net capital exports of €29**½** billion. The balances of other investment often see volatility -- including changes in sign. Last year, the higher net capital exports were due to a sharp decline in external liabilities of €135½ billion, while claims decreased by €5 billion.**{#par-e3452a}
****Transactions via the accounts of monetary financial institutions (excluding the Bundesbank) and by enterprises and households, as well as government, led to net capital exports last year.** Net capital exports via the accounts of monetary financial institutions (excluding the Bundesbank) amounted to €97½ billion. Claims arising from cash and deposits as well as from loans were up on the previous year. In the opposite direction, foreign institutions reduced deposits with German institutions, with group-affiliated institutions, in particular, scaling back their cross-border deposits in Germany. This might reflect a decline in excess liquidity within the euro area. In 2023, the cross-border activities of enterprises and households in other investment (€60 billion) likewise resulted in net capital exports. They significantly expanded their claims against foreign institutions arising from cash and deposits, while their liabilities to non-residents arising from loans also increased. Transactions by general government resulted in net external claims of €7½ billion in 2023.**{#par-a5i37o}
****By contrast, Bundesbank accounts recorded net capital imports of €34 billion.** The Bundesbank's claims fell significantly in 2023, mainly as a result of the decline in claims by €175½ billion. This was due, among other things, to the fact that maturing securities from the portfolio were no longer being reinvested in full. Reinvestments under the have been discontinued altogether since July 2023. It was therefore investors based outside the issuing country who invested more heavily in new issuance of national and supranational bonds from issuers located in the euro area (see Chapter 2.2 Portfolio investment). Germany's balance is reduced if these purchases are settled in Frankfurt. The purchase phase in which claims were built up mirrored this development.[\[28\]](#_ftn_root_28) The Bundesbank's liabilities also fell on the year, mainly as a result of lower deposits from counterparties domiciled outside of the euro area. Although these deposits rose at the end of the year -- as has often been the case in recent years -- they declined overall over the course of the year. The Bundesbank's liabilities arising from the allocation of euro banknotes within the Eurosystem went up by €25 billion compared with 2022.**{#par-ea8675}
{#par-ia944u}
****
### **2.5 Reserve assets**
****The Bundesbank's reserve assets rose by €1 billion in 2023 on account of transactions.** On balance, this was mainly due to an increase in special drawing rights, which were exchanged for euro.**{#par-i18a7a}
****The international reserve holdings are also influenced by balance sheet adjustments which, in compliance with internationally agreed accounting standards, are not recognised in the balance of payments.** The end-of-year revaluation of the reserve assets resulted in an increase of around €15 billion in 2023. This was due to an increase in gold prices compared to the previous year, whilst other non-transaction-related changes, including exchange rate effects, had a dampening impact. On the reporting date of 31 December 2023, the value of Germany's reserve assets stood at €292½ billion.**{#par-ee2641}
**3 List of references** {#tar-5}
---------------------------------
* **Allen, C., C. Casas, G. Ganelli, L. Juvenal, D. Leigh, P. Rabanal, C. Rebillard, J. Rodriguez and J. T. Jalles (2023), 2022 Update of the External Balance Assessment Methodology, Working Paper, No 23/47.**
* **Baier, S. L. and J. H. Bergstrand (2004), Economic determinants of free trade agreements, Journal of International Economics, Vol. 64 (1), pp. 29--63.**
* **Baier, S. L., Y. V. Yotov and T. Zylkin (2019), On the Widely Differing Effects of Free Trade Agreements: Lessons from Twenty Years of Trade Integration, Journal of International Economics, Vol. 116, pp. 206--226.**
* **Borusyak, K., X. Jaravel and J. Spiess (2024), Revisiting Event Study Designs: Robust and Efficient Estimation, Review of Economic Studies, forthcoming.**
* **Breinlich, H., V. Corradi, N. Rocha, M. Ruta, T. Zylkin and J. S. Silva (2022), Machine Learning in International Trade Research -- Evaluating the impact of Trade Agreements, Discussion Paper No 17325.**
* **Callaway, B. and P. H. C. Sant'Anna (2021), Difference-in-Differences with multiple time periods, Journal of Econometrics, Vol. 225 (2), pp. 200--230.**
* **Cubeddu, L., S. Krogstrup, G. Adler, P. Rabanal, M. C. Dao, S. Ahmed Hannan, L. Juvenal, N. Li, C. O. Buitron, C. Rebillard, D. Garcia-Macia, C. Jones, J. Rodriguez, K. S. Chang, D. Gautam and Z. Wang (2019), The External Balance Assessment Methodology: 2018 Update, Working Paper, No 19/65.**
* **Dao, M.C. (2020), Wealth inequality and private savings: The case of Germany, Working Paper No 2020/107.**
* **de Chaisemartin, C. and X. D'Haultfœuille (2023), Two-way fixed effects and differences-in-differences with heterogeneous treatment effects: A survey, The Econometrics Journal, Vol. 26 (3), pp. C1-.**
* **de Chaisemartin, C. and X. D'Haultfoeuille (2022), Difference-in-Differences Estimators of Intertemporal Treatment Effects, Working Paper No 29873.**
* **de Chaisemartin, C. and X. D'Haultfœuille (2020), Two-Way Fixed Effects Estimators with Heterogeneous Treatment Effects, American Economic Review, Vol. 110 (9), pp. 2964‑2996.**
* **Deutsche Bundesbank (2024), Risks facing Germany as a result of its economic ties with China, Monthly Report, January 2024, pp. 11‑29.**
* **Deutsche Bundesbank (2023a), Germany as a business location: selected aspects of current dependencies and medium-term challenges, Monthly Report, September 2023, pp. 15‑35.**
* **Deutsche Bundesbank (2023b), Adjustments to the international supply chains of German firms and impact on their production costs, Monthly Report, December 2023, pp. 64‑66.**
* **Deutsche Bundesbank (2023c), A new estimation method for the productivity approach, Monthly Report, October 2023, pp. 31‑34.**
* **Deutsche Bundesbank (2022), German balance of payments in 2021, Monthly Report, March 2022, pp. 37‑57.**
* **Deutsche Bundesbank (2021), German balance of payments in 2020, Monthly Report, March 2021, p. 32.**
* **Deutsche Bundesbank (2017a), The market for corporate bonds in the low-interest-rate environment, Monthly Report, July 2017, pp. 17‑32.**
* **Deutsche Bundesbank (2017b), balances -- mirroring developments in financial markets, Monthly Report, December 2017, pp. 75‑76.**
* **Egger, P. H., M. Larch and Y. V. Yotov (2022), Gravity Estimations with Interval Data: Revisiting the Impact of Free Trade Agreements, Economica, Vol. 89 (353), pp. 44--61.**
* **European Central Bank (2023a), Monetary policy decisions, press release of 2 February 2023.**
* **European Central Bank (2023b), Monetary policy decisions, press release of 4 May 2023.**
* **European Central Bank (2022), Monetary policy decisions, press release of 9 June 2022.**
* **European Central Bank (2021), Monetary policy decisions, press release of 16 December 2021.**
* **Federal Government (2024), [The arms and military equipment Germany is sending to Ukraine](https://www.bundesregierung.de/breg-en/news/military-support-ukraine-2054992), accessed on 16 January 2024.**
* **Fischer, C. (2019), Equilibrium real exchange rate estimates across time and space, Deutsche Bundesbank Discussion Paper No 14/2019.**
* **Fontagné, L. and G. Santoni (2021), and the endogenous geography of , European Economic Review, Vol. 132, 103656.**
* **German Association of Energy and Water Industries (2023), Die Energieversorgung 2023 -- Jahresbericht, 18 December 2023.**
* **German Chamber of Commerce and Industry (2023a), Foreign Investment of German Industry 2023 -- Special Report of the Economic Survey, March 2023.**
* **German Chamber of Commerce and Industry (2023b), Going International 2023, Experiences and prospects of German business in foreign business -- results of a company survey, March 2023.**
* **German Chamber of Commerce and Industry (2023c), World Business Outlook Fall 2023, Results of a survey of German chambers abroad, delegations and representative offices, November 2023.**
* **International Monetary Fund (2018), 2018 External Sector Report -- Refinements to the External Balance Assessment Methodology -- Technical Supplement.**
* **Larch, M. and Y. V. Yotov (2023), Estimating the Effects of Trade Agreements: Lessons From 60 Years of Methods and Data, School of Economics Working Paper Series 2023‑4, LeBow College of Business, Drexel University.**
* **Moser, C. and A. K. Rose (2012), Why Do Trade Negotiations Take So Long? Journal of Economic Integration, Vol. 27 (2), pp. 280‑290.**
* **Nagengast, A. J. and Y. V. Yotov (2024), Staggered difference-in-differences in gravity settings: Revisiting the effects of trade agreements, American Economic Journal: Applied Economics, forthcoming.**
* **Osnago, A., N. Rocha and M. Ruta (2019), Deep trade agreements and vertical : The devil is in the details, Canadian Journal of Economics, Vol. 52 (4), pp. 1558--1599.**
* **Roth, J., P. H. C. Sant'Anna, A. Bilinski and J. Poe (2023), What's trending in difference-in-differences? A synthesis of the recent econometrics literature, Journal of Econometrics, Vol. 235 (2), pp. 2218--2244.**
* **Shahn, Z. (2023), Subgroup difference in differences to identify effect modification without a control group, Technical report, arXiv preprint arXiv: 2306.11030.**
* **Sun, L. and S. Abraham (2021), Estimating dynamic treatment effects in event studies with heterogeneous treatment effects, Journal of Econometrics, Vol. 225 (2), pp. 175--199.**
* **Teti, F. (2020), 30 Years of Trade Policy: Evidence from 5.7 Billion Tariffs, Working Paper No 334, Institute -- Leibniz Institute for Economic Research at the University of Munich.**
* **United Nations Conference on Trade and Development (2024), Global Investment Trends Monitor, No 46, January 2024.**
* **Wooldridge, J. M. (2023), Simple approaches to nonlinear difference-in-differences with panel data, The Econometrics Journal, Vol. 26(3), pp. .**
* **Wooldridge, J. M. (2021), [Two-Way Fixed Effects, the Two-Way Mundlak Regression, and Difference-in-Differences Estimators](https://papers.ssrn.com/sol3/papers.cfm?abstract_id=3906345), Working Paper.**
* **Working Group on Energy Balances (2023): Energieverbrauch ist 2023 kräftig gesunken, Press Service, 20 December 2023.**
{#par-ee32u9}
{#par-u8u4u9}
1. **{#_ftn_root_1} The balance of payments data on which the article is based were published on 14 March 2024 and contain external trade data from the Federal Statistical Office published on 14 February 2024. Taking into account the Federal Statistical Office's provisional foreign trade data from 18 March 2024, foreign trade in 2023 developed somewhat more favourably: exports remained virtually unchanged on an annual average in price-adjusted terms, and imports fell by only 1 %. Foreign trade price indices based to 2015 were used to adjust foreign trade prices.**
2. **{#_ftn_root_2} These include military goods, dual-use goods, and relief supplies totalling €5.4 billion; see Federal Government (2024). However, with a share of only 0.4 %, the importance of exports to Ukraine for the German economy as a whole remained very small.**
3. **{#_ftn_root_3} Gas exports consist largely of the pass-through of gas imports.**
4. **{#_ftn_root_4} This was due to a statistical carry-over effect from 2022.**
5. **{#_ftn_root_5} This was also due to a very expansionary temporary special effect concerning chemicals imports (lactames, an input used in the production of pharmaceuticals and plastics) in the previous year, which then abated again to a large extent.**
6. **{#_ftn_root_6} For more on energy consumption developments, see the Working Group on Energy Balances (2023).**
7. **{#_ftn_root_7} According to Working Group on Energy Balances (2023), consumers' energy saving played a key role in the reduction in natural gas consumption in Germany.**
8. **{#_ftn_root_8} The increase in (net) electricity imports is likely to have been caused in part by the fact that domestic electricity production fell more sharply than consumption. One factor here, in turn, was that it was cheaper to import electricity than to generate it in Germany using fossil fuels, partly because the remaining three nuclear power plants in Germany had been shut down in April 2023, and that more nuclear power was available in France than in the previous year. See German Association of Energy and Water Industries (2023).**
9. **{#_ftn_root_9} The decisive factor here was the shift in supplementary trade items to net expenditure of €14 billion from net receipts of €9½ billion in the previous year. The sharp decline in imports for contract manufacturing in Germany was a considerable factor. In addition, the c.i.f. charges for imports, amongst other things, declined; these comprise the costs of freight and insurance from the border of the supplier's country to the German border. Moreover, net receipts from merchanting fell by €7 billion. This decline was associated in equal measure with lower revenue and higher expenditure. This was only partly offset by the fact that net expenditure on trade in non-monetary gold, amounting to €8 billion in the previous year, shifted to net revenue of €2½ billion.**
10. **{#_ftn_root_10} However, this only applies to cryptocurrencies which do not give rise to a liability of a counterparty. These are classified as financial instruments and recorded as capital movements in the financial account.**
11. **{#_ftn_root_11} See Deutsche Bundesbank (2022).**
12. **{#_ftn_root_12} In the current landscape of structural excess liquidity in the euro area, the deposit facility rate is the key lever in monetary policy steering.**
13. **{#_ftn_root_13} Around 87 % of these purchases were made in the first half of the year, when interest rates rose sharply.**
14. **{#_ftn_root_14} See European Central Bank (2023a, 2023b). Net purchases under the had been discontinued with effect from 1 July 2022. See European Central Bank (2022). Net asset purchases under the Pandemic Emergency Purchase Programme () had already been discontinued at the end of March 2022. See European Central Bank (2021).**
15. **{#_ftn_root_15} As a consequence, domestic and foreign government debt securities could increasingly be held on the balance sheets of private credit institutions again in future. This applies not just to Germany, but also to other euro area countries.**
16. **{#_ftn_root_16} This was mainly due to compensatory intra-group transactions in the form of over-the-counter options for transactions in structured short and long-term debt securities from German issuers. See Deutsche Bundesbank (2021).**
17. **{#_ftn_root_17} These include, for example, local content requirements for parts of the value added or local certification regulations.**
18. **{#_ftn_root_18} See United Nations Conference on Trade and Development (2024).**
19. **{#_ftn_root_19} This is due to the activities of corporations located there and specialised in the pass-through of funds.**
20. **{#_ftn_root_20} See German Chamber of Commerce and Industry (2023a).**
21. **{#_ftn_root_21} See German Chamber of Commerce and Industry (2023b, 2023c).**
22. **{#_ftn_root_22} Adjustments are therefore more likely to take place over the longer term. Nevertheless, shorter-term arrangements between affiliated enterprises also affect cross-border direct investment flows. For example, this may be the case when an entity in one country provides certain cross-border financial services to entities in other countries.**
23. **{#_ftn_root_23} See Deutsche Bundesbank (2023a) and German Chamber of Commerce and Industry (2023c).**
24. **{#_ftn_root_24} Takeovers of firms domiciled abroad and previously under foreign ownership -- and a German stake of at least 10 % after the transaction -- accounted for around €24 billion in 2023; this was significantly more than in 2022, when the value of the takeovers was reported at around €12½ billion (data based on Workspace, data extracted as at 23 February 2024). The time at which mergers and acquisitions are captured in the balance of payments can, however, differ from that recorded by Workspace, meaning that the reported figures are not directly comparable.**
25. **{#_ftn_root_25} See German Chamber of Commerce and Industry (2023c).**
26. **{#_ftn_root_26} See Deutsche Bundesbank (2024).**
27. **{#_ftn_root_27} See, for example, Deutsche Bundesbank (2023a).**
28. **{#_ftn_root_28} See Deutsche Bundesbank (2017b).**
29. **{#_ftn_root_29} This analysis is based on a research paper by Nagengast and Yotov (2024).**
30. **{#_ftn_root_30} See Deutsche Bundesbank (2016).**
31. **{#_ftn_root_31} See Deutsche Bundesbank (2023a).**
32. **{#_ftn_root_32}2024).**
33. **{#_ftn_root_33} See **
34. **{#_ftn_root_34} See Baier et al. (2019) and Larch and Yotov (2023).**
35. **{#_ftn_root_35} See Baier et al. (2019).**
36. **{#_ftn_root_36} This stems from what are known as "forbidden comparisons". In this case, a comparison is being made with earlier episodes in which similar policy measures already yielded results -- instead of with a situation in which no measures were taken whatsoever. As a result, the estimator corresponds to a weighted average of the actual treatment effects. It can thus be biased either upwards or downwards. The weights can even be negative. The overall effects estimator is therefore not guaranteed to have the same sign as the individual treatment effects. See Borusyak et al. (2024).**
37. **{#_ftn_root_37} See de Chaisemartin and D'Haultfœuille (2020), Callaway and Sant'Anna (2021), Sun and Abraham (2021), Wooldridge (2021), and Borusyak et al. (2024). A comprehensive overview of the literature can be found in de Chaisemartin and D'Haultfœuille (2023) and Roth et al. (2023).**
38. **{#_ftn_root_38} For a more detailed description of the estimation approach and other results, see Nagengast and Yotov (2024). The analysis is based on trade data including domestic trade from the Structural Gravity Database of the World Trade Organization for the 1980‑2016 period, as well as data on free trade agreements from the Dynamic Gravity Dataset of the United States International Trade Commission. See Larch et al. (2019) and Gurevich and Herman (2018). encompass all bilateral trade agreements, such as free trade agreements, currency unions and economic integration agreements. This analysis assumes an "onset" of three years before their actual entry into force. This is because, when an is announced, which is usually several years before it is actually implemented, a number of trade barriers begin to fall and/or some economic agents begin to adjust their behaviour in anticipation of the agreement. See Moser and Rose (2012) and Egger et al. (2022).**
39. **{#_ftn_root_39} The new estimator takes into account varying effects at the cohort-year level and thus excludes "forbidden comparisons" with pairs of countries in which policy measures have already yielded results. The characteristics of gravity models are taken into account through the use of the non-linear Poisson pseudo maximum likelihood () estimator and the fixed effects structure that is standard in the literature.**
40. **{#_ftn_root_40} A calculation of the implied weights of the conventional estimator using the method presented in de Chaisemartin and D'Haultfœuille (2020) suggests that it is biased downward compared to the new estimator since it puts larger weights on short-run effects and the effects of recent agreements, both of which tend to be smaller.**
41. **{#_ftn_root_41} For details, see Nagengast and Yotov (2024).**
42. **{#_ftn_root_42} We reach this finding even though have become deeper and more comprehensive over time. Empirical results for this analysis show that deeper trade agreements lead to more trade than shallower trade agreements (see, inter alia, Osnago et al. (2019) and Larch and Yotov (2023)). However, this effect is overshadowed by other factors that lead to trade agreements having a smaller impact over time.**
43. **{#_ftn_root_43} See Baier and Bergstrand (2004) and Fontagné and Santoni (2021).**
44. **{#_ftn_root_44} See Teti (2020).**
45. **{#_ftn_root_45} To this end, the differences in the impact of trade agreements are first explained using bilateral determinants -- such as geographical distance, common language, colonial ties and tariffs -- as well as country-specific determinants such as market size (see, inter alia, de Chaisemartin and D'Haultfoeuille (2022), Shahn (2023) and Baier et al. (2019)). These results are then used in a partial model framework to calculate the counterfactual scenario in a back-of-the-envelope manner. It should be noted, however, that the counterfactual scenario does not take into account general equilibrium effects such as trade diversion. These probably to tend to weaken the partial equilibrium results.**
46. **{#_ftn_root_46} For an analysis of the effectiveness of individual provisions in trade agreements, see, inter alia, Breinlich et al. (2022).**
47. **{#_ftn_root_47} For a detailed description of the method, see Deutsche Bundesbank (2023c) and Fischer (2019).**
48. **{#_ftn_root_48}(2019); International Monetary Fund (2018).**
49. **{#_ftn_root_49} For example, the takes account of, inter alia, the relevance of capital controls, which are only of secondary importance for advanced economies.**
50. **{#_ftn_root_50} Calculated on the basis of the data available for a larger group of 56 countries.**
51. **{#_ftn_root_51} The bulk of the data originates from the 's database; lending to the private sector is taken from the 's International Financial Statistics, the international investment position from the 's Balance of Payments Statistics, population data by age group and life expectancy at birth from the United Nations World Population Prospects, data on the export and import of energy sources are taken from the International Energy Agency, the share of the top 10 % of national income from the World Inequality Database, the current account balance for Germany is calculated by the Bundesbank, Germany's is calculated by the Federal Statistical Office.**
52. **{#_ftn_root_52} However, because the estimation uses current account balances in relation to and the sample does not cover every country, the variable's annual average is different from zero. Time-specific fixed effects take this fact into account in the panel estimation.**
53. **{#_ftn_root_53} Data on the utilisation rate for all countries are taken from the International Monetary Fund's database.**
54. **{#_ftn_root_54} As financing via the capital market became increasingly important for enterprises during the period of low interest rates, this may also affect the "lending to the private sector" variable. See Deutsche Bundesbank (2017a).**
55. **{#_ftn_root_55}See Dao, M.C. (2020).**
56. **{#_ftn_root_56} The average life expectancy at birth of people aged between 45 and 50 is used here. Although the remaining life expectancy of primary savers would be preferable from a methodological viewpoint, it is not available for all countries.**
57. **{#_ftn_root_57} For detailed information on the methodology used, see: Deutsche Bundesbank (2023c) and Fischer (2019).**
58. **{#_ftn_root_58} and**
59. **{#_ftn_root_59} being identical, the estimation is equivalent to a conventional random effects estimation. This can be verified using a Hausmann test and was rejected in the present case.**
60. **{#_ftn_root_60} All variables discussed here are statistically significant at a level of at least 5 %.**
*[TARGET]: Trans-European Automated Real-time Gross Settlement Express Transfer System
*[WEO]: World Economic Outlook
*[APP]: asset purchase programme
*[AHK]: Deutsch-Türkische Außenhandelskammer
*[NBER]: National Bureau of Economic Research
*[FDI]: Financial Direct Investment
*[LSEG]: London Stock Exchange Group
*[COVID]: coronavirus disease
*[PEPP]: pandemic emergency purchase programme
*[GDP]: gross domestic product
*[OPEC]: Organization of the Petroleum Exporting Countries
*[TARGET2]: Trans-European Automated Real-time Gross Settlement Express Transfer System 2
*[UNCTAD]: United Nations Trade and Development
*[US]: United States
*[GVCs]: global value chains
*[**FDI**]: Financial Direct Investment
*[IMF]: International Monetary Fund
*[e. V.]: registered association
*[Fed]: Federal Reserve System
*[ECB]: European Central Bank
*[DIHK]: Deutsche Industrie- und Handelskammer
*[**GDP**]: gross domestic product
*[EU]: European Union
*[**CRE**]: correlated random effects
*[RTAs]: regional trade agreement
*[ifo]: Institut für Wirtschaftsforschung
*[**RTAs**]: regional trade agreement
*[CRE]: correlated random effects
*[**IMF**]: International Monetary Fund
*[PPML]: Poisson pseudo-maximum likelihood
*[RTA]: regional trade agreement