# The performance of German credit institutions in 2023
*German credit institutions' performance improved significantly in 2023.* *At €48.7 billion, aggregate profit for the financial year before tax was almost 80% higher than the previous year's figure. All of the categories of banks considered posted higher profits for the 2023 financial year than they had done in 2022. In a long-term comparison, the aggregate profit for the financial year before tax reached its highest level since the start of the reporting period for the profit and loss statistics in 1999.*{#par-uuu635}
*This development was driven by a significant increase in net interest income, which rose by 16.7% compared with the previous year, in particular as a result of the Eurosystem's key interest rate hikes, and reached its highest level in absolute terms (€106.9 billion) in 25 years. This widened the interest margin of German banks considerably, although -- at 1.00% in 2023 -- it remained below its long-term average of 1.09%. In addition, the trading result (+18.4%) and other operating result (+359.7%) showed strong increases. In absolute terms they remain of minor significance, though. Net commission income for 2023 was around the same level as the two previous years and so did not contribute to the increase in profit for the financial year.*{#par-i3eu94}
*Net valuation charges sank by slightly over one-third in the reporting year, to €10.3 billion. Unlike in the previous year, they thus amounted to well below the long-term average. In 2023, write-downs on fixed-income securities, in particular, were much lower than they had been in the preceding year. In addition, German credit institutions started to see reversals of impairment losses on securities which had been written down in the previous year due to the higher interest rate level.*{#par-eiaoe1}
*Measured by the return on assets and the cost/income ratio, the profitability as well as the cost efficiency of German banks improved considerably. At 0.46%, the return on assets reached a 25-year high in the year under review. The sharp rise in operating income resulted in the lowest cost/income ratio in 25 years, at 59.2%, even though administrative spending increased (+2.4%).*{#par-u9a554}
*However, factors that act as a drag on earnings are likely to gain in significance for German banks in the current year. In the face of geopolitical risks and persistent uncertainty about macroeconomic developments, the underlying economic conditions remain challenging. With new lending still subdued and sight deposits being shifted into better-remunerated time deposits, it is to be expected that the effects on net interest income will tend to be negative overall. In addition, further increases in counterparty credit risk render higher write-downs for non-performing loans more likely.*{#par-u1569i}
1 Business environment and structural developments in the German banking sector
-------------------------------------------------------------------------------
The year 2023 found German institutions operating in a difficult macroeconomic environment. The German economy was predominantly weighed down by the economic repercussions of Russia's war against Ukraine, especially the sharp rise in energy costs, and anaemic global trade. Increased financing costs stemming from the Eurosystem's continued monetary policy tightening acted as an additional drag on economic activity. In addition, March 2023 saw a number of regional banks and one Swiss big bank experience turbulence, though this did not ultimately exert any lasting impact on German banks.[\[1\]](#_ftn_root_1) All in all, the German financial system proved stable in the macro-financial environment of 2023.[\[2\]](#_ftn_root_2){#par-ia5o7i}
### 1.1 Macroeconomic setting
**Price and calendar-adjusted gross domestic product fell slightly by 0.1% on the year in 2023.** Although large order backlogs in industry and construction and easing supply bottlenecks had a bolstering effect, weak domestic and foreign demand and the after-effects of the sharp rise in energy costs weighed on industry. Averaging 6% in 2023, inflation as measured by the Harmonised Index of Consumer Prices was lower than it had been in the previous year (2022: 8.7%). Nevertheless, it continued to hold back private consumption, despite higher wages and a robust labour market.[\[3\]](#_ftn_root_3) As pandemic-related expenditure tapered off, government consumption also declined. In addition, increased financing costs dampened private investment, especially in housing construction.{#par-i496au}
**In response to high inflation rates, the Eurosystem continued tightening monetary policy in 2023.** Key interest rates were raised six times in a row in the year under review, with the interest rate steps being reduced from 50 basis points to 25 basis points as the year progressed. Taken together, these increases constituted the biggest hike in key interest rates in the history of the Eurosystem. In September 2023, the interest rate on the deposit facility, which is of relevance for monetary policy, reached its peak at 4%. Furthermore, reinvestments of principal payments from maturing securities purchased under the asset purchase programme () were initially scaled back and were then discontinued altogether in June 2023.[\[4\]](#_ftn_root_4){#par-a1au83}
**A number of** **regional banks and one Swiss big bank were beset by trouble in the year under review, though the turmoil did not leave lasting adverse effects on international financial markets.** It began with Silicon Valley Bank's collapse in March 2023, after interest rate risk and liquidity risk materialised due to severe deficits in management. The turmoil quickly spilled over to other regional banks with similar business models and Swiss big bank Credit Suisse.[\[5\]](#_ftn_root_5) Despite a temporary bout of tension, these events did not have any lasting effect on the performance of international financial markets.[\[6\]](#_ftn_root_6) The stock markets also withstood the flagging economic activity and the geopolitical risks in the year under review and, amid fluctuations, posted gains overall. The bond markets saw mixed developments as a whole.[\[7\]](#_ftn_root_7) Yields on medium to long-term government and corporate bonds, especially, fell because market participants were anticipating a global disinflation process and policy rate cuts. {#par-i8a7i3}
### 1.2 Balance sheet and structural developments in the German banking sector
**The consolidation process in the German banking sector continued in 2023.** As in the previous years, both the number of credit institutions and the number of branches contracted further.[\[8\]](#_ftn_root_8) Credit cooperatives accounted for more than half of the reduction in the number of credit institutions. Around one-third of the decline in the number of branches was attributable to savings banks and roughly one-third to credit cooperatives. However, big banks also significantly scaled back their number of branches once again.[\[9\]](#_ftn_root_9){#par-o818e1}
{#par-a7iuuo}{#par-i9i4ii}{#par-iu2e32}{#par-ea9iu2}{#par-ee9uua}{#par-e8e4a7}{#par-o72i86}{#par-o4io84}{#par-u6u643}{#par-i5ui6e}{#par-i6e89e}
| **Table 3.1: Structural data on German credit institutions** End of year ||||||||||
| Category of banks | Number of institutions^1^ ||| Number of branches^1^ ||| Number of employees^2^ |||
| Category of banks | 2021 | 2022 | 2023 | 2021 | 2022 | 2023 | 2021 | 2022 | 2023 |
| All categories of banks | 1,456 | 1,396 | 1,340 | 21,697 | 20,432 | 19,488 | 540,365 | 535,331 | 537,193 |
| Commercial banks | 261 | 247 | 242 | 5,199 | 4,825 | 4,572 | ^3^ 146,900 | ^3^145,700 | ^3^ 146,000 |
| Big banks | 3 | 3 | 3 | 4,037 | 3,719 | 3,471 | . | . | . |
| Regional banks and other commercial banks | 151 | 142 | 137 | 1,013 | 954 | 941 | . | . | . |
| Branches of foreign banks | 107 | 102 | 102 | 149 | 152 | 160 | . | . | . |
| Landesbanken | 6 | 6 | 6 | 179 | 144 | 139 | 27,150 | 26,900 | 26,950 |
| Savings banks | 371 | 362 | 354 | 7,732 | 7,326 | 6,965 | 194,950 | 191,000 | 191,000 |
| Credit cooperatives | 771 | 735 | 696 | 7,297 | 6,881 | 6,575 | ^4^ 135,500 | ^4^ 134,550 | ^4^ 135,400 |
| Mortgage banks | 9 | 8 | 7 | 32 | 31 | 31 | . | . | . |
| Building and loan associations | 18 | 18 | 14 | 1,239 | 1,205 | 1,186 | ^5^ 12,900 | ^5^13,200 | ^5^ 13,050 |
| Banks with special, development and other central support tasks^6^ | 20 | 20 | 21 | 19 | 20 | 20 | ^7^ 22,965 | ^7^ 23,981 | ^7^ 24,793 |
|--------------------------------------------------------------------|------:|------:|------:|-------:|-------:|-------:|-------------|-------------|-------------|
{#par-ue6188}
**German credit institutions' aggregate total assets for the year grew at a considerably slower pace than in the years from 2019 to 2022.**According to the monthly balance sheet statistics, annual average total assets grew by 0.9% in 2023. Growth rates ranged between 2.9% and 7.9% in the period from 2019 to 2021. The sharp increase in 2022 (+12.0%), meanwhile, was largely attributable to a one-off effect in the balance sheet statistics concerning how derivatives are recorded.{#par-i15au2}
Looking at the various categories of banks, regional and other commercial banks (+3.8%) and big banks (+1.6%) were foremost in posting positive growth rates compared to 2022. By contrast, savings banks (-1.1%) and credit cooperatives (-0.5%) recorded negative growth rates.{#par-i7o915}
**On the assets side of the aggregated bank balance sheet, German banks' deposits with the central bank declined in particular; growth in loans halved.** According to data from the monthly balance sheet statistics, deposits held at the central bank fell by an annual average of 8.4% compared with 2022. In particular, German credit institutions repaid a large part of the outstanding volumes under the third series of targeted longer-term refinancing operations ( III).[\[10\]](#_ftn_root_10) Furthermore, growth in loans to domestic non-banks in 2023 was only around half the previous year's figure, at 3.4%. Regional and other commercial banks (+5.5%) and credit cooperatives (+4.1%) were the main categories to see above-average growth. Unlike in the previous year, the loan portfolios of savings banks exhibited below-average growth (+3.0%).{#par-ai6555}
**Lending to non-financial corporations, in particular, proved weak.** Longer-term loans continued to climb, but short-term loans were redeemed on balance.[\[11\]](#_ftn_root_11) The lacklustre growth was rooted in both credit supply and credit demand. The significantly increased lending rates and the uncertain economic outlook were the main factors dampening demand for loans. In terms of supply, German banks tightened their credit standards and their credit terms and conditions for corporate lending on balance, mainly because of heightened credit risk in the light of the gloomier economic situation and subdued economic outlook.[\[12\]](#_ftn_root_12){#par-o6i895}
**In addition, there was also considerably less growth in loans for house purchase to non-financial corporations and households.** Having been one of the main drivers of credit growth over the past years, loans for house purchase did not even increase half as strongly as they had done in the years 2020 to 2022, posting growth of +2.9% in 2023. Savings banks and credit cooperatives, in particular, recorded heavily weakened growth. At +2.7%, growth in savings banks' loans for house purchase in the reporting year was roughly two-thirds below the previous year's rate. Unlike in 2022, it was also slightly below average, compared with the figure aggregated across all categories of banks. By contrast, credit cooperatives again posted above-average growth in loans for house purchase in 2023. That said, the growth rate of +4.3% was still only around half the figure seen in the previous year.{#par-a23335}
Lending for house purchase was likewise throttled by both supply-side and demand-side effects. Demand for loans for house purchase mainly slackened due to high construction prices and strongly increased financing costs.[\[13\]](#_ftn_root_13) But the supply side also exerted a dampening force. German banks tightened their credit standards and terms and conditions due to gloomier housing market prospects and heightened default risk.[\[14\]](#_ftn_root_14){#par-iae5ii}
**On the liabilities side of the aggregated bank balance sheet, growth in deposits was significantly weaker in the year under review than was the case in previous years.** At +2.3%, the rate of growth in deposits held by domestic non-banks at German credit institutions averaged across 2023 was more than 1 percentage point lower than the previous year's value and only equated to around half of the growth seen in 2021 and 2020. In particular, 2023 saw a 4.5% decline in sight deposits; in the period since the 2008‑09 global financial crisis up to 2022, sight deposits had, at times, recorded growth rates in double figures. The decline in savings deposits also picked up pace in 2023, reaching 12.7%. In absolute terms, however, this did not have so much of an impact. By contrast, time deposits registered exceptionally strong growth at +29.0%.{#par-i9uo74}
**Overall, German banks' deposit business in the reporting year was characterised by the reallocation of funds in an environment of rising interest rates.** Inflows into short-term time deposits, in particular, largely corresponded with net outflows from overnight deposits and short-term savings deposits. The behaviour of non-financial corporations and households was a response to further widening in yield spreads between short-term time deposits remunerated at close-to-market rates and other short-term bank deposits.[\[15\]](#_ftn_root_15){#par-e3u8u1}
**On an average for 2023, German credit institutions' balance sheet equity grew much more slowly than in the previous year.** At 2.8%, the growth rate was only just over half of what it had been in the year before. Credit cooperatives (+5.0%) and big banks (+4.1%) saw the most pronounced above-average increases. But growth in the balance sheet equity of savings banks (+3.2%) and regional and other commercial banks (+2.9%) was also slightly higher than the aggregate figure for all German banks.By contrast, the balance sheet equity of mortgage banks and building and loan associations contracted by 5.6% and 2.6%, respectively.{#par-eiu475}
2 Performance, profitability and cost efficiency
------------------------------------------------
**The performance, profitability and cost efficiency of German credit institutions improved significantly in the year under review.** Aggregate profit for the financial year before tax and the return on assets both grew steeply compared with 2022, reaching 25-year highs.[\[16\]](#_ftn_root_16) At the same time, German banks' cost/income ratio fell to its lowest level in 25 years. Furthermore, these developments were founded on a broad-based improvement in annual results across all of the categories of banks included in the statistics on banks' profit and loss accounts[\[17\]](#_ftn_root_17) (see the supplementary information under "[Methodological notes](#Methodological-notes)"). This was mainly driven by the institutions' net interest income, which saw strong positive developments primarily due to the Eurosystem having increased key interest rates.{#par-uioo8a}
Methodological notes
--------------------
**The results from the profit and loss accounts are based on the published annual reports of the individual institutions in accordance with the provisions set forth in the German Commercial Code** ***(Handelsgesetzbuch)*** **and the Regulation on the Accounting of Credit Institutions (** ***Verordnung über die Rechnungslegung der Kreditinstitute*** **).** In terms of their conception, structure and definitions, they differ from the International Financial Reporting Standards (IFRS)[\[1\]](#_ftn_457bb1ab_1) for publicly traded banking groups. This means that -- from a methodological viewpoint -- business performance and certain balance sheet or individual profit and loss items are not comparable across the national and international accounting frameworks. For reasons of comparability within Germany, it is advisable to consider the individual accounts when analysing financial performance. The figures for balance sheet capital (total equity), total assets and other stock variables are not obtained from the annual reports but are taken as annual average values on the basis of the monthly balance sheet statistics reported for the institution as a whole.
**The reporting group for profit and loss statistics includes all banks which are monetary financial institutions (MFIs) that conform to the definition of a credit institution under the Capital Requirements Regulation (CRR) as set forth in Article 4(1) number 1 of Regulation (EU) No 575/2013 and are domiciled in Germany.** Branches of foreign banks that are exempted from the provisions of Section 53 of the German Banking Act (*Kreditwesengesetz*), banks in liquidation and banks with a financial year of less than twelve months (truncated financial year) are not included in this performance analysis.
At the launch of monetary union in 1999, the reporting group relevant for calculating the money supply and for monetary analysis was uniformly defined by the European Central Bank for the euro area as a whole and designated as the MFI sector. Unlike the population of banks used for the Bundesbank's analysis up to that point, building and loan associations are also included.
**Except where another time period is explicitly mentioned, the calculations with regard to the longer-term average cover the years since the launch of monetary union, i.e. from 1999 to 2023.**
1. {#_ftn_457bb1ab_1} IFRS-based financial statements are of relevance, for instance, to matters of macroprudential analysis and oversight, concentrating on systemically important banks and their international business activities (including their foreign subsidiaries). For details, see Deutsche Bundesbank (2013).
### 2.1 Profit for the financial year before tax
**Aggregate profit for the financial year before tax** [\[18\]](#_ftn_root_18)**rose by almost 80% in 2023 on the year.** At €48.7 billion, pre-tax profit for 2023 was not only two-and-a-half times the long-term average, but was also the highest figure seen in the last 25 years.[\[19\]](#_ftn_root_19) In addition, all of the categories of banks considered[\[20\]](#_ftn_root_20) as well as around 88% of all individual institutions contained in the data recorded higher profits for the year in 2023 than they had done in 2022.{#par-e73332}
{#par-e1385i}
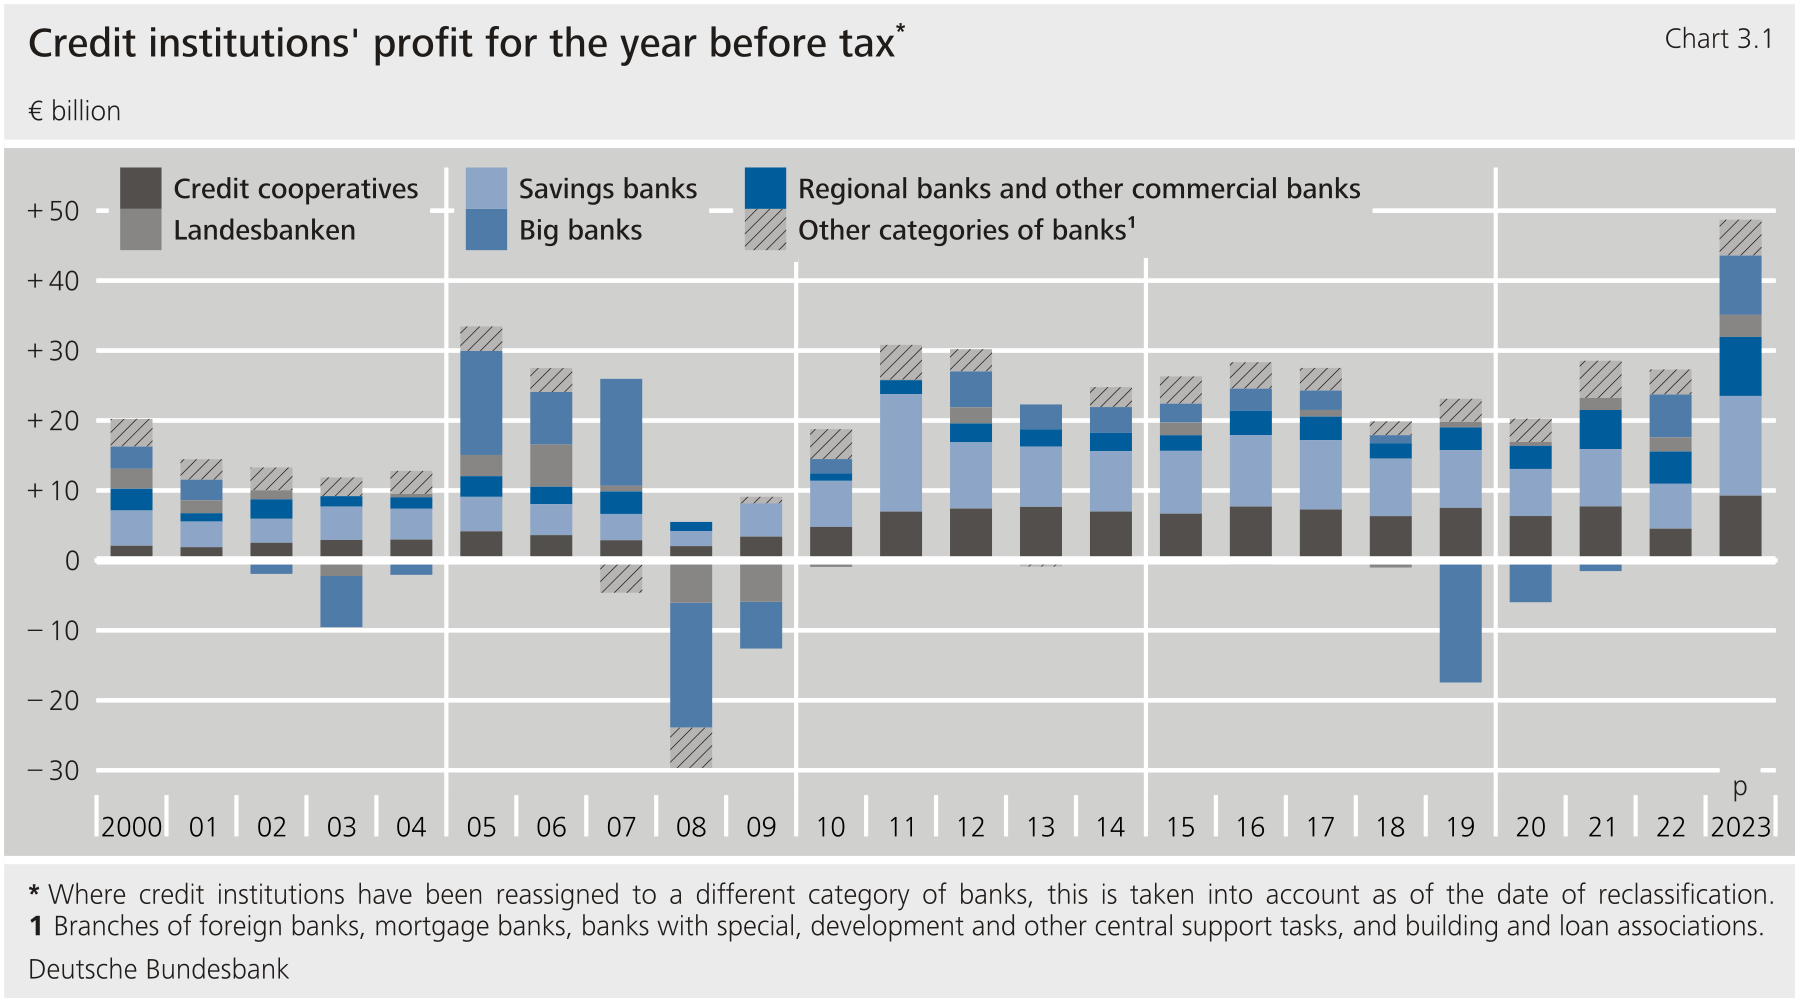
**In absolute terms, savings banks and credit cooperatives were responsible for more than half (58%) of the total increase.** At +122.3% and +104.1%, respectively, growth in profits for the year before tax recorded by savings banks and credit cooperatives in 2023 was well above the average. Both categories of banks predominantly conduct conventional lending and deposit business, meaning that they benefited from the rising key interest rates in the Eurosystem. Their net interest income rose steeply. But much lower net valuation charges than in 2022 also played a key role in the increased profit for the year seen by savings banks and credit cooperatives.{#par-a76u35}
**Besides this, regional and other commercial banks, which are also highly active in the lending and deposit business, recorded significantly higher profits for the year before tax than they had done in 2022.** The growth of 82.6% recorded by these institutions was roughly on a par with the aggregate across all German credit institutions. In absolute terms, regional and other commercial banks accounted for just under one-fifth (around 18%) of the total increase in pre-tax profit for the year. Similarly to the case of savings banks and credit cooperatives, a strong rise in net interest income and lower net valuation charges were instrumental in driving the improvement in profit for the year at regional and other commercial banks.{#par-a97736}
**Meanwhile, at +38.4%, growth in profits for the year at big banks fell short of the average.** Big banks' absolute contribution to the increase in aggregate profit for the year was comparatively slim as well, amounting to around 11%. Unlike savings banks, credit cooperatives and regional and other commercial banks, big banks did not benefit from higher net interest income in 2023, with that metric remaining virtually the same as it had been in 2022. Instead, the trading result and other operating result proved to be the main forces driving the improvement in big banks' profit for the financial year. In contrast to developments at the aggregate level, big banks saw their profit for the financial year compressed by higher net valuation charges and steeply increased net charges in the other and extraordinary account.{#par-a1412a}
| **Table 3.2: Major income and cost item for individual categories of banks in 2023** ^p^ As a percentage of operation income ||||||||||
| Item | All categories of banks | Big banks | Regional banks and other commercial banks | Landesbanken | Savings banks | Credit cooperatives | Mortgage banks | Building and loan associations | Banks with special development and other central support tasks |
| Net interest income | 65.1 | 49.1 | 58.7 | 67.0 | 73.1 | 73.4 | 98.5 | 99.3 | 70.0 |
| Net commission income | 22.9 | 28.5 | 22.2 | 14.3 | 25.0 | 22.6 | − 3.2 | − 6.1 | 20.6 |
| Result from the trading portfolio | 7.0 | 17.6 | 10.5 | 10.1 | 0.0 | 0.0 | 0.0 | 0.0 | 4.6 |
| Other operating result | 5.0 | 4.8 | 8.5 | 8.7 | 1.8 | 3.9 | 4.7 | 6.8 | 4.8 |
| Operating income | 100.0 | 100.0 | 100.0 | 100.0 | 100.0 | 100.0 | 100.0 | 100.0 | 100.0 |
| General administrative spending | − 59.2 | − 69.0 | − 53.0 | − 58.4 | − 56.1 | − 60.3 | − 42.0 | − 70.5 | − 56.6 |
| Staff costs | − 29.6 | − 30.0 | − 24.0 | − 27.2 | − 33.4 | − 33.6 | − 19.7 | − 27.9 | − 26.7 |
| Other administrative spending | − 29.7 | − 39.0 | − 29.0 | − 31.2 | − 22.8 | − 26.6 | − 22.3 | − 42.6 | − 29.9 |
| Result from the valuation of assets | − 6.3 | − 6.6 | − 5.2 | − 8.1 | − 7.7 | − 4.4 | − 25.1 | − 3.2 | − 2.8 |
| Other and extraordinary result | − 4.8 | − 1.5 | − 16.7 | − 3.6 | − 0.7 | − 2.0 | 1.0 | − 8.8 | − 3.6 |
|-------------------------------------|-------------------------|-----------|-------------------------------------------|---------------|---------------|---------------------|----------------|--------------------------------|----------------------------------------------------------------|
{#par-uueu54}
#### 2.1.1 Operating income and its components
**In 2023, operating income** [\[21\]](#_ftn_root_21)**increased once again significantly more strongly than in the previous year, growing by €23.2 billion (+16.5%).** [\[22\]](#_ftn_root_22) As in 2022, the increase was broad-based, with all categories of banks under consideration[\[23\]](#_ftn_root_23) and around 85% of all individual institutions contained in the data reporting higher operating income in 2023 than in the preceding year.{#par-a3eeu7}
{#par-uo837u}
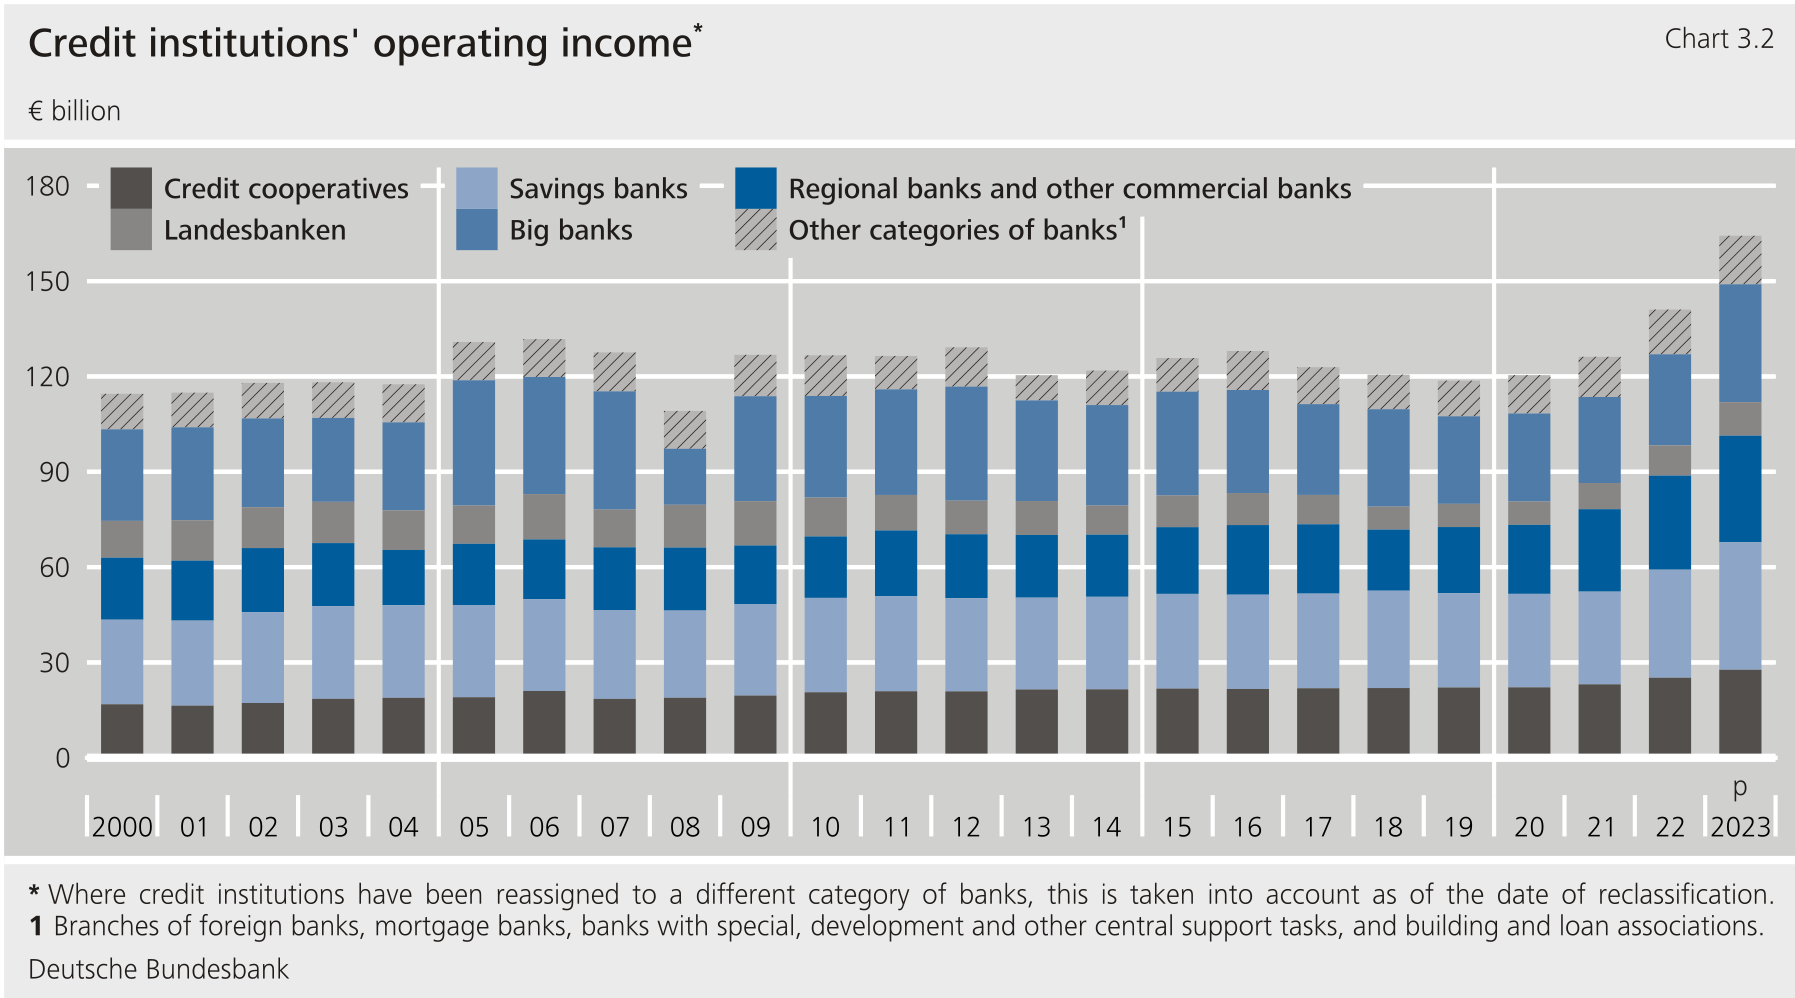
**Overall, roughly two-thirds of the total increase in operating income in the reporting year was attributable to the sharp rise in net interest income.** However, its share in operating income remained virtually the same as in 2022. In 2023, net interest income remained the most important source of revenue for German credit institutions. In addition, the trading result and other operating result also improved considerably, with their combined contribution to the overall increase in operating income being about half that of net interest income. Nevertheless, the trading result and other operating result remained of minor importance overall as a source of income for German banks. By contrast, net commission income in 2023 did not contribute to the increase in operating income at the aggregate level. However, in absolute terms, net commission income remained the second most important source of revenue for German credit institutions.{#par-i86629}
#### **2.1.1.1 Net interest income**
**In 2023, German credit institutions' net interest income once again recorded considerably stronger growth than in the previous year** [\[24\]](#_ftn_root_24)**and was ultimately the main driver of growth in profit for the financial year before tax.**Rising by €15.3 billion (+16.7%), net interest income amounted to €106.9 billion in the reporting year, which is the highest value in 25 years. Much the same as in the previous year, the increase in the reporting year was also almost entirely attributable to net interest income in the narrower sense, i.e. the contribution to earnings made by interest-related business. Current income from shares and other variable-yield securities, as well as from participating interests, which are likewise included in net interest income, also increased on balance. However, in 2023 this once again made only a small contribution to growth.{#par-e38i64}
{#par-o6371i}
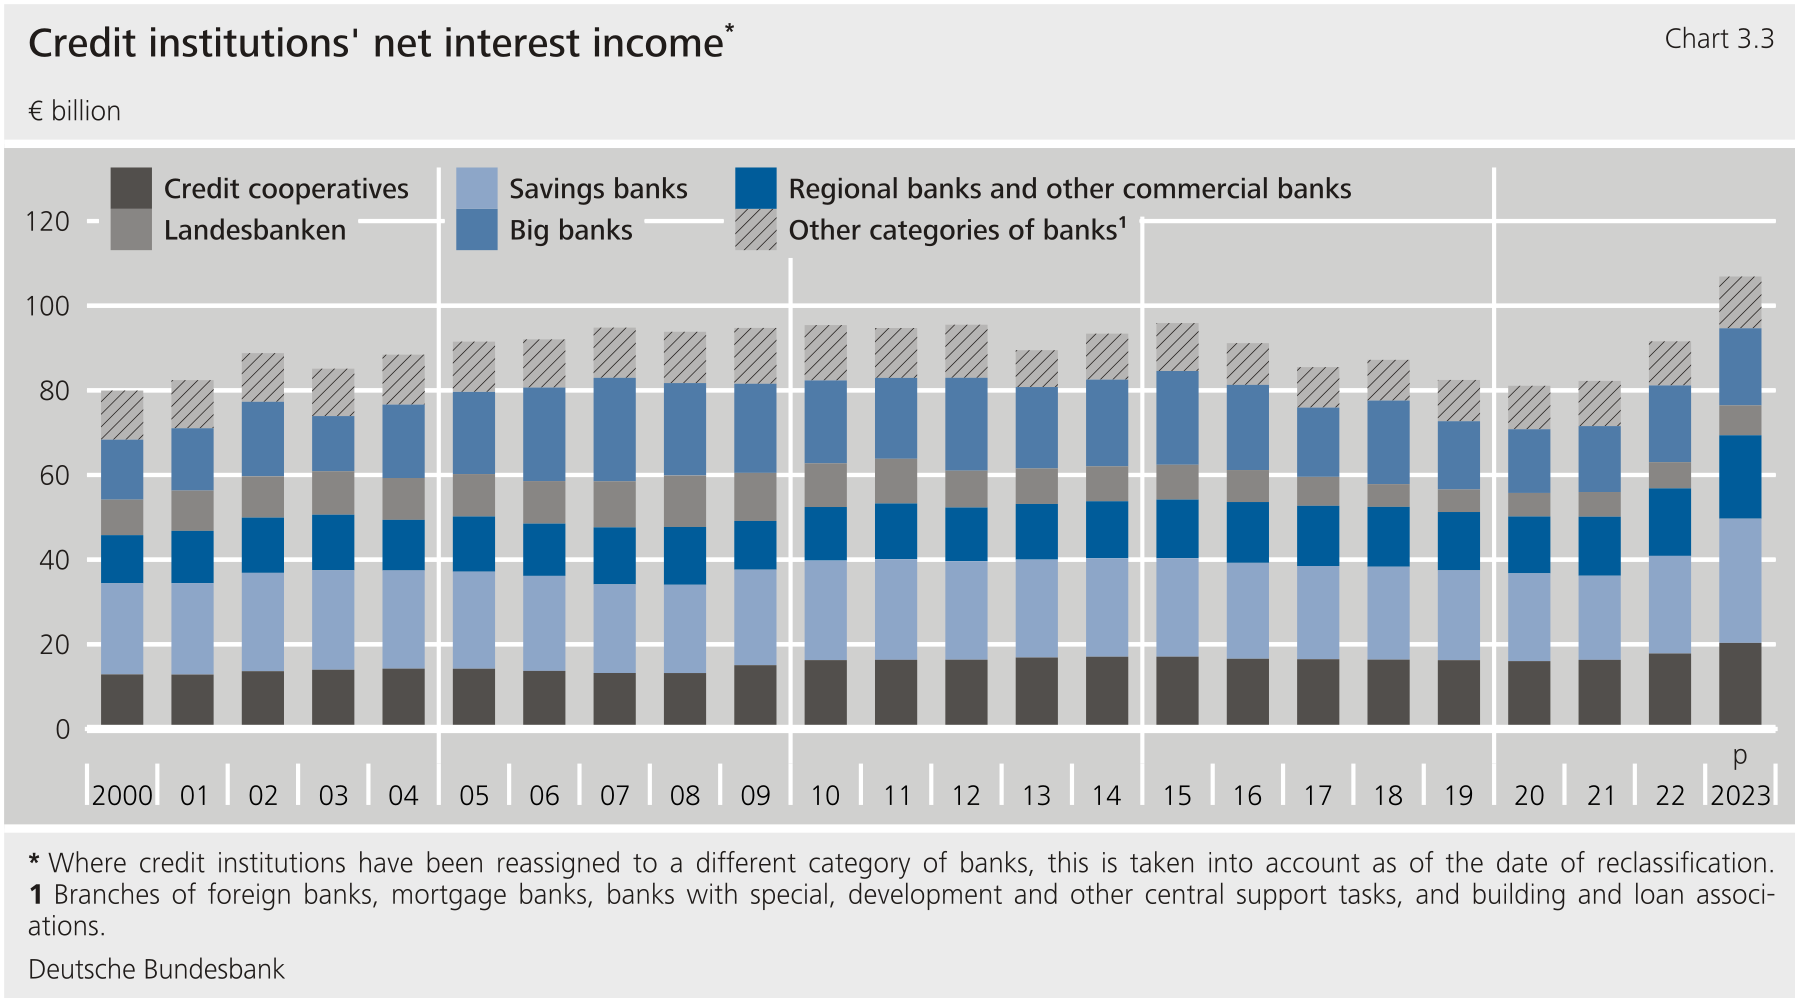
**Overall, German credit institutions benefited considerably from the Euroystem's key interest rate hikes.** [\[25\]](#_ftn_root_25) While both interest income and interest expenditure increased substantially, in absolute terms interest income (+€164.4 billion) increased much more strongly than interest expenditure (+€149.1 billion) in 2023. The supplementary information on the composition of interest income and interest expenditure of German credit institutions in 2023 provides an overview of the importance of individual financial instruments in German banks' interest income and interest expenditure.{#par-io86ua}
Supplementary information on the composition of interest income and interest expenditure of German credit institutions in 2023
------------------------------------------------------------------------------------------------------------------------------
**The different types of financial instrument held by German credit institutions vary in terms of importance regarding their interest income and interest expenditure.** The following evaluations and chart are based on prudential reporting data; although these data are regularly collected only from around 330 of the just under 1,340 institutions, they nevertheless provide high coverage of the German banking system. The banks in the data survey represent 93% of interest income, 97% of interest expenditure and 90% of aggregate total assets. For reasons of proportionality, just under 1,000 small institutions are not required to provide data. The collected data capture around two-thirds of the interest income and interest expenditure of all savings banks and around half of the interest income and interest expenditure of credit cooperatives.[\[1\]](#_ftn_47408133_1) In addition, the data also include the consolidated interest income and interest expenditure of the German parent companies' foreign subsidiaries. The business of these subsidiaries is conducted more frequently in foreign currency and less frequently with households.
The left-hand side of Chart 3.4 shows the income shares of individual financial instruments in total interest income.
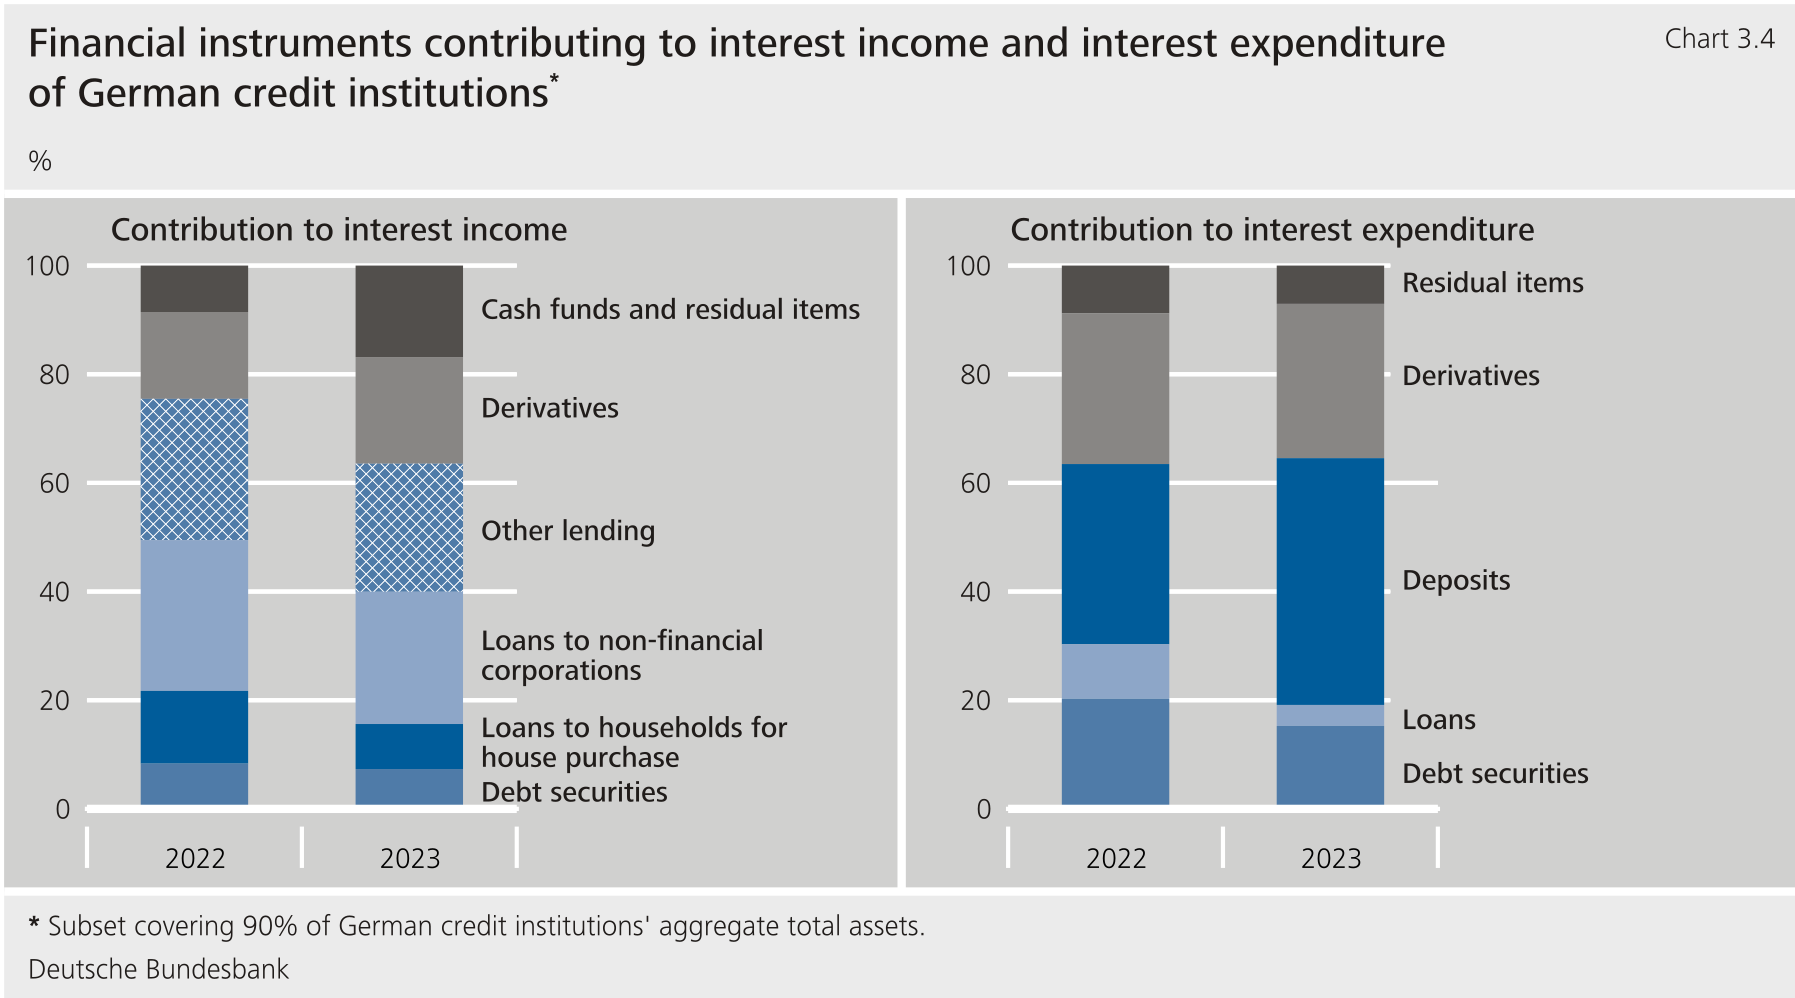
**At 26%, loans to non-financial enterprises made the strongest contribution to German institutions' interest income in 2023.** Loans to enterprises often have variable interest rates, with the result that interest rate hikes translate to income gains comparatively rapidly. Moreover, German banks were quick to pass on the Eurosystem's key interest rate hikes when granting new loans to non-financial corporations.[\[2\]](#_ftn_47408133_2)
**By contrast, at 7% and 8% respectively, debt securities and loans to households for house purchase made only minor contributions to interest income in the reporting year.** Both financing instruments exhibit relatively long interest rate fixation periods and residual maturities; their income therefore grew in absolute terms, albeit at a slower rate than other financing instruments. As a result, the shares of debt securities and loans for house purchase in total interest income were down on their 2022 levels. In the case of loans for house purchase, in particular, German credit institutions passed on the Eurosystem's key interest rate hikes relatively quickly and unexpectedly sharply.[\[3\]](#_ftn_47408133_3) However, these higher interest rates initially only affected new business, which was significantly more subdued in 2023 than it had been in previous years. By contrast, interest rates on the total stock of loans for house purchase rose only slowly on account of the longer fixation periods.[\[4\]](#_ftn_47408133_4) In addition, the inclusion of German parent companies' foreign subsidiaries in this dataset means that the significance of loans for house purchase is probably relatively low.
**In the reporting year, a significant contribution of 23% to total interest income was attributable to other lending**. This includes, for example, consumer credit but also loans to government, other credit institutions and other financial corporations. The maturities and interest rate fixation periods on other lending types are often less long-term than those on loans for house purchase. Correspondingly, the Eurosystem's key interest rate hikes are likely to have been reflected more rapidly in interest income for other lending, too.
**In 2023, more than one-third of interest income was generated outside of the loans and debt securities business** . Derivatives accounted for 20% of interest income. A further 17% stemmed from cash funds and other items. The bulk of cash funds and other items was attributable to deposits with the central bank, with average interest rates rising from 0.15% in 2022 to 3.27% in 2023 in the wake of monetary policy tightening. Consequently, German credit institutions in 2023 generated around 12% of total interest income from deposits held with the central bank.[\[5\]](#_ftn_47408133_5) Derivatives and cash funds have short interest rate fixation periods, which means that interest rate hikes lead to rising income particularly quickly. This led to their share in total interest income rising by 12 percentage points on 2022.
**The significance of the individual financing instruments in terms of interest income was different for each category of bank in most cases** . Interest income from loans to non-financial corporations was of similarly high importance for virtually all categories of banks in 2023. However, it made the largest contribution to total interest income in the case of credit cooperatives, where it accounted for around one-third of total interest income. Loans for house purchase played a major role for savings banks and credit cooperatives, in particular, as they each generated around one-quarter of their overall interest income from these loans. Conversely, interest income from debt securities was most relevant for big banks, amounting to roughly one-eighth of interest income. Other lending made the strongest contribution to aggregate interest income in the case of regional and other commercial banks, where it generated one-third of interest income. Similarly, big banks saw other lending contribute around one-quarter as well. In the reporting year, derivatives were most significant in the Landesbank category. Less than half but markedly more than one-third of Landesbanken's total interest income stemmed from derivatives. This large share is partly due to the fact that Landesbanken are often the counterparties of savings banks' interest rate derivatives. Compared with credit cooperatives, savings banks make use of interest rate derivatives more frequently. Cash funds and residual items made up a particularly high share of commercial banks' interest income,[\[6\]](#_ftn_47408133_6) contributing one-fifth of their total.
The right-hand side of Chart 3.4 shows the expenditure shares of individual financial instruments in total interest expenditure.
**At 46%, deposits made the largest contribution to German institutions' interest expenditure in 2023.** Compared with 2022, the share of interest expenditure on deposits in total expenditure increased significantly by around 12 percentage points. The main reason for this was that deposits represented a large part of German banks' funding but only rarely carried positive interest rates in 2022. The key interest rate hikes could potentially have been transmitted rapidly to deposits given their regular short contractual maturities and fixation periods. However, the increase in interest rates on sight deposits from the non-financial private sector was distinctly less pronounced in 2023 than would have been expected based on historical patterns.[\[7\]](#_ftn_47408133_7) Initially, this slowed the increase in interest expenditure on deposits. However, depositors started shifting low-interest sight deposits into higher-interest-bearing fixed-term deposits at the end of 2022 -- a move that is likely to have contributed markedly to the increase in interest expenditure on deposits.[\[8\]](#_ftn_47408133_8)
**In the reporting year, German banks' liabilities in the form of loans and debt securities accounted only for around 19% of their interest expenditure.** Compared with the previous year, the share decreased significantly by 11 percentage points, as these liabilities are usually associated with longer maturities and interest rate fixation periods than deposits and because average interest rates on existing business increased relatively slowly. However, interest rate hikes did lead to considerably higher rates on new business than on deposits.
**Derivatives and residual items accounted for slightly more than one-third of interest expenditure** . Derivatives produced 28% of interest expenditure, while residual items contributed an additional 7%. The residual items also include interest expenditure from central bank business. This interest expenditure rose significantly as compared to 2022 on the back of the Eurosystem's key interest rate hikes. In the reporting year, around 2% of German credit institutions' total interest expenditure was attributable to monetary policy refinancing operations with the central bank.[\[9\]](#_ftn_47408133_9) Overall, however, the significance of residual items decreased by 2 percentage points in 2023.
**The impact individual financing instruments had on interest expenditure also varied from one category of bank to another.** In 2023, deposits accounted for well over half of total interest expenditure at commercial banks, savings banks and credit cooperatives. By contrast, they accounted for only one-third of total interest expenditure in the case of Landesbanken. Interest expenditure stemming from credit obligations was of notable importance only for regional and other commercial banks, where it accounted for roughly one-sixth of total interest expenditure. Derivative-induced interest expenditure played an important role for those categories of banks, in particular, whose interest income is likewise heavily influenced by derivatives. For example, derivatives accounted for roughly half of total interest expenditure for Landesbanken, in particular. In terms of proportion, residual items were most significant for the interest expenditure of savings banks and big banks, accounting only for just over one-tenth of total interest expenditure in each case, however.
1. {#_ftn_47408133_1} Equivalent data are available for 240 larger institutions of the total of around 1,050 savings banks and credit cooperatives.
2. {#_ftn_47408133_2} See Deutsche Bundesbank (2024d)
3. {#_ftn_47408133_3} See Deutsche Bundesbank (2023e), p. 39.
4. {#_ftn_47408133_4} See Deutsche Bundesbank (2023e), p. 58.
5. {#_ftn_47408133_5} German credit institutions generated roughly €41 billion overall in interest income from deposits held with the central bank in 2023. See Deutsche Bundesbank (2024a), p. 84.
6. {#_ftn_47408133_6} Aggregate of big banks as well as regional and other commercial banks.
7. {#_ftn_47408133_7} See Deutsche Bundesbank (2023e), pp. 56 f.
8. {#_ftn_47408133_8} See Deutsche Bundesbank (2023a), p. 42.
9. {#_ftn_47408133_9} In absolute terms, German banks incurred around €5 billion in interest expenditure from monetary policy refinancing operations with the central bank in 2023. See Deutsche Bundesbank (2024a), p. 84.
**As in the preceding year, developments in net interest income in the reporting year were mainly attributable to differences in the speed and degree of interest rate increases applying to loans and deposits.** [\[26\]](#_ftn_root_26) For example, monthly interest rate statistics show that whilst interest rates on new loans to non-financial corporations and households continued to increase sharply, interest rates on overnight deposits from the private non-financial sector in particular were raised by banks to a relatively weak extent once again. According to an estimate in the Bundesbank's 2023 Financial Stability Review, overall interest expenditure in 2023 would have been an estimated €29 billion higher if German banks had passed through the key interest rate hikes to overnight deposits as observed in the past.[\[27\]](#_ftn_root_27) However, the volume of these deposits had grown to an unprecedented level by 2022, meaning that, in 2023, this type of deposit continued to be not only the most cost-efficient type of funding, but also the main source of funding for German banks. The nevertheless relatively strong growth in interest expenditure was probably due in part to the fact that interest rates on time deposits rose as anticipated and thus to a greater extent than interest rates on sight deposits.[\[28\]](#_ftn_root_28) Moreover, non-financial corporations and households increasingly shifted their funds from sight deposits to time deposits.{#par-ua1348}
Furthermore, German credit institutions generated a total of roughly €41 billion in interest income from deposits held at the central bank in 2023.[\[29\]](#_ftn_root_29) This amounted to around 12% of total interest income in the reporting year, with interest income from deposits held at the central bank contributing just under one-quarter of the growth in interest income.[\[30\]](#_ftn_root_30) By contrast, at roughly €5 billion, interest expenditure on monetary policy refinancing operations accounted for only around 2% of German credit institutions' overall interest expenditure in 2023 and contributed just under 5% of the rise in interest expenditure.[\[31\]](#_ftn_root_31){#par-i72573}
{#par-eeie9a}
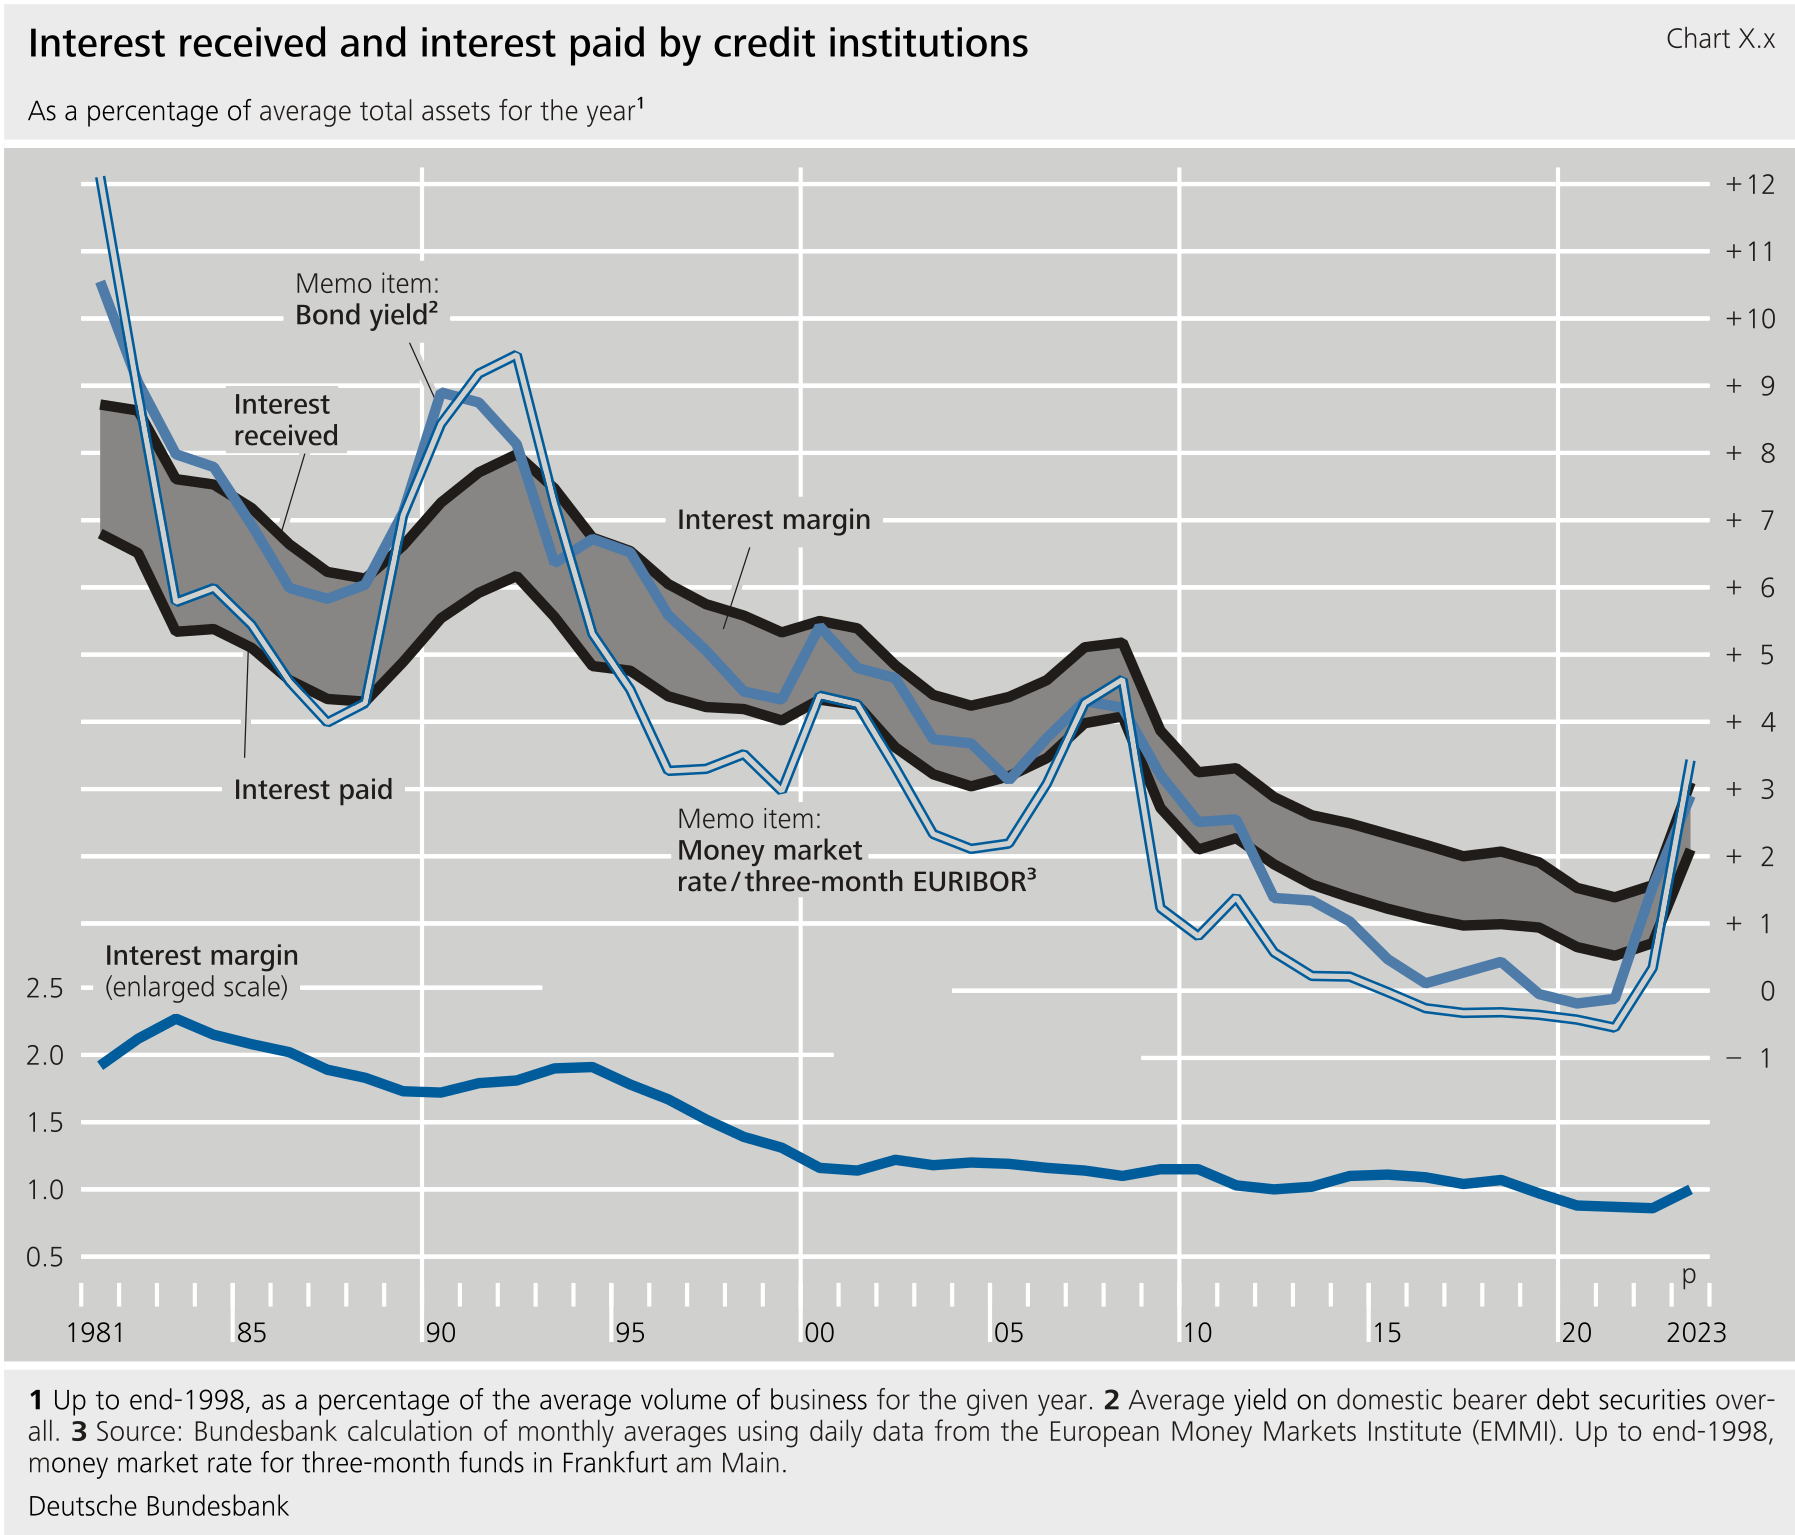
**All of the categories of banks under consideration** [\[32\]](#_ftn_root_32)**posted higher net interest income for the year under review than in 2022.** However, the increases varied very considerably across the different categories of banks. In particular, savings banks' net interest income saw strong above-average growth of €6.3 billion (+27.2%), meaning that roughly 41% of the total increase in net interest income in 2023 was attributable to savings banks. By contrast, the increase recorded by credit cooperatives was slightly below average at €2.5 billion (+14.1%). The main reason for this was that the increase in interest expenditure in relation to interest income was significantly greater at credit cooperatives than at savings banks. Like savings banks, regional and other commercial banks also recorded substantial growth in their net interest income in 2023, up €3.8 billion (+23.5%). Together, savings banks, regional and other commercial banks, and credit cooperatives generated just over 80% of the total increase in net interest income in 2023. By contrast, big banks' net interest income increased only marginally, stagnating at the level recorded in 2022.[\[33\]](#_ftn_root_33) Unlike the situation at regional and other commercial banks, interest income and interest expenditure at big banks increased in almost equal measure.{#par-e7u719}
As savings banks and credit cooperatives predominantly conduct conventional lending and deposit business, net interest income plays a relatively important role as a source of income for both categories of banks. For example, in 2023 nearly three-quarters of operating income at savings banks and credit cooperatives was attributable to net interest income. By contrast, regional and other commercial banks generated only around half of their operating income through net interest income, with the equivalent figure for big banks being just short of 60%.{#par-ee897i}
**The interest margin** [\[34\]](#_ftn_root_34)**increased again in the reporting year for the first time since 2018.** It was up 0.14 percentage point compared with 2022, but, standing at 1.00%, still fell short of the long-term average (1.09%). The improvement resulted entirely from the increase in net interest income, as aggregate average total assets for the year hardly grew at all in 2023.{#par-e91u5u}
In a comparison of the various categories of banks, savings banks and credit cooperatives in particular recorded an above-average improvement in their interest margin. The interest margin of savings banks increased by 0.42 percentage point compared with 2022, while that of credit cooperatives rose by 0.22 percentage point. In 2023, savings banks and credit cooperatives were once again the categories of banks with the highest interest margins, at 1.89% and 1.75%, respectively. Nevertheless, both categories of banks were still short of their long-term average levels (2.04% and 2.13%, respectively). In addition to savings banks and credit cooperatives, regional and other commercial banks also improved their interest margin. This increase, which amounted to 0.16 percentage point, was roughly on a par with the aggregate across all German banks. However, at 1.00%, the interest margin of regional and other commercial banks likewise fell short of the long-term average level for the category (1.63%). The interest margin of big banks, by contrast, remained at the previous year's level, standing at 0.66%, and was still significantly below the long-term average (0.85%).{#par-iua847}
#### **2.1.1.2 Net commision income**
**Net commission income stagnated at the previous year's level and once again played no part in improving the profit for the financial year in 2023.** Unlike in the previous year, both commissions received and commissions paid declined.In absolute terms, however, the declines in 2023 of €1.9 billion and €1.6 billion, respectively, were nearly the same size, meaning that net commission income, totalling €37.6 billion, remained at the previous year's level. Furthermore, as aggregate total assets of German banks remained largely unchanged on the year, the commission margin[\[35\]](#_ftn_root_35) in 2023 also stagnated at the previous year's level. In addition, at 0.35%, it was also in line with the long-term average.{#par-uu6i3u}
**Overall, the Eurosystem's key interest rate hikes were a drag on German banks' net non-interest income.** [\[36\]](#_ftn_root_36) However, commissions business in the individual business areas was mixed across the various categories of banks. German credit institutions derived most benefit from payments business and portfolio management. By contrast, declines were seen above all in lending business, securities business and brokerage business.{#par-e1o365}
{#par-e36o7u}
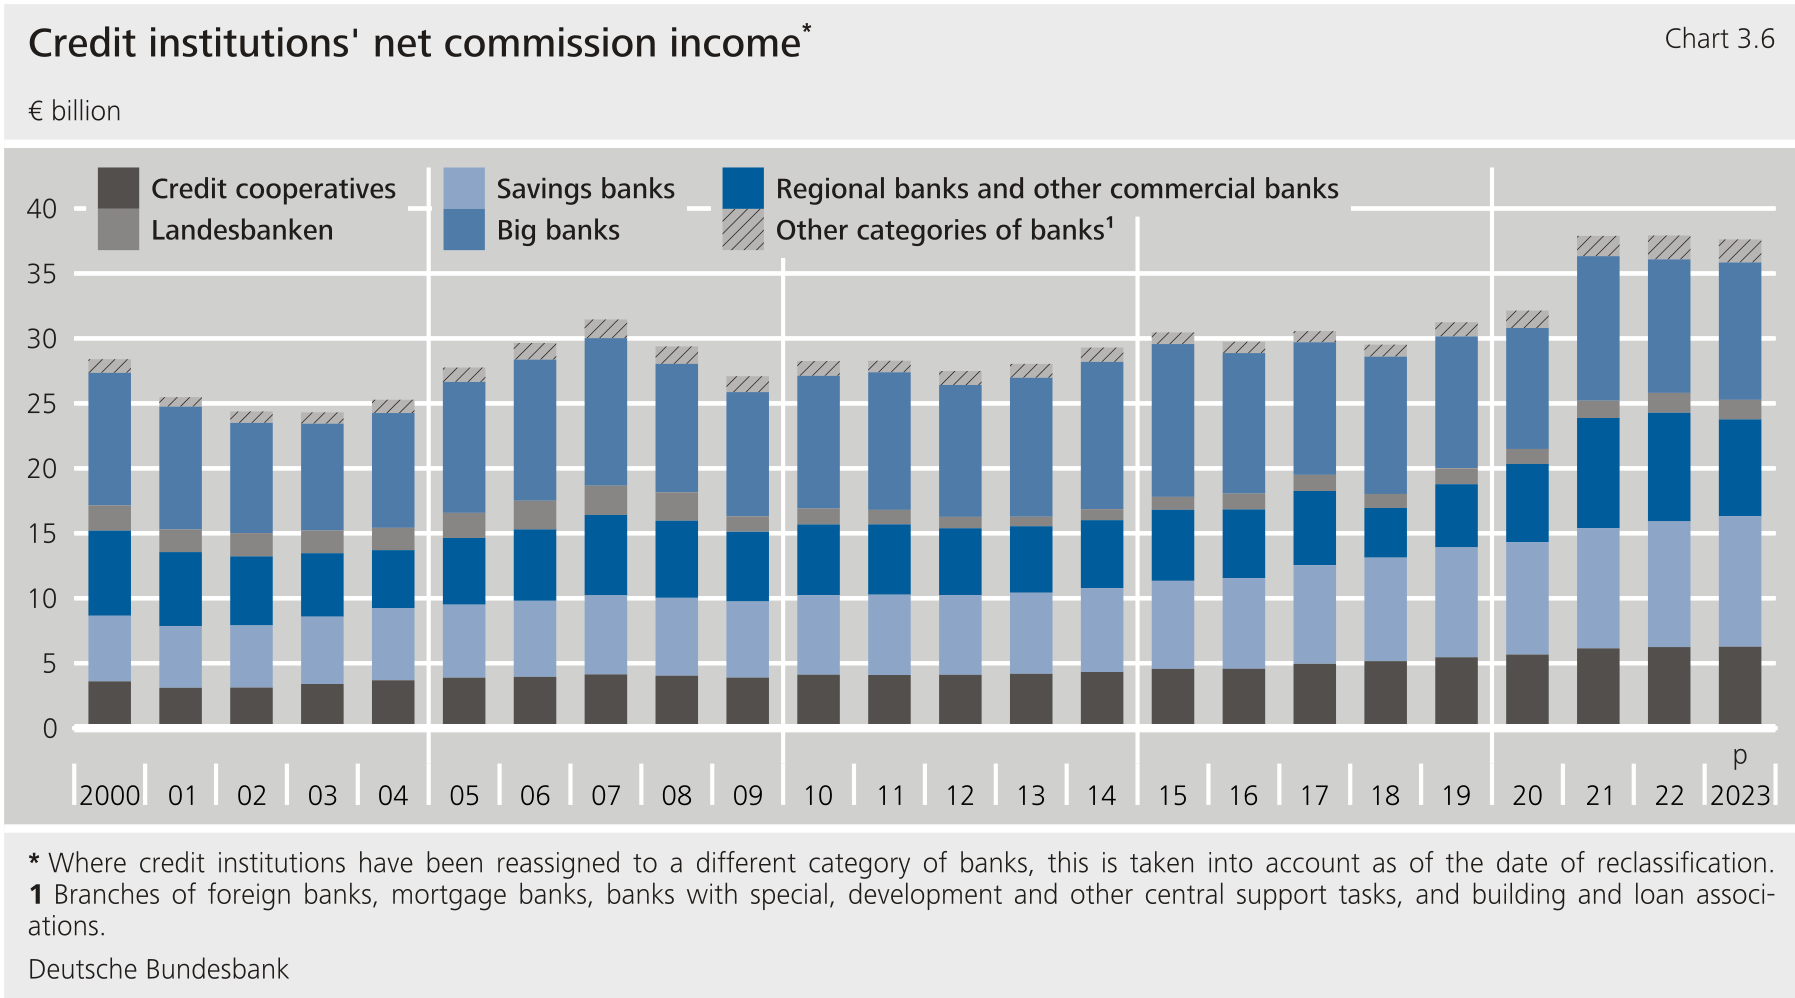
**In a comparison of the categories of banks under consideration, the absolute changes in net commission income were low across the board, but there were sizeable differences when looking at percentage changes.** The changes in the commission margins recorded by the respective categories of banks were also correspondingly low. For example, net commission income of regional and other commercial banks declined by €0.9 billion (-10.8%) compared with 2022. The commission margin of this category of banks thus fell by 0.06 percentage point to 0.38%. By contrast, savings banks and big banks increased their net commission income in 2023 by €0.4 billion (+3.8%) and €0.3 billion (+2.9%), respectively. As a result of this, the commission margin of savings banks rose marginally to 0.65%. The commission margin of big banks remained unchanged at 0.38%, despite slightly higher net commission income in 2023. Credit cooperatives' net commission income and thus also their commission margin remained unchanged in the year under review compared with the previous year.{#par-ea24u1}
#### **2.1.1.3 Net result from the trading portfolio**
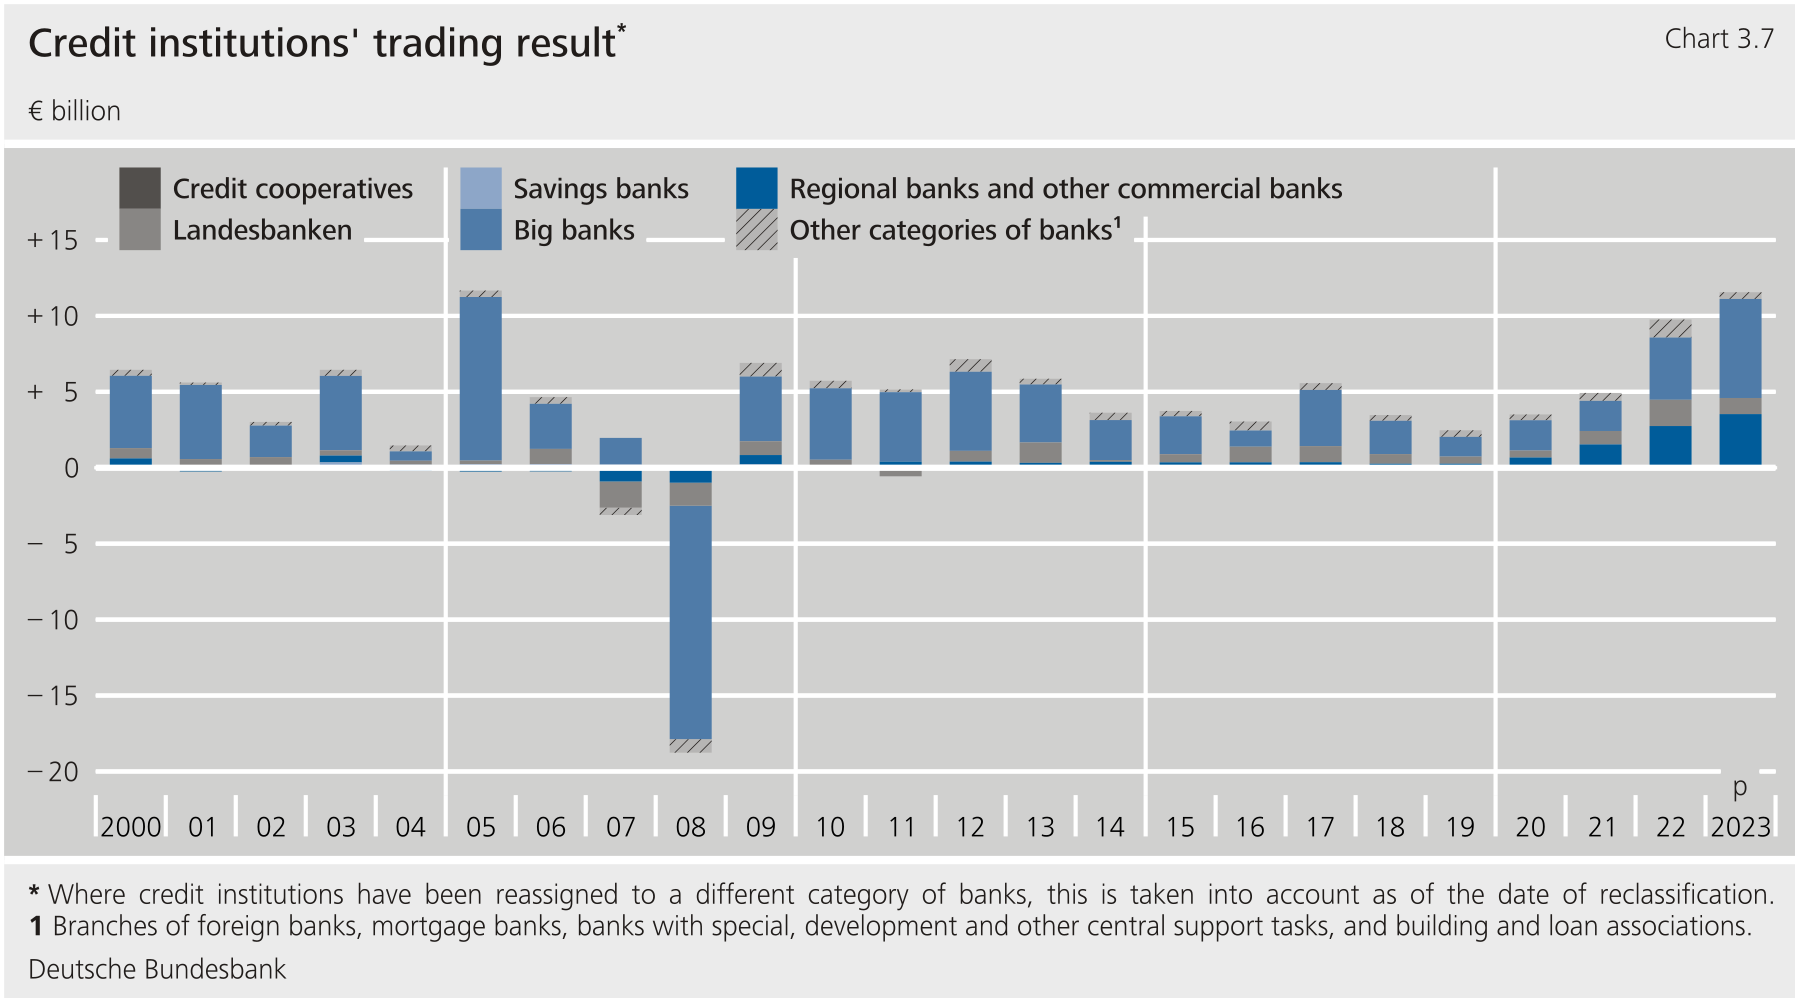
**The net result from the trading portfolio increased by €1.8 billion (+18.4%) to €11.6 billion in 2023.** The trading result continued to be a significant source of income only for big banks, regional and other commercial banks, and Landesbanken. In the reporting year, big banks (+59.1%) and regional and other commercial banks (+28.7%), in particular, improved their trading results. This was primarily driven by gains from hedging transactions attributable to increased customer demand in the changed interest rate environment. By contrast, Landesbanken recorded a decline of 38.6% compared with 2022. In their case, the higher interest rate level primarily led to valuation losses on derivatives.{#par-ui4424}
{#par-u3a54o}
#### **2.1.1.4 Other operating result**
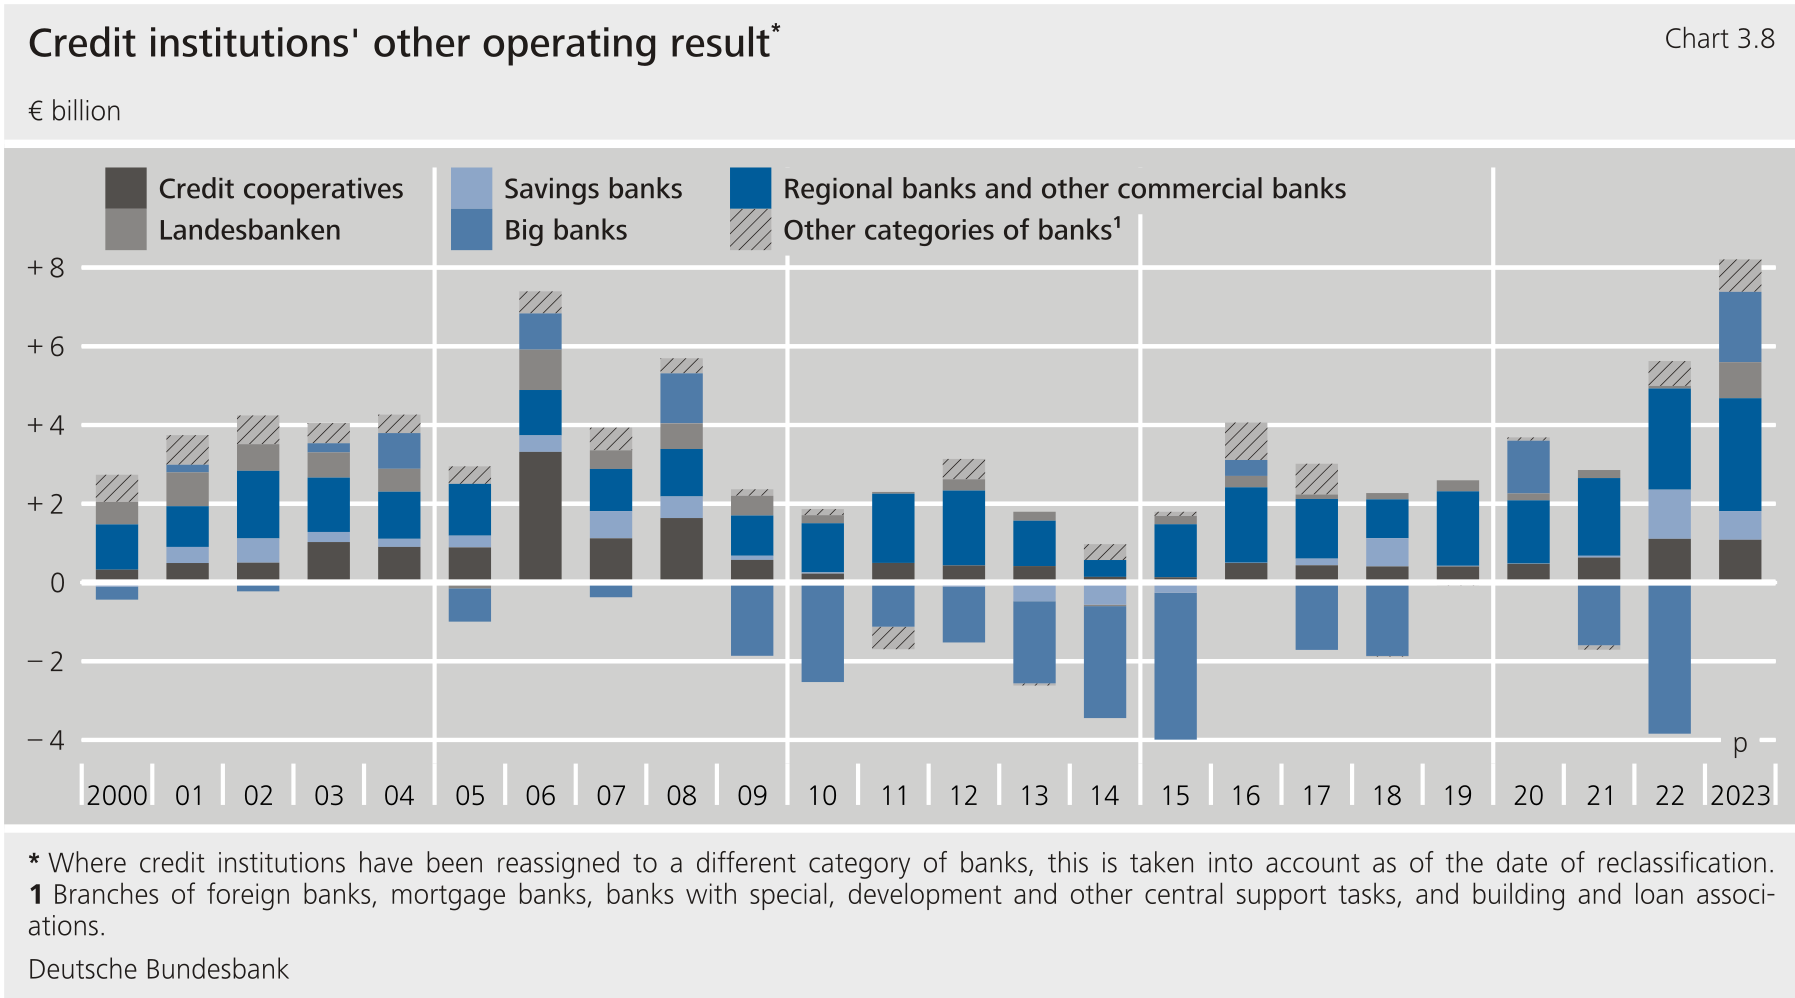
**The other operating result** [\[37\]](#_ftn_root_37)**recorded a very strong improvement compared with 2022 (+€6.4 billion/+359.7%).** This increase was almost exclusively driven by big banks. Their other operating result for 2023 was €5.6 billion higher than in the previous year. In comparison with 2022, big banks saw a significant decline in their other operating expenses, in particular. The Eurosystem's key interest rate hikes and the resulting higher interest rate level led, above all, to a reduction in transfers to provisions for pensions.{#par-oii5u2}
{#par-u75655}
#### 2.1.2 Net valuation charges
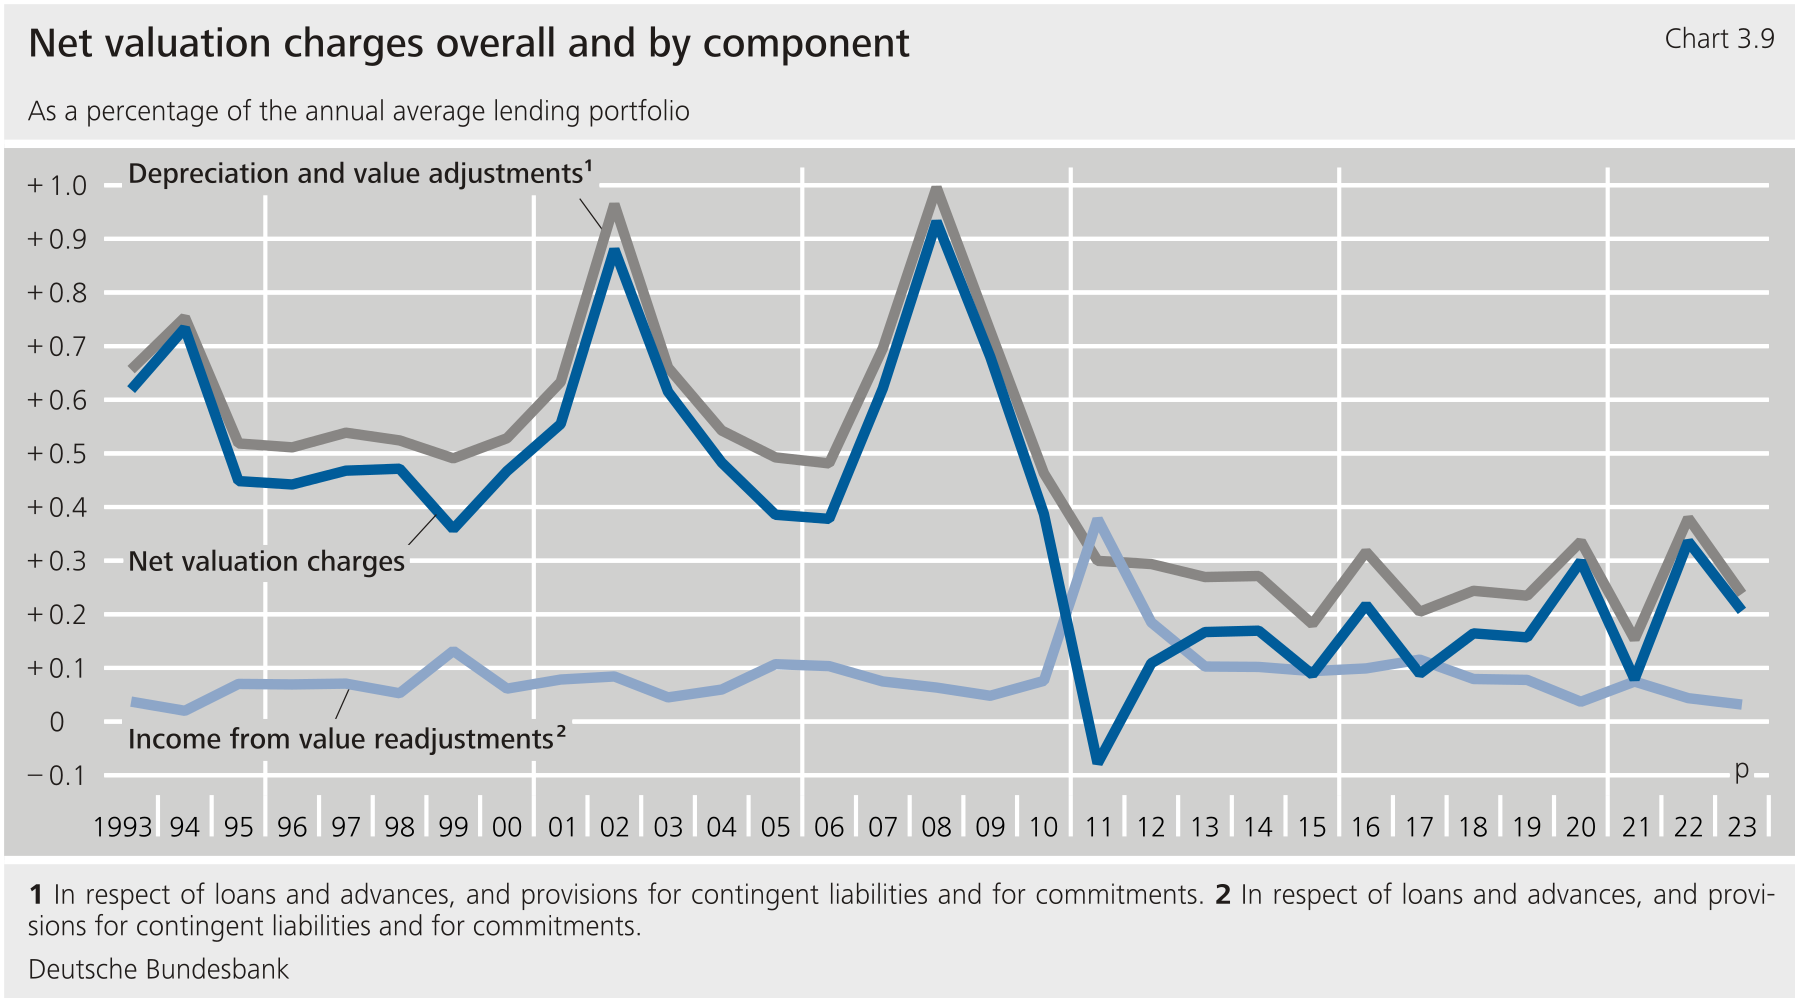
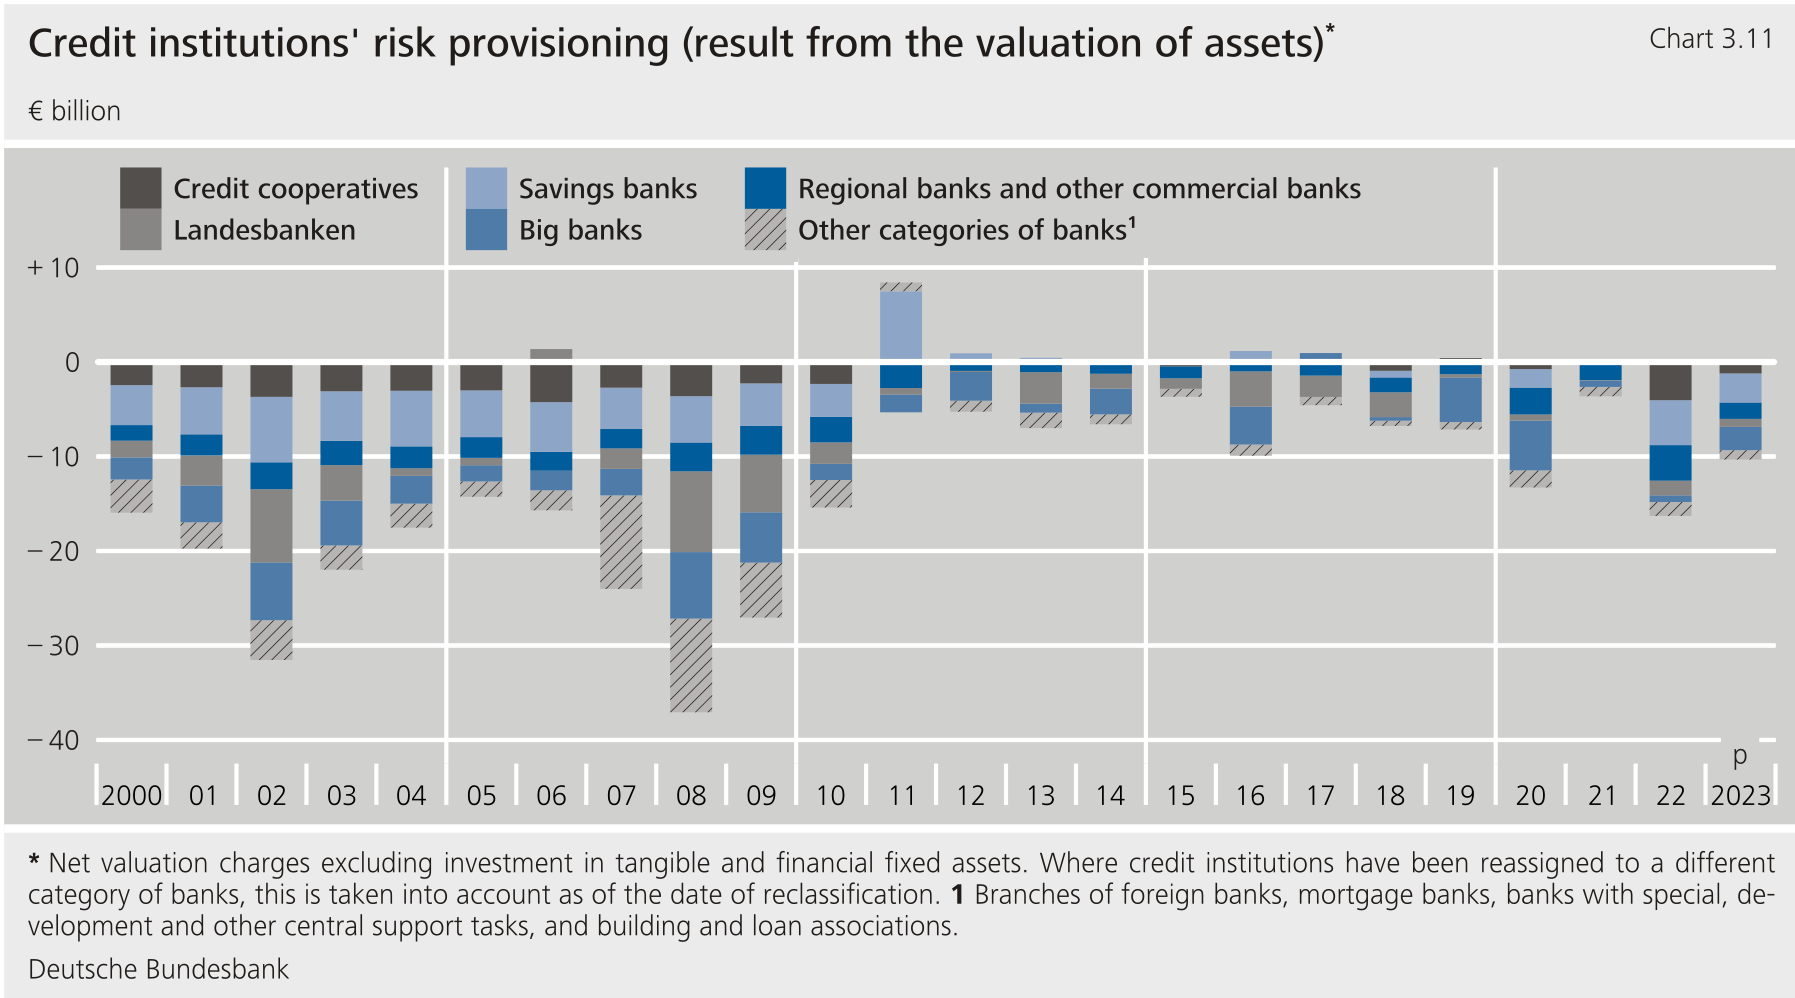
**German credit institutions' net valuation charges** [\[38\]](#_ftn_root_38)**declined by just over one-third compared with the previous year.** After the sharp increase in 2022, net valuation charges declined in the reporting year by €6.0 billion to €10.3 billion, thus falling under the long-term average of €13.5 billion. This decline was chiefly attributable to the lower depreciation of and value adjustments to loans and advances, and provisions for contingent liabilities and for commitments. At €11.9 billion in the reporting year, they were €6.5 billion lower than the previous year's figure and thus also below the long-term average of €17.2 billion. Compared with the previous year, a considerable decline could be seen in particular for write-downs on securities in the liquidity reserve, following a sharp increase in 2022 against the backdrop of the higher interest rate level. In addition, there were reversals of impairment losses on securities which had been written down in 2022 (for more information see the supplementary information on earnings effects since the interest rate reversal on securities held in German credit institutions' banking books). Nevertheless, a comparison of the categories of banks under consideration shows considerable differences.{#par-oee747}
{#par-i6595a}
Earnings effects since the interest rate reversal on securities held in German credit institutions' banking books
-----------------------------------------------------------------------------------------------------------------
**The interest rate reversal initiated in 2022 led to price losses, especially for interest-bearing securities held in German credit institutions' banking books.** [\[1\]](#_ftn_45d7a6c9_1) In terms of content and methodology, the following analysis is based on the box analysing earnings effects of the interest rate reversal on securities held in German credit institutions' banking books in 2022, which was included in the September 2023 Monthly Report as part of the article on the performance of German credit institutions in 2022.[\[2\]](#_ftn_45d7a6c9_2)This time, the focus is on developments in 2023. The analysis only covers the subset of German banks preparing their financial statements in accordance with the German Commercial Code (*Handelsgesetzbuch* ) for which an allocation of securities to fixed and current assets is possible at the individual institution level. This constituted around 1,143 of the total of 1,340 German banks in 2023. The subset is mainly composed of savings banks and credit cooperatives and, with average total assets amounting to roughly €5,061 billion in 2023, represents just under half of German banks'aggregate annual average total assets for the year.
**After significant losses in the 2022 calendar year, the German bond and equity markets saw price gains again in 2023.** These amounted to 1.3% on the bond market as measured by the German bond index (REX) and 16.5% on the equity market as measured by the German stock index (DAX). Chart 3.10 shows the effect of these movements on the valuation of securities held in German credit institutions' banking books. It depicts the stock of hidden losses and hidden reserves and the net valuation result from securities held in the liquidity reserve within a calendar year. The stock and the net valuation result are specified as a percentage of annual average total assets (left-hand panel), while the right-hand panel shows the market interest rate as a percentage. Funds which hold these financial instruments as underlying assets are also included under either "debt securities" or "equities".
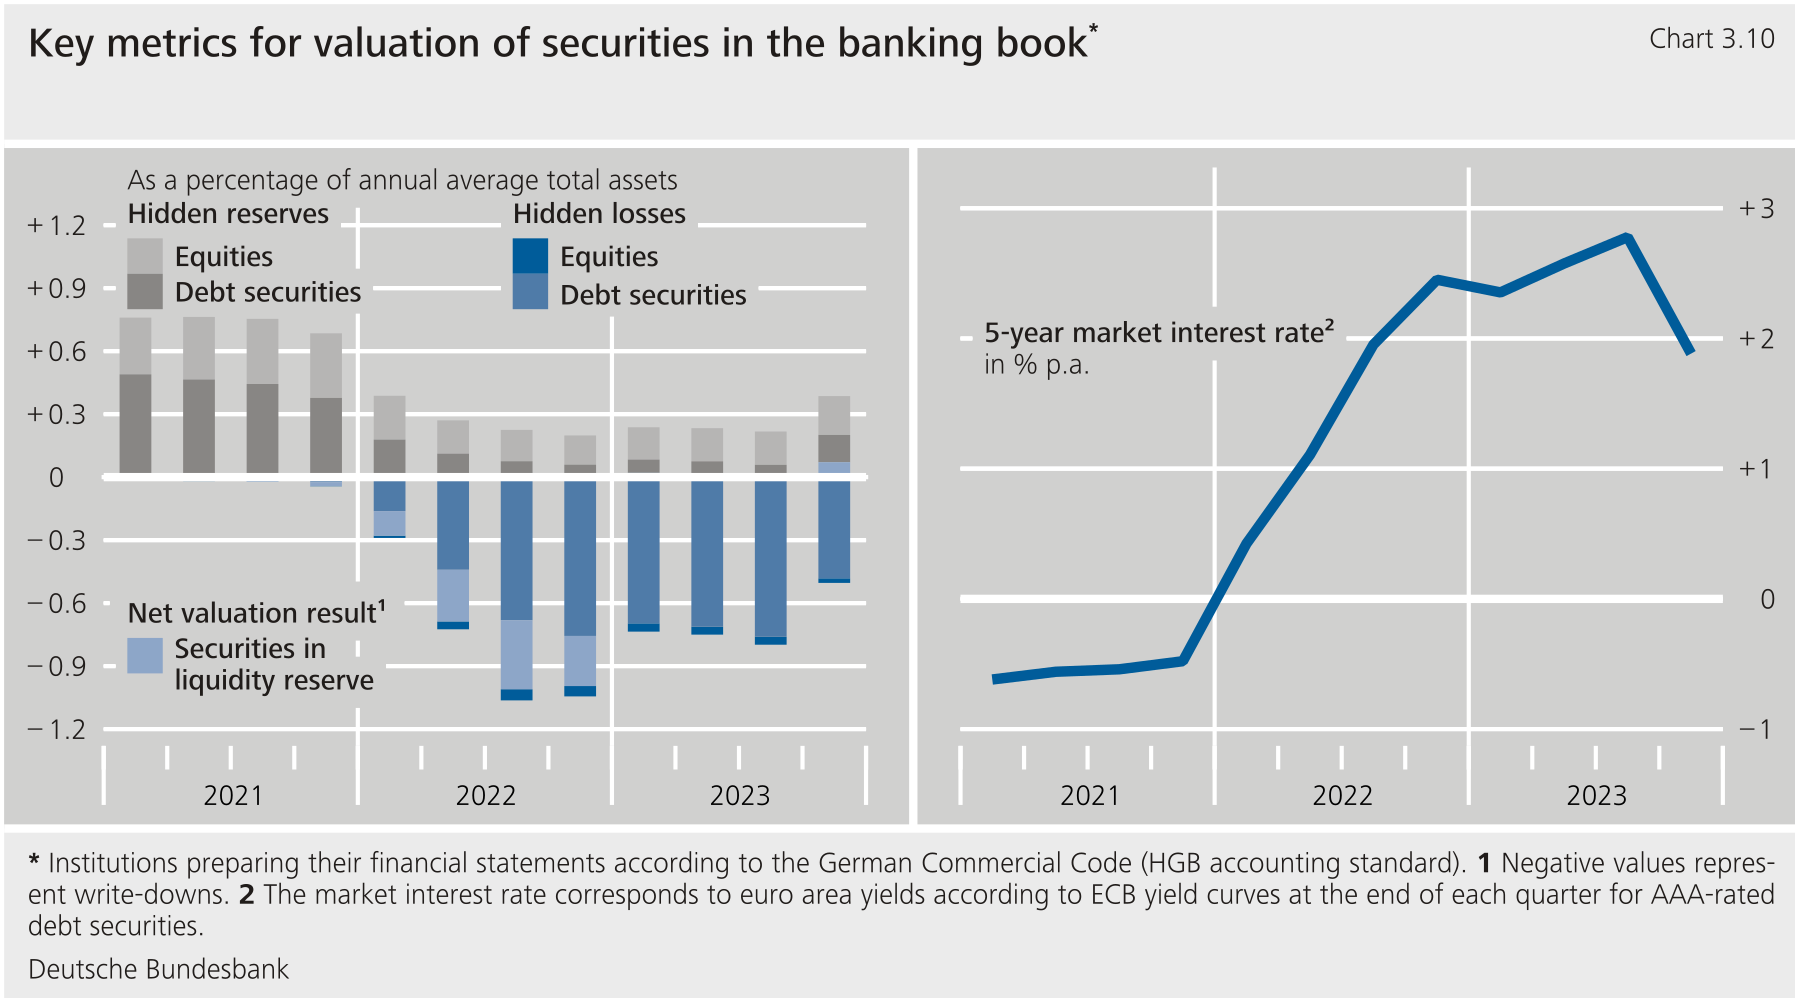
**In the year under review, German credit institutions' banking book securities were still assigned in roughly equal part to current assets (securities in the liquidity reserve) and to fixed assets.** Up to 2021, there was a consistent pattern of around one in three securities being allocated to fixed assets. This share increased significantly in 2022 -- mainly due to reclassification of some securities that had not yet reached maturity from current assets to fixed assets -- to just over 50% of securities in the banking book.[\[3\]](#_ftn_45d7a6c9_3) This share remained virtually the same in 2023.
**The net valuation result for securities in the liquidity reserve improved significantly over the course of 2023, although German credit institutions' hidden losses peaked in the third quarter of 2023.**The increase in market interest rates as a result of the Eurosystem's key interest rate hikes initially led to a further slight accumulation of hidden losses in debt securities in the first three quarters of 2023. However, a fall in market interest rates subsequently led to a decline in hidden losses created by the interest rate reversal in the fourth quarter of 2023 and ultimately to an increase in hidden reserves. The net valuation result for securities in the liquidity reserve improved over the course of 2023 overall and was particularly positive in the fourth quarter of 2023.
**Only one-seventh of positive price changes were booked in the profit and loss statement in 2023.** From the total price gains amounting to 0.49% of annual average total assets, only 0.07 percentage point were recognised in the income statement of German banks as reversals of write-downs on securities classified as current assets. The effect of positive price changes, however, was largely reflected in the decline in hidden losses (around two-thirds or 0.3 percentage point) and in the rise in hidden reserves (around one-quarter or 0.12 percentage point).
**In addition to the decline in the market interest rate, the pull-to-par effect is likely to have positively impacted the performance.** The market value of a fixed-interest security gradually converges to its redemption value (par value) as the maturity date approaches. In 2023, corresponding price gains for debt securities that had posted losses in 2022 led to a decline in hidden losses, a build-up of hidden reserves or a visibly positive contribution to the net valuation result.[\[4\]](#_ftn_45d7a6c9_4) According to an estimate in the Bundesbank's 2023 Financial Stability Review, 68% of the valuation losses for debt securities in 2022 are likely to be offset by 2027 due to the pull-to-par effect.[\[5\]](#_ftn_45d7a6c9_5)
1. {#_ftn_45d7a6c9_1} The banking book comprises all on-balance and off-balance sheet items in financial instruments and commodities outside the trading book in accordance with the European Regulation on prudential requirements for credit institutions and investment firms ((EU) No 575/2013). Trading book positions are held with trading intent or serve as a hedge for positions held with trading intent. Securities include tradable financial instruments such as debt securities and shares.
2. {#_ftn_45d7a6c9_2} See the box entitled "Earnings effects of the interest rate reversal on securities held in German credit institutions' banking books", Deutsche Bundesbank (2023f), pp. 105 f.
3. {#_ftn_45d7a6c9_3} See the box entitled "Earnings effects of the interest rate reversal on securities held in German credit institutions' banking books", Deutsche Bundesbank (2023f), pp. 105 f.
4. {#_ftn_45d7a6c9_4} The point in time at which price gains can be recognised in profit or loss is dependent on the chosen valuation approach. The less strict lower of cost or market principle is applied for fixed assets, which means a contribution to earnings is not possible until the asset is sold or the principal repaid. The liquidity reserve is subject to the strict lower of cost or market principle, which requires a reversal of write-down to be recognised directly in profit or loss, as long as the amortised costs are not exceeded.
5. {#_ftn_45d7a6c9_5} See Deutsche Bundesbank (2023a), p. 38.
**In contrast to overall developments, net valuation charges at big banks were more than three times the previous year's figure (+248.2%).** At big banks, there was an increase in the depreciation of and value adjustments to loans and advances, and provisions for contingent liabilities and for commitments of 54.3% on the year. This increase was driven predominantly by large write-downs at one institution belonging to the big banks category.{#par-ai5373}
**A sharp decline in net valuation charges was recorded above all by savings banks and credit cooperatives (savings banks: −35.3%, credit cooperatives: −70.2%).** [\[39\]](#_ftn_root_39) Both savings banks and credit cooperatives reduced depreciation of and value adjustments to loans and advances, and provisions for contingent liabilities and for commitments (savings banks: −30.5%, credit cooperatives: −58.6%). At the same time, income from value readjustments to loans and advances, and provisions for contingent liabilities and for commitments increased on the year (savings banks: +28.5%, credit cooperatives: +150.7%). Savings banks and credit cooperatives primarily realised reversals of impairment losses on securities which had been written down in 2022.{#par-i29611}
**Net valuation charges also more than halved at regional and other commercial banks (-53.8%).** They reported depreciation of and value adjustments to loans and advances, and provisions for contingent liabilities and for commitments that amounted to less than half of the previous year'sfigure (-52.9%).{#par-o81154}
**Taken together, regional and other commercial banks, savings banks and credit cooperatives were responsible for virtually the entire decline in net valuation charges on aggregate for all German credit institutions.** In total, just under 67% of the institutions under review reported lower net valuation charges. Going forward, however, net valuation charges could rise again in the coming years owing to current developments in lending business. For example, a significant increase in net transfers to the fund for general banking risks was already observed in the year under review (+11.3 billion or +391%). This indicates that institutions used the good earnings situation in 2023 to prepare themselves for rising net valuation charges (for more information on this, see the supplementary information on the development of non-performing loans in the German banking sector).{#par-oi4695}
{#par-ie7a69}
The development of non-performing loans in the German banking sector
--------------------------------------------------------------------
**The sharp increase in the interest rate level following the end of the period of low interest rates, structural adjustments in the commercial real estate market, and economic developments, which have been subdued at times, are now being reflected in the development of German institutions' non-performing loans (NPL).** The NPL ratio -- i.e. the ratio of loans that are, for the most part, more than 90 days past due or for which it is considered unlikely that the debt vis-à-vis the institution will be repaid in full, to total loans[\[1\]](#_ftn_486c9525_1) -- has risen from a low level since the end of 2022 and stood at 1.6% in the first quarter of 2024.[\[2\]](#_ftn_486c9525_2)
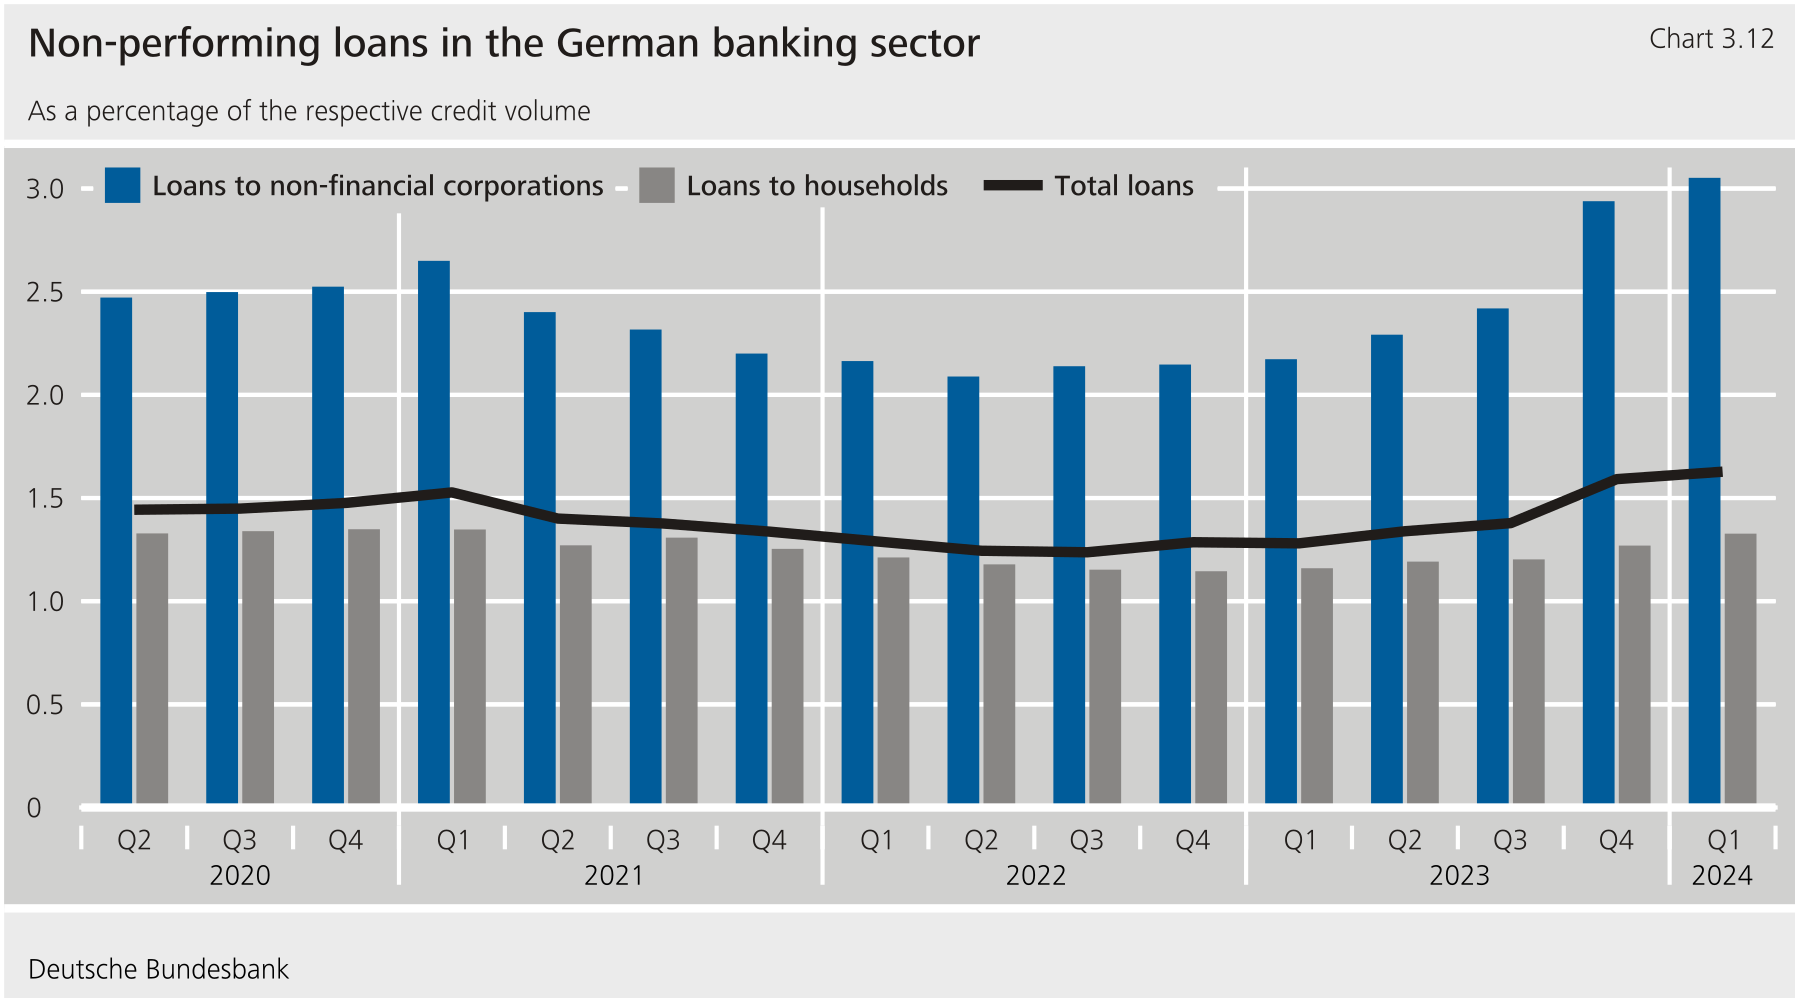
**Loans to households have thus far played a minor role in this development.** Although they account for around 36% of the loans issued by German credit institutions,[\[3\]](#_ftn_486c9525_3) a large proportion of loans to households are loans for house purchase. The long interest rate fixation periods customary in residential real estate lending in Germany initially protect borrowers from an increase in debt service during a phase of rising interest rates.[\[4\]](#_ftn_486c9525_4) However, looking ahead, higher credit risk could also materialise in this segment and ultimately impact the performance of German credit institutions if debt servicing costs rise as a result of higher interest rates and are more difficult to shoulder. Furthermore, if credit risk were to materialise on a broad basis, the impact would be considerable given the share of loans for house purchase in German credit institutions' total loans.[\[5\]](#_ftn_486c9525_5) Nevertheless, in view of the lead time that such a development could potentially entail, banks have the opportunity to build up sufficient reserves over time and thus cushion potential losses. This would also stagger the impact on the performance of German credit institutions. Given that the labour market has also proved relatively robust thus far,[\[6\]](#_ftn_486c9525_6) the NPL ratio for loans secured by residential real estate[\[7\]](#_ftn_486c9525_7) remained at a low level in the first quarter of 2024, standing at 0.8%.
A significantly smaller share of only around 11% of loans to households is attributable to consumer credit.[\[8\]](#_ftn_486c9525_8) Accordingly, NPL developments in this line of business have less of an impact on the performance of German credit institutions. Although consumer credit tends to be associated with higher risks as these loans are primarily granted to borrowers with lower incomes and small financial reserves, only a slight increase in the NPL ratio has been observed so far over the past few quarters.[\[9\]](#_ftn_486c9525_9) This is also because the labour market has proved robust to date.
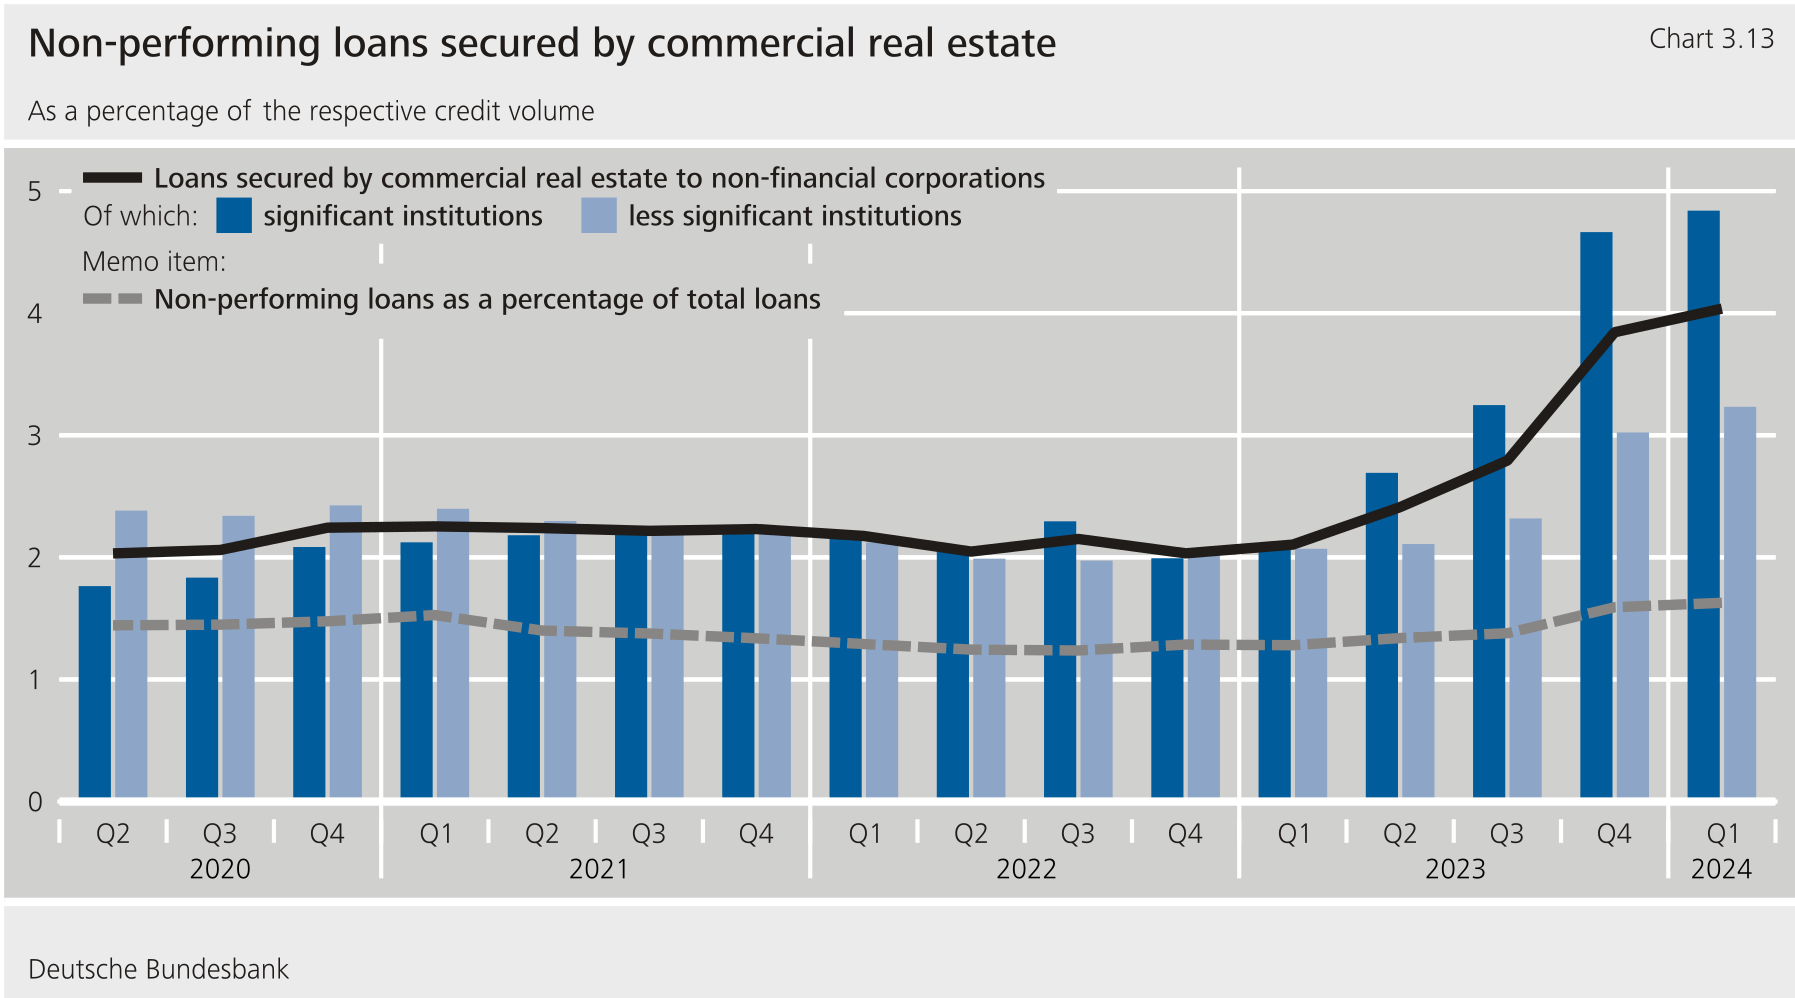
**While the NPL ratio for the portfolio of loans to households has been relatively constant thus far, the NPL ratio for loans to non-financial corporations has grown slightly over recent quarters to 3.1%.** This increase is being driven by loans secured by commercial real estate in particular, which make up around one-third of loans to non-financial corporations. The NPL ratio for loans secured by commercial real estate to non-financial corporations increased by 1.9 percentage point within four quarters to stand most recently at 4.0 % in the first quarter of 2024.
The fact that developments in commercial real estate loans differ from those in the residential real estate segment is attributable to various factors. First, the interest rate fixation periods for commercial real estate loans are significantly shorter than in the residential real estate segment. Second, real estate enterprises' debt-servicing capacity has fallen markedly due to recognised valuation losses.[\[10\]](#_ftn_486c9525_10) Added to this are structural changes in the market as a result of the reduction in the need for office and other commercial spaces. Follow-up financing and project development loans, in particular, currently present risks for banks. Follow-up financing in the current interest rate environment tends to entail considerably higher interest rates, which could overwhelm borrowers' debt-servicing capacity. 60% of the stock of commercial real estate loans still have interest rates of below 3%.
**The rise in the NPL ratio for commercial real estate loans observed since the beginning of 2023 is largely attributable to significant institutions,** [\[11\]](#_ftn_486c9525_11)**not least due to their credit exposures in the United States.** [\[12\]](#_ftn_486c9525_12) However, the NPL ratio for commercial real estate loans also rose for less significant institutions recently. Loans to non-financial corporations secured by commercial real estate account for roughly 12% of total loans.[\[13\]](#_ftn_486c9525_13) The impact on the performance of German credit institutions could therefore be noticeable, depending on the extent to which credit risk ultimately materialises -- also given the sharp drop in collateral values caused by the downturn in the real estate market.
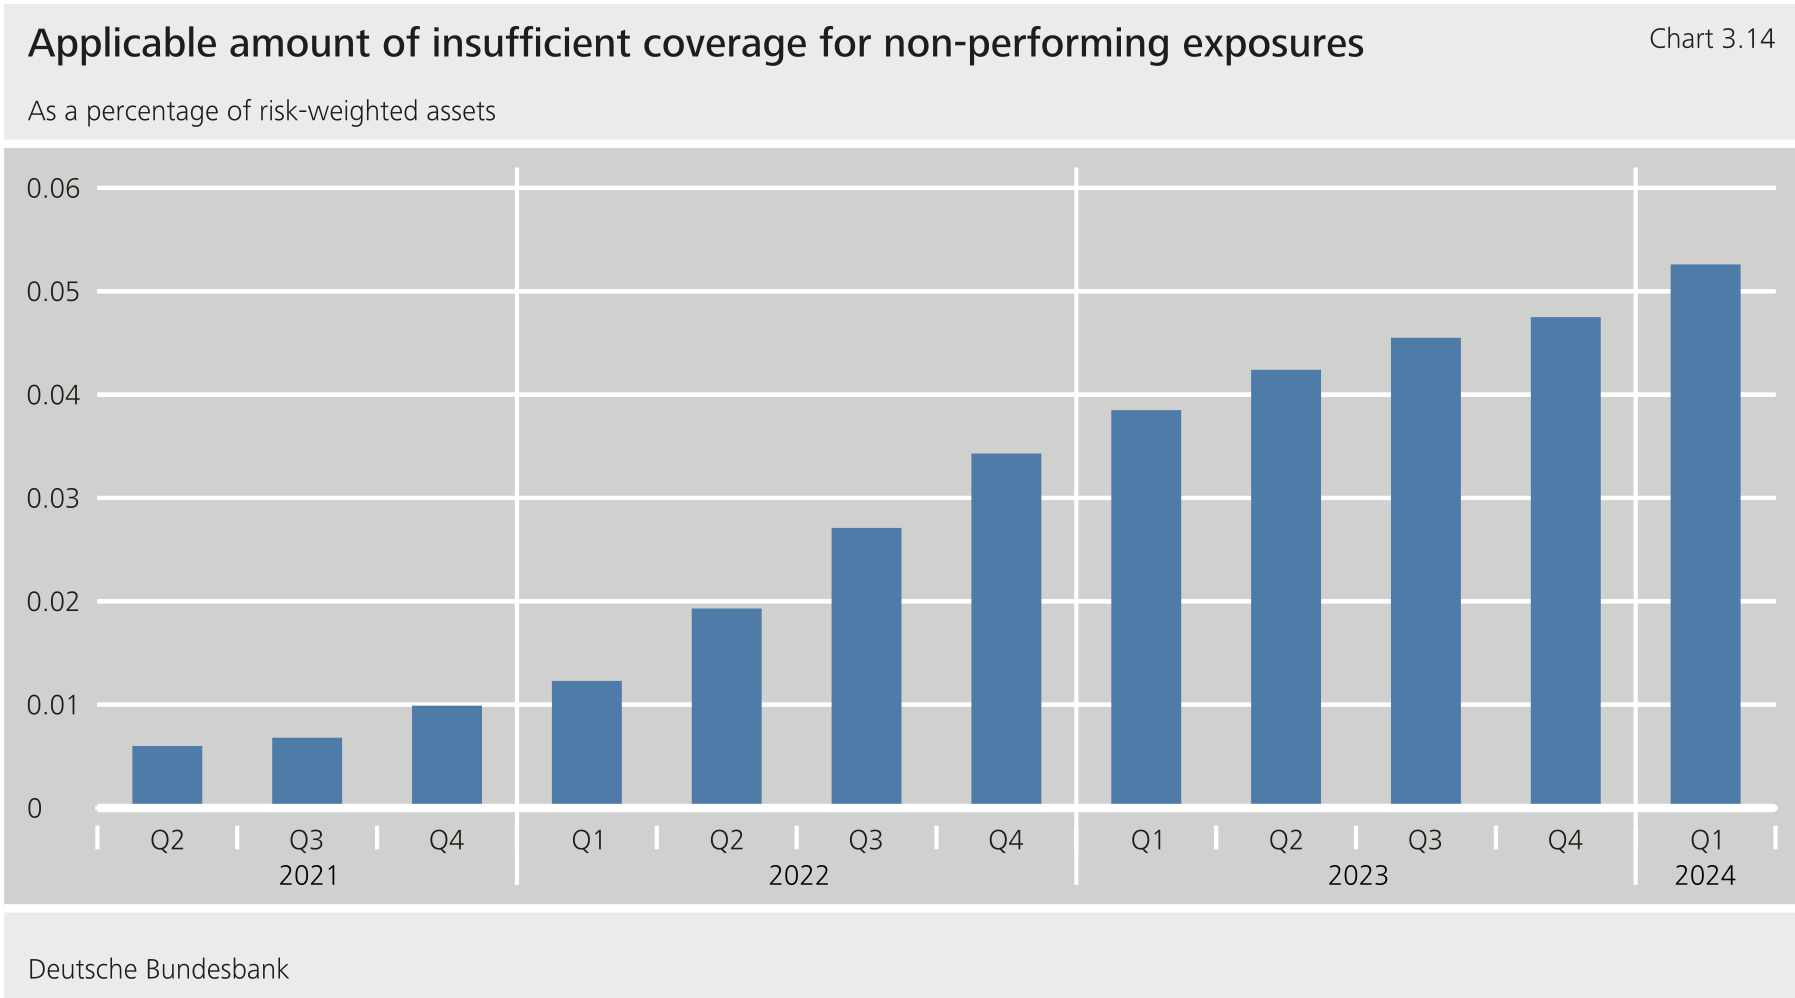
**An important contribution to enhancing the resilience of the financial system is made by the prudential backstop for non-performing exposures that was introduced around five years ago in Europe.** [\[14\]](#_ftn_486c9525_14) This provides for a gradual increase in the minimum loss coverage for non-performing exposures originated from 26 April 2019 onwards depending on their credit protection. Institutions can fulfil the required minimum loss coverage via specific credit risk adjustments, additional value adjustments, other reductions in own funds or by meeting further specific conditions. Alternatively, the applicable amount of insufficient coverage is to be deducted from an institution's Common Equity Tier 1 items.[\[15\]](#_ftn_486c9525_15)
Given the backstop's design, an increase in the average deduction item (in relation to risk-weighted assets) was observed, as anticipated, from the backstop's effective entry into force. However, the capital deduction only accounted for around 0.05% of German institutions' risk-weighted assets in the first quarter of 2024.[\[16\]](#_ftn_486c9525_16) Should the deduction item increase further, this is likely to reduce capital resources in the coming years. If, instead, an institution raises its impairment losses recorded in net valuation charges to fulfil the minimum loss coverage and to avoid the capital deduction, the backstop could also have a greater direct impact on the institution's performance in future.
**Although net valuation charges sank overall in the 2023 reporting year, it is expected that** **net valuation charges will continue to negatively affect profitability in 2024, too, given the developments and uncertainties outlined above.**The decline on the year recorded by savings banks and credit cooperatives, which had a major impact on overall developments, should be viewed in the context of the strong rise in net valuation charges observed in 2022 due to high losses stemming from the increased interest rate level and the resulting write-downs on securities in the liquidity reserve. Furthermore, a significant increase in net transfers to the fund for general banking risks was already observed in the year under review (+11.3 billion or +391%). Net transfers amounted to €14.1 billion and were therefore considerably above the long-term average of just under €6 billion. This indicates that institutions used the good earnings situation in 2023 to prepare themselves for rising net valuation charges.
1. {#_ftn_486c9525_1} Stock of loans to non-financial corporations, households, general government, central banks, credit institutions and other financial institutions. The definition of non-performing exposures (NPEs) is based on Article 47a(3) of the Capital Requirements Regulation (CRR).
2. {#_ftn_486c9525_2} If not stated separately, this supplementary information considers all data in Germany from institutions -- excluding branches of foreign banks -- that report under the harmonised financial reporting (FINREP) framework in Europe. Where available, consolidated group reports from all institutions are used to form the aggregate. The aggregation methodology only draws on individual reports in the case of institutions that are not part of a reporting group or that do not submit a group report themselves. Institutions that are part of a reporting group are therefore excluded from the aggregate.
3. {#_ftn_486c9525_3} Prudential reporting (FINREP) data; average of the quarterly data for 2023.
4. {#_ftn_486c9525_4} Furthermore, during the low interest rate period, households and lenders agreed interest rate fixation periods that were considerably longer still. See Deutsche Bundesbank (2023a), pp. 51 f.
5. {#_ftn_486c9525_5} For instance, according to prudential reporting (FINREP) data, for 2023, loans to households secured by residential real estate accounted for around 28% of the total loans issued by the German institutions under review.
6. {#_ftn_486c9525_6} The labour market remained stable over the past two years despite the cyclical weakness, with both employment and unemployment rising slightly of late. Actual earnings recorded strong growth of around 6% in both 2023 and 2024. See Deutsche Bundesbank (2024e).
7. {#_ftn_486c9525_7} Ratio of non-performing loans to households secured by residential real estate to total loans to households secured by residential real estate.
8. {#_ftn_486c9525_8} Prudential reporting (FINREP) data; average of the quarterly data for 2023.
9. {#_ftn_486c9525_9} See Deutsche Bundesbank (2023a), pp. 52 f. The NPL ratio for consumer credit (ratio of non-performing consumer loans to total consumer loans) stood at 3.8% in the first quarter of 2024, having therefore risen by only around 0.3 percentage point over the last eight quarters up to that time.
10. {#_ftn_486c9525_10} See Deutsche Bundesbank (2023a), p. 62.
11. {#_ftn_486c9525_11} Credit institutions directly supervised by the ECB. This section and the following analysis also take into account subsidiaries of foreign significant institutions operating in Germany.
12. {#_ftn_486c9525_12} US commercial real estate loans only account for a one-digit percentage share of all loans secured by commercial real estate to non-financial corporations in German banks' portfolios overall and are concentrated on individual larger institutions.
13. {#_ftn_486c9525_13} Prudential reporting (FINREP) data; average of the quarterly data for 2023.
14. {#_ftn_486c9525_14} See Regulation (EU) 2019/630 of the European Parliament and of the Council of 17 April 2019 amending Regulation (EU) No 575/2013 as regards minimum loss coverage for non-performing exposures.
15. {#_ftn_486c9525_15} Alongside the type of credit protection, the minimum loss coverage level is based on how long the exposure has been classified as non-performing. The longer an exposure is non-performing, the higher the required minimum loss coverage is. This approach is not applied to exposures originated before 26 April 2019.
16. {#_ftn_486c9525_16} Taking into account all data in Germany from institutions (including guarantee banks, for instance) -- excluding branches of foreign banks -- that report under the common reporting (COREP) framework in Europe at the highest respective level of consolidation.
#### 2.1.3 Administrative spending
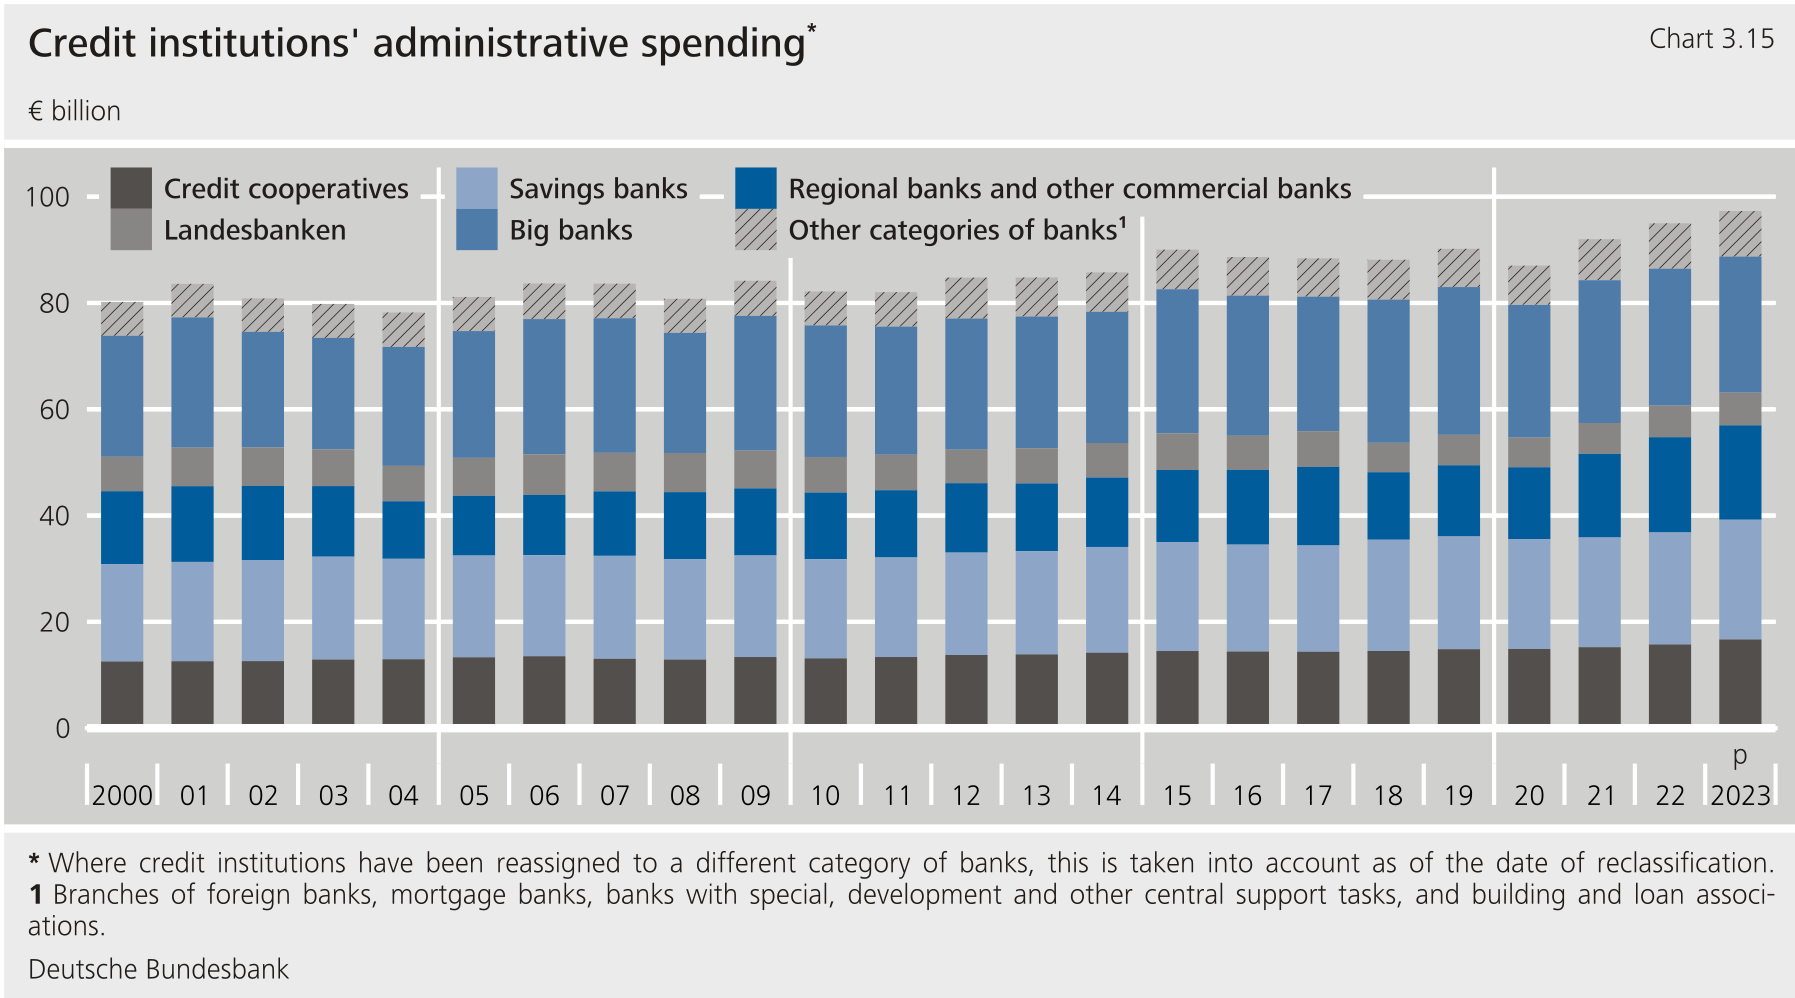
**General administrative spending** [\[40\]](#_ftn_root_40)**rose by 2.4% in the reporting year and therefore less strongly than in the preceding year.** [\[41\]](#_ftn_root_41) Growth also remained far below the rise in the general price level. Unlike in the previous year, the overall increase in 2023 was primarily attributable to other administrative spending, which grew by 4.6%. By contrast, staff costs remained at their 2022 level. However, this had no notable impact on the respective shares of total administrative spending. Staff costs and other administrative spending each continued to account for half of total spending.{#par-ee9164}
**In the case of staff costs, various countervailing effects came together and virtually cancelled each other out on aggregate.**The increase in wages and salaries of €1.6 billion (+4.4%), for instance, was offset overall by an almost equal decrease in social security costs and costs relating to pensions of €1.5 billion (-12.3%). On the one hand, wages and salaries rose against the backdrop of high inflation, whilst on the other hand, some German credit institutions cut staff and made lower pension provisions than in previous years due to the changed interest rate environment.{#par-i3o856}
**Other administrative spending grew on aggregate due to two main reasons:** first, it reflected the general rise in prices caused by inflation. Second, German banks stepped up their investment in digitalisation and information security.{#par-o751i5}
**Differing developments were observed when comparing categories of banks, however.** General administrative spending decreased slightly, by 0.6% at big banks and by 0.9% at regional banks and other commercial banks. Viewed in absolute terms, staff costs declined more strongly than other administrative spending rose in both categories of banks. By contrast, general administrative spending at savings banks and credit cooperatives recorded significant growth of 6.9% and 6.0%, respectively. Unlike big banks, regional banks and other commercial banks, savings banks and credit cooperatives recorded increases in both staff costs and in other administrative spending.{#par-eua2a9}
{#par-ui5o2a}
#### 2.1.4 Balance in the other and extraordinary account
**The balance in the other and extraordinary account** [\[42\]](#_ftn_root_42)**deteriorated significantly in 2023.** Net charges in the other and extraordinary account rose by €5.5 billion, which almost completely offset the decline in net valuation charges. Overall, net charges in the other and extraordinary account increased in the reporting year to more than triple the figure from 2022 and, at €7.9 billion, stood at the level of the long-term average.{#par-e5ieoi}
**This deterioration was primarily driven by big banks.** In the previous year, a one-off effect[\[43\]](#_ftn_root_43) at an institution in the category of big banks had significantly reduced net charges in the other and extraordinary account.A comparable one-off effect did not occur in 2023, causing big banks' net charges to go up by €4.5 billion. Furthermore, regional banks and other commercial banks reported a rise in net charges of €2.3 billion in the other and extraordinary account in the year under review. This increase resulted primarily from higher extraordinary charges at one institution in the category of banks. This institution recorded profits transferred under profit pooling, a profit transfer agreement or a partial profit transfer agreement that were €1.7 billion higher than in the previous year. By contrast, savings banks reported a considerable improvement in their other and extraordinary account balance. Net charges here went down by €1.5 billion because depreciation of and value adjustments to participating interests, shares in affiliated enterprises and securities treated as fixed assets declined on the year.{#par-u31o18}
| **Table 3.3: Breakdown of extraordinary result** € million ||||
| Item | 2021 | 2022 | 2023^p^ |
| Other and extraordinary result | - 3,547 | - 2,475 | - 7,941 |
| Income (total) | 5,720 | 6,155 | 2,650 |
| Value readjustments to participating interests, shares in affiliated enterprises, and securities treated as fixed assets | 2,144 | 5,175 | 1,570 |
| from loss transfers | 1,210 | 33 | 26 |
| Extraordinary income | 2,366 | 947 | 1,054 |
| Charges (total) | - 9,267 | - 8,630 | - 10,591 |
| Depreciation of and value adjustments to participating interests, shares in affiliated enterprises, and securities treated as fixed assets | - 1,494 | - 3,424 | - 2,519 |
| from loss transfers | - 318 | - 566 | - 479 |
| Extraordinary charges | - 3,585 | - 983 | - 753 |
| Profits transferred under profit pooling, a profit transfer agreement or a partial profit transfer agreement | - 3,870 | - 3,657 | - 6,840 |
|--------------------------------------------------------------------------------------------------------------------------------------------|---------|---------|----------|
{#par-eu7a83}
### 2.2 Profitability and cost efficiency
Measured by the return on assets and the cost/income ratio, the profitability as well as cost efficiency of German banks improved considerably. In the reporting year, the highest figures seen over the last 25 years were achieved for both metrics.{#par-e93e7o}
#### 2.2.1 Return on assets
**Compared with the previous year, the return on assets** [\[44\]](#_ftn_root_44)**of German credit institutions virtually doubled to 0.46% in 2023.** [\[45\]](#_ftn_root_45)A similarly high figure (0.44%) was last recorded in 2005. With annual average total assets having only increased slightly, this improvement was almost exclusively down to growth in profit for the financial year before tax. Furthermore, it was not just the return on assets for German banks as an aggregate that rose; the return on assets went up for all of the categories of banks under consideration.[\[46\]](#_ftn_root_46){#par-a228a6}
{#par-eo9i33}
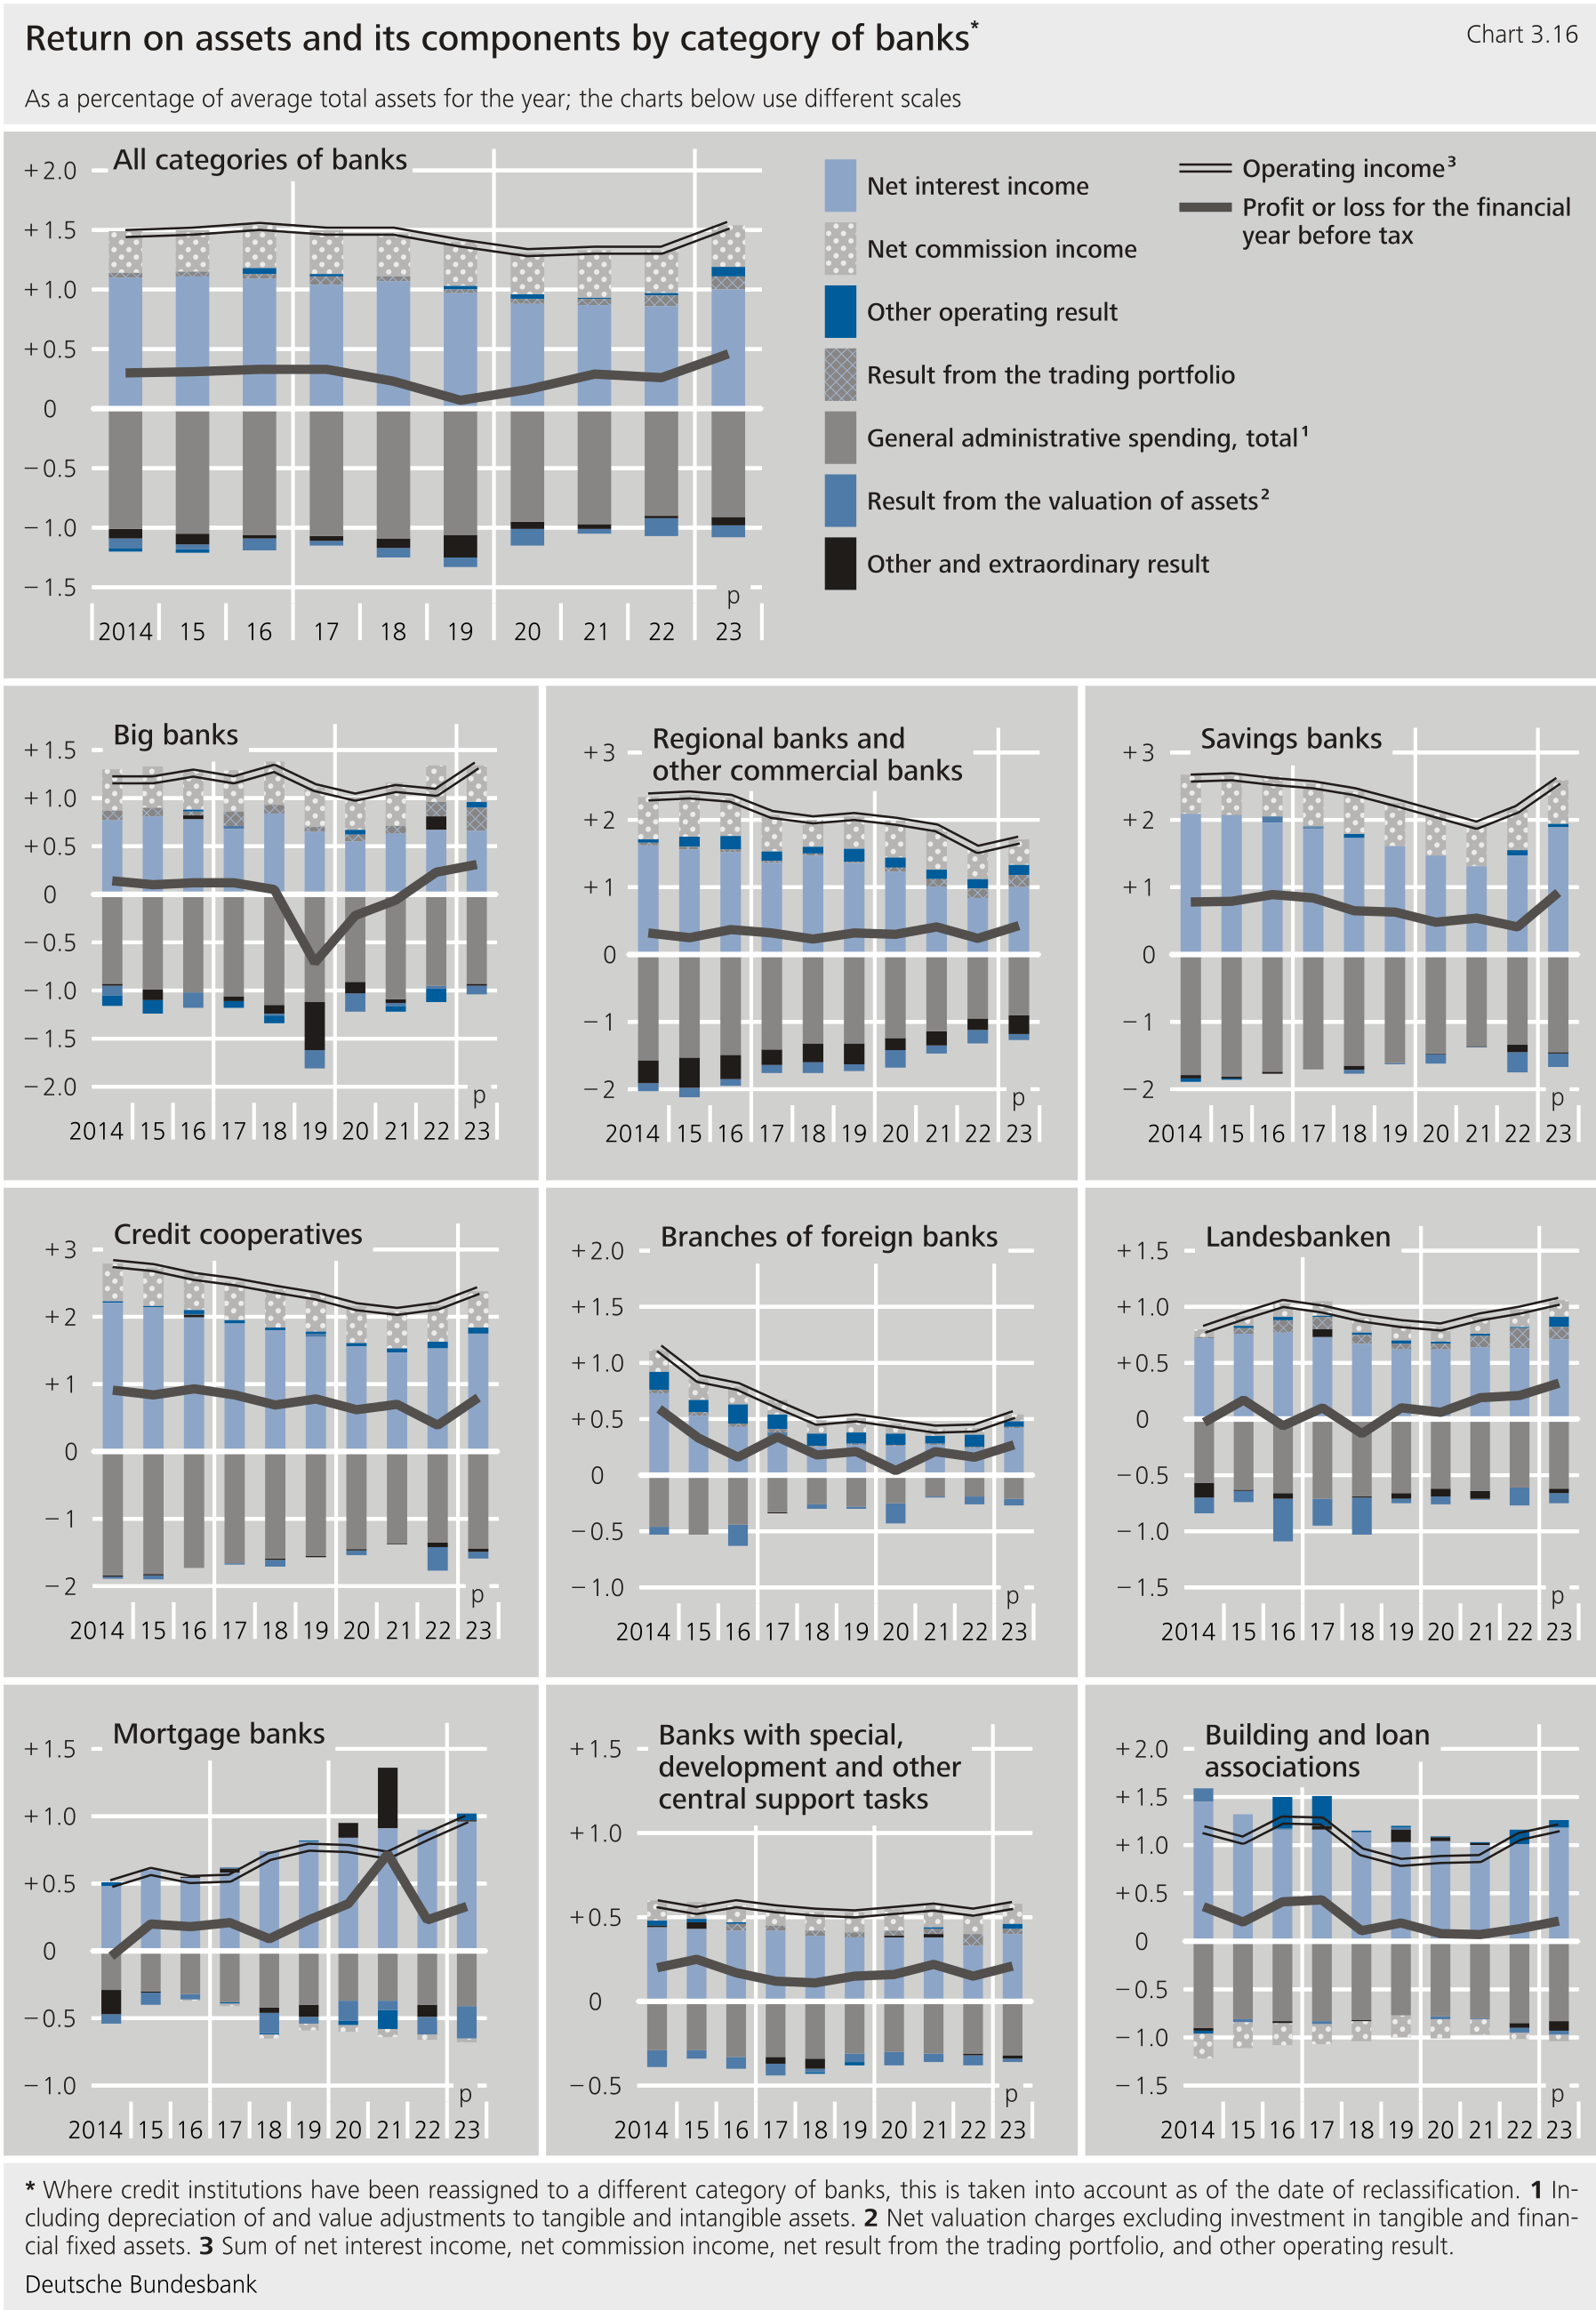
**Savings banks and credit cooperatives registered the most considerable improvement in their return on assets in the year under review.** Compared with the previous year, both categories of banks were able to more than double their return on assets, with increases of 0.51 and 0.41 percentage point, respectively. As a result, savings banks' return on assets amounted to 0.92% in 2023 and that of credit cooperatives came to 0.80% -- these were the highest figures amongst all the categories of banks under consideration.{#par-u5o541}
**Regional banks and other commercial banks were also able to improve their profitability substantially in the reporting year.** After rising by 0.19 percentage point to 0.43%, their return on assets in 2023 stood at roughly the same level as the aggregate of all German banks.{#par-a14u88}
**By contrast, big banks' return on assets grew by only 0.08 percentage point.** The return on assets of 0.31% that they therefore achieved for 2023 was also far below the average across all German credit institutions.{#par-i19a57}
{#par-e43397}
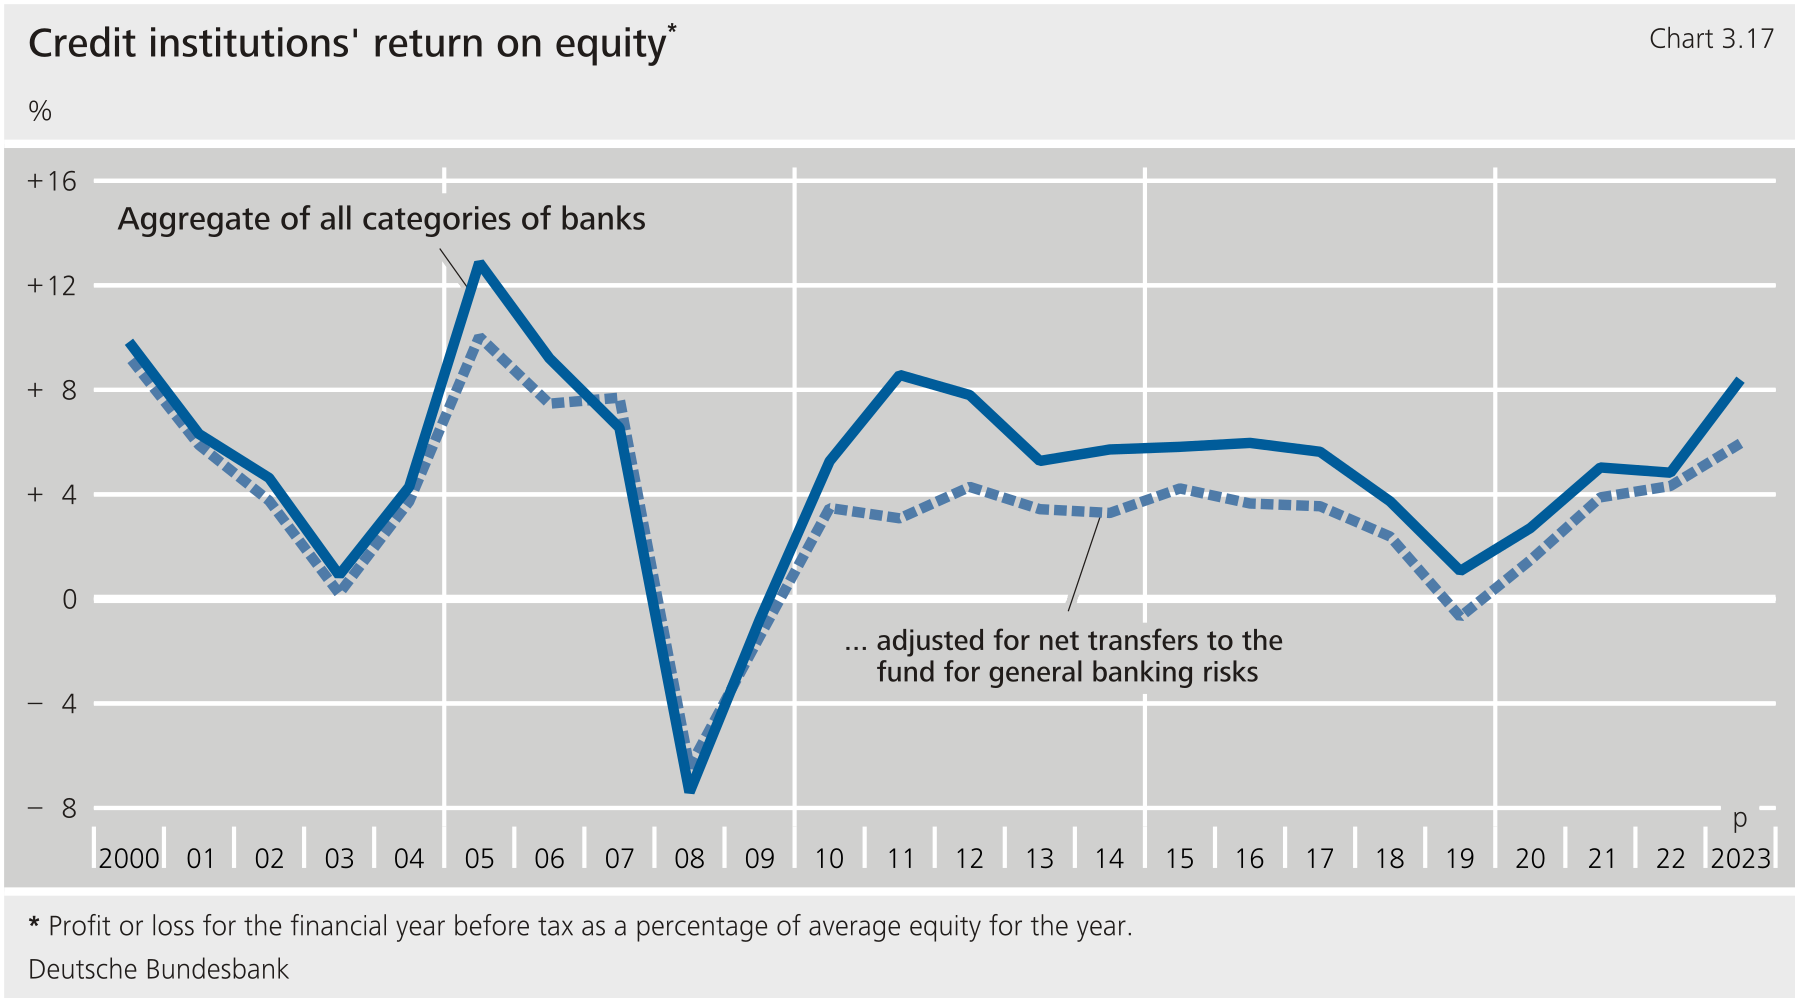
| **Table 3.4: Return on equity of individual categories of banks\*** % |||||||||||
| Category of banks | 2019 || 2020 || 2021 || 2022 || 2023^p^ ||
| All categories of banks | 1.07 | (- 0.41) | 2.71 | (1.12) | 5.03 | (3.22) | 4.83 | (3.86) | 8.39 | (6.21) |
| Commercial banks | - 7.70 | (- 8.99) | - 1.56 | (- 2.95) | 2.65 | (1.41) | 6.05 | (5.97) | 9.22 | (7.07) |
| Big banks | - 16.63 | (- 17.58) | - 7.08 | (- 8.22) | - 2.26 | (- 2.13) | 9.12 | (12.29) | 12.12 | (11.91) |
| Regional banks and other commercial banks | 4.44 | (2.69) | 4.10 | (2.46) | 6.00 | (3.81) | 4.27 | (2.25) | 7.58 | (4.24) |
| Landesbanken | 2.03 | (1.55) | 1.29 | (0.84) | 4.02 | (2.26) | 4.77 | (2.72) | 7.45 | (5.01) |
| Savings banks | 6.86 | (4.83) | 5.36 | (3.36) | 6.27 | (4.22) | 4.74 | (2.82) | 10.22 | (7.15) |
| Credit cooperatives | 9.17 | (6.57) | 7.31 | (4.98) | 8.37 | (6.19) | 4.59 | (3.46) | 8.92 | (6.47) |
| Mortgage banks | 5.31 | (3.75) | 8.06 | (1.40) | 16.91 | (5.73) | 5.99 | (3.76) | 8.89 | (5.69) |
| Building and loan associations | 3.83 | (2.95) | 1.66 | (0.86) | 1.41 | (0.50) | 2.79 | (1.65) | 4.14 | (1.99) |
|-------------------------------------------|---------|-----------|--------|----------|--------|----------|------|---------|-------|---------|
{#par-a3o9o7}
#### 2.2.2 Cost efficiency
**In the reporting year, the cost/income ratio in its broad definition** [\[47\]](#_ftn_root_47)**improved by just over 8 percentage points to 59.2% and thus stood far below the long-term average of 67.8%.** As in the previous year, this improvement was primarily caused by the rise in operating income, which was approximately ten times as strong as the rise in general administrative spending in 2023.{#par-e34a2u}
{#par-i43uoa}
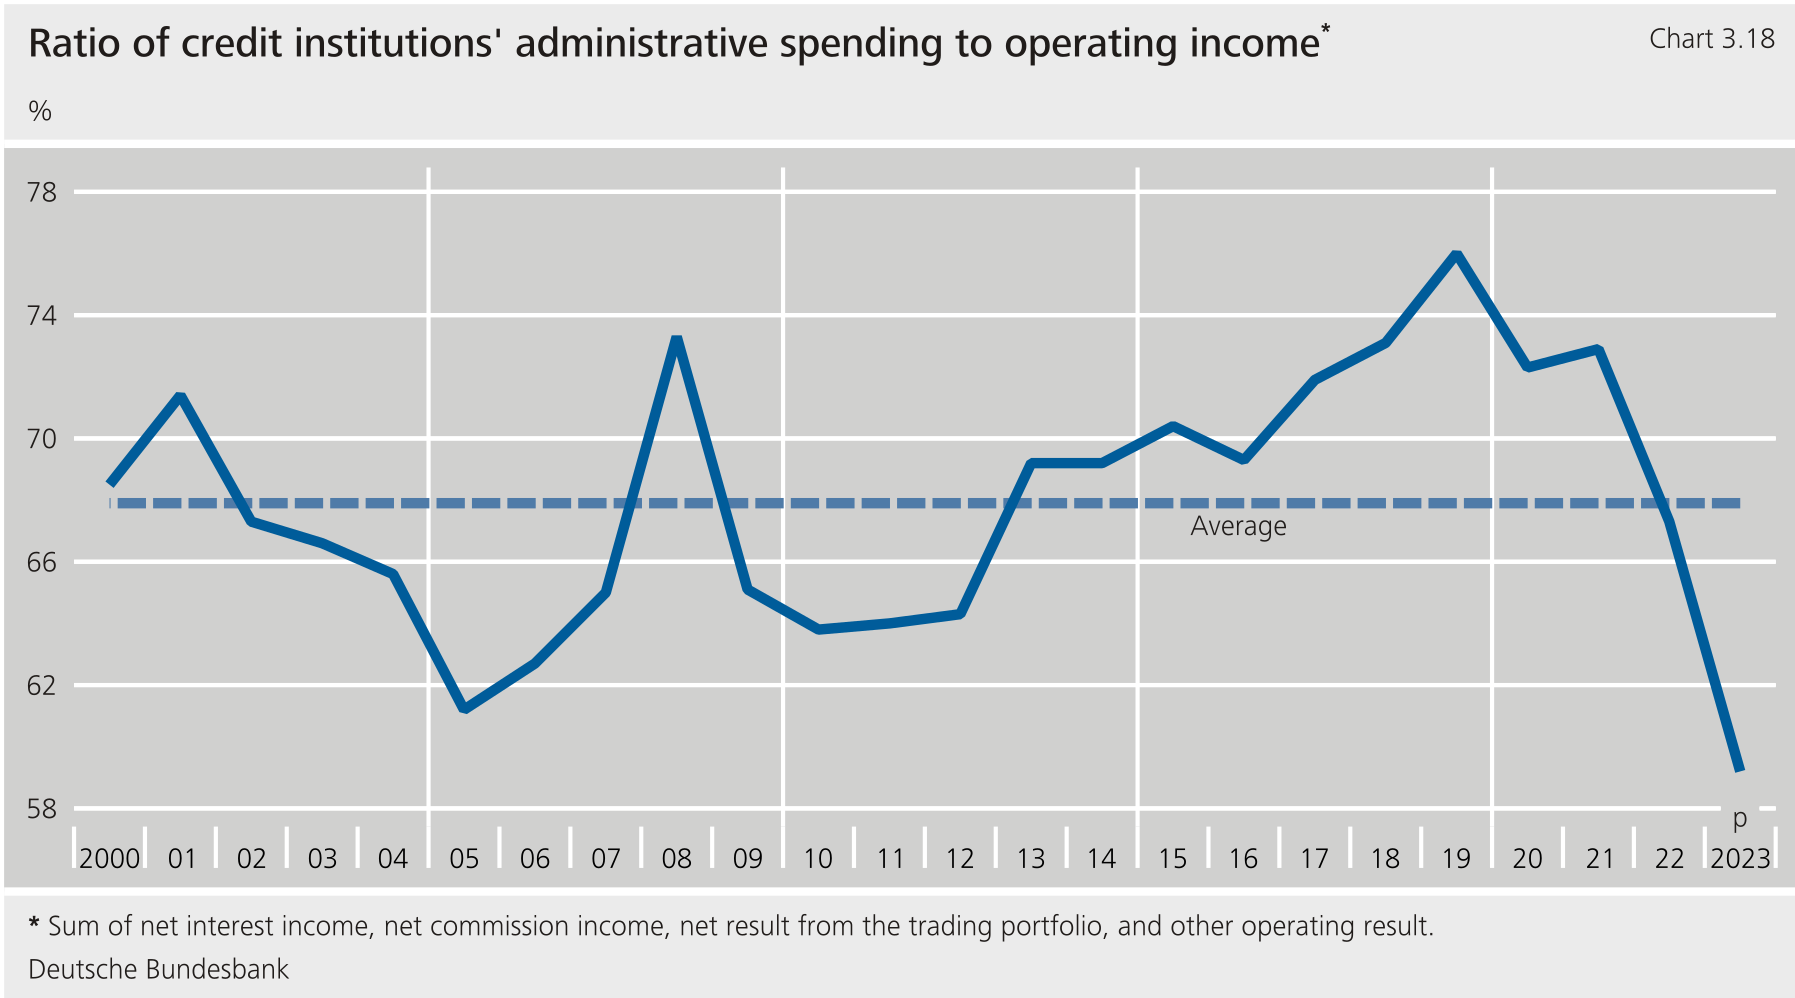
**All of the categories of banks under consideration improved their cost/income ratio compared with the previous year. Nevertheless, there were clear differences between the categories of banks.** As in 2022, big banks recorded the sharpest decline in the cost/income ratio (-20.8 percentage points) out of all the categories of banks considered in the reporting year. This was almost exclusively down to the above-average growth in operating income. All the same, big banks' cost/income ratio of 69.0% remained the weakest of all the categories of banks. By comparison, the cost/income ratio of savings banks fell by just 5.9 percentage points, but, at 56.1%, was slightly better than the cost efficiency of the aggregate of all German banks. The decline in the cost/income ratio of credit cooperatives totalling 2.2 percentage points proved to be the lowest amongst all the categories of banks under consideration. With a cost/income ratio of 60.3%, the cost efficiency of credit cooperatives was on par with the aggregate in the year under review.The comparatively sharp rise in general administrative spending at savings banks and credit cooperatives slowed down the improvement in their cost efficiency significantly, even though the operating income of both categories of banks increased considerably in the reporting year.{#par-o3u981}
| **Table 3.5: Cost/income ratios by category of banks** % ||||
| Category of banks | General administrative spending in relation to operating income^1^ |||
| Category of banks | 2021 | 2022 | 2023^p^ |
| All categories of banks | 72.9 | 67.3 | 59.2 |
| Commercial banks | 79.9 | 74.6 | 61.1 |
| Big banks | 99.2 | 89.8 | 69.0 |
| Regional banks and other commercial banks | 60.6 | 60.5 | 53.0 |
| Branches of foreign banks | 46.2 | 45.2 | 38.4 |
| Landesbanken | 70.6 | 62.6 | 58.4 |
| Savings banks | 70.7 | 62.0 | 56.1 |
| Credit cooperatives | 65.9 | 62.5 | 60.3 |
| Mortgage banks | 52.5 | 47.3 | 42.0 |
| Building and loan associations | 93.6 | 78.2 | 70.5 |
| Banks with special, development and other central support tasks | 55.5 | 59.4 | 56.6 |
|-----------------------------------------------------------------|------|------|---------|
{#par-i4oe4a}
3 Outlook
---------
**German credit institutions' business environment is likely to remain challenging in 2024.** Although inflation rates declined significantly compared with 2023, and, in June 2024, the Eurosystem lowered key interest rates again slightly for the first time after they had remained unchanged since the last interest rate hike in September 2023, major uncertainties regarding future macroeconomic and geopolitical developments persist. All in all, German economic output saw hardly any growth in the first and second quarters of 2024.[\[48\]](#_ftn_root_48){#par-ii6347}
**Factors that drag on earnings are likely to gain in importance for German credit institutions.** With new lending still muted and sight deposits being shifted into better-remunerated time deposits, it is probable that the effects on net interest income will tend to be negative overall in 2024. Furthermore, counterparty credit risk is expected to continue to rise, which renders higher write-downs for non-performing loans at German banks more likely. Moreover, additional challenges remain due to digitalisation, climate action and cyber risks. Taken by itself, the growing need for investment resulting from this will initially have a negative impact on the performance of German credit institutions. However, the earnings from 2023 stand the institutions in good stead for the investment and risk provisioning that are needed.{#par-e29u47}
4 List of references
--------------------
Deutsche Bundesbank (2024a), Annual Report, 2023.{#par-a6io33}
Deutsche Bundesbank (2024b), Monthly Report, February 2024.{#par-ua8ai8}
[Deutsche Bundesbank (2024c), Changes in bank office statistics in 2023, press release of 13 May 2024.](https://www.bundesbank.de/content/935104){#par-u187a9}
Deutsche Bundesbank (2024d), Developments in loans to enterprises in Germany since the start of the monetary policy tightening cycle, Monthly Report, July 2024, Chapter 4.1.{#par-o11e9i}
Deutsche Bundesbank (2024e), Forecast for Germany: German economy slowly regaining its footing -- outlook up to 2026, Monthly Report, June 2024, Chapter 1.3.{#par-o14259}
Deutsche Bundesbank (2024f), Overview, Monthly Report, August 2024, Chapter 3.1.{#par-aue482}
Deutsche Bundesbank (2023a), Financial Stability Review, 2023.{#par-u8ui1i}
Deutsche Bundesbank (2023b), Monthly Report, May 2023.{#par-a4e65o}
Deutsche Bundesbank (2023c), Monthly Report, August 2023.{#par-i55533}
Deutsche Bundesbank (2023d), Monthly Report, November 2023.{#par-o129e6}
Deutsche Bundesbank (2023e), Monthly Report, June 2023.{#par-i2522a}
Deutsche Bundesbank (2023f), Monthly Report, September 2023.{#par-i396ea}
Deutsche Bundesbank (2013), Financial Stability Review, 2013.{#par-uao673}
Institute of Public Auditors in Germany (2012), Stellungnahme des Bankenfachausschusses 3 „Einzelfragen der verlustfreien Bewertung von zinsbezogenen Geschäften des Bankbuchs (Zinsbuchs)" of 30 August 2012.{#par-oa857o}
| **Table 3.6: Major components of credit institutions' profit and loss accounts by category of banks** ^1^ As a percentage of average total assets for the year^2^ |||||||||||
| Financial year | All categories of banks | Commercial banks ||| Landesbanken^3^ | Savings banks^3^ | Credit cooperatives | Mortgage banks^3^ | Building and loan associations | Banks with special, development and other central support tasks |
| Financial year | All categories of banks | Total | of which: || Landesbanken^3^ | Savings banks^3^ | Credit cooperatives | Mortgage banks^3^ | Building and loan associations | Banks with special, development and other central support tasks |
| Financial year | All categories of banks | Total | Big banks^3^ | Regional banks and other commercial banks^3^ | Landesbanken^3^ | Savings banks^3^ | Credit cooperatives | Mortgage banks^3^ | Building and loan associations | Banks with special, development and other central support tasks |
|----------------|-------------------------|--------|--------------|----------------------------------------------|------------------|------------------|---------------------|-------------------|--------------------------------|-----------------------------------------------------------------|
| | Interest received^4^ ||||||||||
| 2017 | 2.00 | 1.54 | 1.26 | 2.25 | 2.74 | 2.42 | 2.33 | 3.35 | 2.63 | 1.78 |
| 2018 | 2.07 | 1.82 | 1.62 | 2.45 | 3.10 | 2.17 | 2.13 | 2.99 | 2.42 | 1.67 |
| 2019 | 1.91 | 1.58 | 1.41 | 2.09 | 3.23 | 2.03 | 2.00 | 2.80 | 2.34 | 1.52 |
| 2020 | 1.53 | 1.13 | 0.92 | 1.74 | 2.79 | 1.78 | 1.77 | 2.49 | 2.11 | 1.15 |
| 2021 | 1.39 | 0.98 | 0.90 | 1.21 | 2.93 | 1.58 | 1.63 | 2.35 | 1.92 | 0.93 |
| 2022 | 1.57 | 1.26 | 1.38 | 1.17 | 2.94 | 1.67 | 1.68 | 2.39 | 1.74 | 1.36 |
| 2023 | 3.10 | 2.78 | 3.02 | 2.41 | 6.53 | 2.63 | 2.40 | 3.58 | 2.15 | 2.96 |
| | Interest paid ||||||||||
| 2017 | 0.97 | 0.66 | 0.58 | 0.89 | 2.02 | 0.56 | 0.43 | 2.78 | 1.47 | 1.36 |
| 2018 | 0.99 | 0.82 | 0.77 | 0.98 | 2.43 | 0.44 | 0.33 | 2.25 | 1.29 | 1.28 |
| 2019 | 0.94 | 0.74 | 0.76 | 0.73 | 2.61 | 0.42 | 0.30 | 1.99 | 1.32 | 1.13 |
| 2020 | 0.65 | 0.40 | 0.37 | 0.52 | 2.17 | 0.30 | 0.21 | 1.65 | 1.07 | 0.77 |
| 2021 | 0.52 | 0.23 | 0.27 | 0.20 | 2.28 | 0.27 | 0.16 | 1.43 | 0.91 | 0.55 |
| 2022 | 0.71 | 0.54 | 0.71 | 0.33 | 2.31 | 0.21 | 0.16 | 1.49 | 0.73 | 1.03 |
| 2023 | 2.10 | 1.99 | 2.36 | 1.41 | 5.83 | 0.75 | 0.65 | 2.62 | 0.98 | 2.56 |
| | Excess of interest received over interest paid = net interest income (interest margin) ||||||||||
| 2017 | 1.04 | 0.87 | 0.68 | 1.36 | 0.73 | 1.87 | 1.90 | 0.58 | 1.16 | 0.42 |
| 2018 | 1.07 | 1.00 | 0.84 | 1.47 | 0.67 | 1.73 | 1.80 | 0.74 | 1.13 | 0.39 |
| 2019 | 0.97 | 0.84 | 0.65 | 1.36 | 0.62 | 1.61 | 1.70 | 0.81 | 1.03 | 0.38 |
| 2020 | 0.88 | 0.73 | 0.55 | 1.23 | 0.62 | 1.47 | 1.56 | 0.84 | 1.04 | 0.38 |
| 2021 | 0.87 | 0.75 | 0.63 | 1.01 | 0.64 | 1.31 | 1.47 | 0.91 | 1.00 | 0.38 |
| 2022 | 0.86 | 0.72 | 0.67 | 0.84 | 0.63 | 1.47 | 1.53 | 0.90 | 1.01 | 0.33 |
| 2023 | 1.00 | 0.79 | 0.66 | 1.00 | 0.71 | 1.89 | 1.75 | 0.96 | 1.18 | 0.40 |
| | Excess of commissions received over commissions paid = net commission income (commission margin) ||||||||||
| 2017 | 0.37 | 0.45 | 0.43 | 0.54 | 0.13 | 0.64 | 0.57 | − 0.02 | − 0.21 | 0.10 |
| 2018 | 0.36 | 0.43 | 0.45 | 0.40 | 0.13 | 0.63 | 0.57 | − 0.03 | − 0.21 | 0.11 |
| 2019 | 0.37 | 0.42 | 0.41 | 0.48 | 0.14 | 0.64 | 0.57 | − 0.05 | − 0.23 | 0.12 |
| 2020 | 0.35 | 0.39 | 0.34 | 0.55 | 0.13 | 0.62 | 0.55 | − 0.05 | − 0.20 | 0.13 |
| 2021 | 0.40 | 0.49 | 0.45 | 0.61 | 0.15 | 0.61 | 0.55 | − 0.06 | − 0.16 | 0.14 |
| 2022 | 0.36 | 0.39 | 0.38 | 0.44 | 0.16 | 0.61 | 0.54 | − 0.04 | − 0.07 | 0.12 |
| 2023 | 0.35 | 0.37 | 0.38 | 0.38 | 0.15 | 0.65 | 0.54 | − 0.03 | − 0.07 | 0.12 |
| | General administrative spending ||||||||||
| 2017 | 1.07 | 1.14 | 1.06 | 1.41 | 0.71 | 1.69 | 1.66 | 0.38 | 0.83 | 0.33 |
| 2018 | 1.09 | 1.17 | 1.15 | 1.32 | 0.69 | 1.65 | 1.59 | 0.42 | 0.82 | 0.34 |
| 2019 | 1.06 | 1.16 | 1.12 | 1.32 | 0.66 | 1.61 | 1.55 | 0.40 | 0.77 | 0.31 |
| 2020 | 0.95 | 0.98 | 0.91 | 1.24 | 0.62 | 1.47 | 1.45 | 0.37 | 0.78 | 0.30 |
| 2021 | 0.97 | 1.07 | 1.09 | 1.14 | 0.64 | 1.36 | 1.37 | 0.37 | 0.80 | 0.31 |
| 2022 | 0.90 | 0.92 | 0.95 | 0.95 | 0.61 | 1.34 | 1.35 | 0.40 | 0.85 | 0.31 |
| 2023 | 0.91 | 0.89 | 0.93 | 0.90 | 0.62 | 1.45 | 1.44 | 0.41 | 0.83 | 0.32 |
| | Result from the trading portfolio ||||||||||
| 2017 | 0.07 | 0.12 | 0.15 | 0.03 | 0.11 | 0.00 | 0.00 | 0.00 | 0.00 | 0.03 |
| 2018 | 0.04 | 0.07 | 0.09 | 0.03 | 0.08 | 0.00 | 0.00 | 0.00 | 0.00 | 0.03 |
| 2019 | 0.03 | 0.04 | 0.05 | 0.02 | 0.05 | 0.00 | 0.00 | 0.00 | 0.00 | 0.03 |
| 2020 | 0.04 | 0.07 | 0.07 | 0.06 | 0.05 | 0.00 | 0.00 | 0.00 | 0.00 | 0.03 |
| 2021 | 0.05 | 0.09 | 0.08 | 0.11 | 0.10 | 0.00 | 0.00 | 0.00 | 0.00 | 0.03 |
| 2022 | 0.09 | 0.14 | 0.15 | 0.14 | 0.18 | 0.00 | 0.00 | 0.00 | 0.00 | 0.07 |
| 2023 | 0.11 | 0.21 | 0.24 | 0.18 | 0.11 | 0.00 | 0.00 | 0.00 | 0.00 | 0.03 |
| | Operating result before valuation of assets ||||||||||
| 2017 | 0.42 | 0.30 | 0.13 | 0.67 | 0.27 | 0.83 | 0.86 | 0.16 | 0.42 | 0.23 |
| 2018 | 0.40 | 0.31 | 0.16 | 0.68 | 0.21 | 0.77 | 0.81 | 0.28 | 0.11 | 0.18 |
| 2019 | 0.33 | 0.21 | - 0.01 | 0.73 | 0.18 | 0.65 | 0.76 | 0.38 | 0.04 | 0.21 |
| 2020 | 0.36 | 0.28 | 0.10 | 0.75 | 0.20 | 0.62 | 0.71 | 0.39 | 0.07 | 0.23 |
| 2021 | 0.36 | 0.27 | 0.01 | 0.74 | 0.27 | 0.56 | 0.71 | 0.34 | 0.05 | 0.25 |
| 2022 | 0.43 | 0.31 | 0.11 | 0.62 | 0.36 | 0.82 | 0.81 | 0.45 | 0.24 | 0.21 |
| 2023 | 0.63 | 0.57 | 0.42 | 0.80 | 0.44 | 1.13 | 0.95 | 0.57 | 0.35 | 0.25 |
| | Result from the valuation of assets ||||||||||
| 2017 | - 0.04 | - 0.02 | 0.03 | - 0.12 | - 0.24 | 0.02 | - 0.02 | 0.01 | - 0.03 | - 0.07 |
| 2018 | - 0.08 | - 0.06 | - 0.02 | - 0.16 | - 0.33 | - 0.06 | - 0.10 | - 0.15 | 0.01 | - 0.02 |
| 2019 | - 0.08 | - 0.16 | - 0.19 | - 0.10 | - 0.04 | - 0.02 | 0.04 | - 0.05 | 0.02 | - 0.05 |
| 2020 | - 0.14 | - 0.21 | - 0.19 | - 0.26 | - 0.07 | - 0.14 | - 0.07 | - 0.15 | - 0.03 | - 0.08 |
| 2021 | - 0.04 | - 0.06 | - 0.03 | - 0.12 | - 0.01 | - 0.01 | 0.00 | - 0.07 | - 0.01 | - 0.05 |
| 2022 | - 0.15 | - 0.10 | - 0.03 | - 0.20 | - 0.16 | - 0.30 | - 0.35 | - 0.13 | - 0.05 | - 0.06 |
| 2023 | - 0.10 | - 0.09 | - 0.09 | - 0.09 | - 0.09 | - 0.20 | - 0.10 | - 0.24 | - 0.04 | - 0.02 |
| | Operating result ||||||||||
| 2017 | 0.37 | 0.28 | 0.16 | 0.55 | 0.03 | 0.85 | 0.84 | 0.17 | 0.40 | 0.15 |
| 2018 | 0.32 | 0.25 | 0.14 | 0.51 | - 0.12 | 0.71 | 0.71 | 0.14 | 0.11 | 0.17 |
| 2019 | 0.26 | 0.05 | - 0.20 | 0.63 | 0.14 | 0.62 | 0.80 | 0.32 | 0.06 | 0.16 |
| 2020 | 0.22 | 0.07 | - 0.09 | 0.49 | 0.13 | 0.48 | 0.63 | 0.24 | 0.04 | 0.15 |
| 2021 | 0.32 | 0.21 | - 0.02 | 0.62 | 0.26 | 0.55 | 0.71 | 0.27 | 0.05 | 0.20 |
| 2022 | 0.28 | 0.22 | 0.08 | 0.42 | 0.21 | 0.52 | 0.46 | 0.32 | 0.19 | 0.16 |
| 2023 | 0.53 | 0.48 | 0.33 | 0.71 | 0.35 | 0.93 | 0.84 | 0.32 | 0.31 | 0.23 |
| | Other and extraordinary result ||||||||||
| 2017 | - 0.04 | - 0.10 | - 0.05 | - 0.23 | 0.07 | - 0.01 | 0.00 | 0.03 | 0.04 | - 0.04 |
| 2018 | - 0.08 | - 0.14 | - 0.09 | - 0.28 | - 0.01 | - 0.06 | - 0.02 | - 0.04 | - 0.01 | - 0.06 |
| 2019 | - 0.19 | - 0.43 | - 0.50 | - 0.31 | - 0.05 | 0.00 | - 0.02 | - 0.09 | 0.13 | 0.00 |
| 2020 | - 0.06 | - 0.14 | - 0.12 | - 0.18 | - 0.07 | - 0.01 | - 0.02 | 0.11 | 0.04 | 0.01 |
| 2021 | - 0.04 | - 0.10 | - 0.04 | - 0.21 | - 0.07 | - 0.01 | - 0.01 | 0.45 | 0.02 | 0.02 |
| 2022 | - 0.02 | 0.01 | 0.14 | - 0.17 | 0.00 | - 0.11 | - 0.07 | - 0.09 | - 0.05 | - 0.01 |
| 2023 | - 0.07 | - 0.13 | - 0.02 | - 0.28 | - 0.04 | - 0.02 | - 0.05 | 0.01 | - 0.10 | - 0.02 |
| | Profit or loss (-) for the financial year before tax ||||||||||
| 2017 | 0.33 | 0.18 | 0.12 | 0.32 | 0.10 | 0.84 | 0.84 | 0.21 | 0.43 | 0.12 |
| 2018 | 0.23 | 0.10 | 0.05 | 0.23 | - 0.13 | 0.65 | 0.69 | 0.09 | 0.11 | 0.11 |
| 2019 | 0.07 | - 0.39 | - 0.71 | 0.32 | 0.10 | 0.63 | 0.78 | 0.23 | 0.19 | 0.15 |
| 2020 | 0.16 | - 0.07 | - 0.22 | 0.30 | 0.06 | 0.48 | 0.62 | 0.35 | 0.08 | 0.16 |
| 2021 | 0.29 | 0.11 | - 0.06 | 0.41 | 0.19 | 0.54 | 0.70 | 0.72 | 0.07 | 0.22 |
| 2022 | 0.26 | 0.23 | 0.23 | 0.24 | 0.21 | 0.41 | 0.39 | 0.23 | 0.13 | 0.15 |
| 2023 | 0.46 | 0.36 | 0.31 | 0.43 | 0.32 | 0.92 | 0.80 | 0.33 | 0.21 | 0.21 |
| | Profit or loss (-) for the financial year after tax ||||||||||
| 2017 | 0.24 | 0.13 | 0.09 | 0.20 | 0.05 | 0.60 | 0.58 | 0.13 | 0.37 | 0.13 |
| 2018 | 0.15 | 0.08 | 0.05 | 0.13 | - 0.20 | 0.44 | 0.47 | 0.04 | 0.05 | 0.09 |
| 2019 | - 0.03 | - 0.45 | - 0.75 | 0.20 | 0.07 | 0.44 | 0.56 | 0.16 | 0.15 | 0.12 |
| 2020 | 0.06 | - 0.13 | - 0.25 | 0.18 | 0.04 | 0.30 | 0.42 | 0.06 | 0.04 | 0.12 |
| 2021 | 0.18 | 0.06 | - 0.06 | 0.26 | 0.11 | 0.36 | 0.52 | 0.24 | 0.02 | 0.14 |
| 2022 | 0.21 | 0.23 | 0.30 | 0.13 | 0.12 | 0.24 | 0.29 | 0.14 | 0.08 | 0.12 |
| 2023 | 0.34 | 0.27 | 0.30 | 0.24 | 0.21 | 0.64 | 0.58 | 0.21 | 0.10 | 0.20 |
{#par-ueiu42}
{#par-u8o141}
| **Table 3.7: Credit institutions' profit and loss accounts** ^1^ |||||||||||||||||||||| |
| Financial year | Number of reporting institutions | Average total assets for the year^2^ | Interest business ||| Commissions business ||| Result from the trading portfolio | Other operating result | Operating income^4^ (col. 3 plus col. 6 plus col. 9 plus col. 10) | General administrative spending ||| Operating result before the valuation of assets (col. 11 less col. 12) | Result from the valuation of assets (other than tangible or financial fixed assets) | Operating result (col. 15 plus col. 16) | Other and extra ordinary result | Profit or loss (-) for the financial year before tax (col. 17 plus col.18) | Taxes on income and earnings | Profit or loss (-) for the financial year after tax (col. 19 less col. 20) | Financial year |
| | Number of reporting institutions | Average total assets for the year^2^ | Net interest income (col. 4 less col. 5) | Interest received^3^ | Interest paid | Net commission income (col. 7 less col. 8) | Commissions received | Commissions paid | Result from the trading portfolio | Other operating result | Operating income^4^ (col. 3 plus col. 6 plus col. 9 plus col. 10) | Total (col. 13 plus col. 14) | Staff costs | Total other administrative spending^5^ | Operating result before the valuation of assets (col. 11 less col. 12) | Result from the valuation of assets (other than tangible or financial fixed assets) | Operating result (col. 15 plus col. 16) | Other and extra ordinary result | Profit or loss (-) for the financial year before tax (col. 17 plus col.18) | Taxes on income and earnings | Profit or loss (-) for the financial year after tax (col. 19 less col. 20) | |
| | 1 | 2 | 3 | 4 | 5 | 6 | 7 | 8 | 9 | 10 | 11 | 12 | 13 | 14 | 15 | 16 | 17 | 18 | 19 | 20 | 21 | |
|----------------|----------------------------------|--------------------------------------|------------------------------------------|----------------------|---------------|--------------------------------------------|----------------------|------------------|-----------------------------------|------------------------|-------------------------------------------------------------------|------------------------------|-------------|----------------------------------------|------------------------------------------------------------------------|-------------------------------------------------------------------------------------|-----------------------------------------|---------------------------------|----------------------------------------------------------------------------|------------------------------|----------------------------------------------------------------------------|----------------|
| | | € billion |||||||||||||||||||| |
| 2016 | 1,611 | 8,355.0 | 91.1 | 181.5 | 90.4 | 29.7 | 43.2 | 13.5 | 3.0 | 4.1 | 128.0 | 88.7 | 44.6 | 44.0 | 39.4 | - 8.8 | 30.6 | - 2.8 | 27.8 | 7.9 | 19.9 | 2016 |
| 2017 | 1,538 | 8,251.2 | 85.5 | 165.4 | 79.9 | 30.6 | 44.2 | 13.6 | 5.6 | 1.3 | 122.9 | 88.4 | 44.6 | 43.8 | 34.5 | - 3.6 | 30.9 | - 3.4 | 27.5 | 7.5 | 20.0 | 2017 |
| 2018 | 1,484 | 8,118.3 | 87.2 | 167.8 | 80.6 | 29.5 | 43.1 | 13.6 | 3.5 | 0.4 | 120.6 | 88.1 | 44.3 | 43.9 | 32.4 | - 6.8 | 25.7 | - 6.8 | 18.9 | 6.7 | 12.2 | 2018 |
| 2019 | 1,440 | 8,532.7 | 82.5 | 162.8 | 80.4 | 31.2 | 45.8 | 14.5 | 2.5 | 2.5 | 118.7 | 90.2 | 44.4 | 45.7 | 28.5 | - 6.7 | 21.8 | - 16.1 | 5.6 | 7.8 | - 2.2 | 2019 |
| 2020 | 1,408 | 9,206.9 | 81.1 | 140.5 | 59.4 | 32.1 | 46.7 | 14.5 | 3.5 | 3.7 | 120.4 | 87.0 | 44.2 | 42.8 | 33.4 | - 13.3 | 20.1 | - 5.8 | 14.3 | 8.4 | 5.9 | 2020 |
| 2021 | 1,358 | 9,476.1 | 82.2 | 131.6 | 49.4 | 37.9 | 53.6 | 15.7 | 4.9 | 1.2 | 126.2 | 92.0 | 46.7 | 45.3 | 34.2 | - 3.6 | 30.6 | - 3.5 | 27.0 | 9.8 | 17.3 | 2021 |
| 2022 | 1,302 | 10,609.2 | 91.6 | 167.0 | 75.4 | 37.9 | 54.6 | 16.7 | 9.8 | 1.8 | 141.1 | 95.0 | 48.4 | 46.6 | 46.1 | - 16.3 | 29.8 | - 2.5 | 27.3 | 5.5 | 21.8 | 2022 |
| 2023 | 1,240 | 10,701.0 | 106.9 | 331.4 | 224.6 | 37.6 | 52.7 | 15.1 | 11.6 | 8.2 | 164.3 | 97.3 | 48.6 | 48.7 | 67.0 | - 10.3 | 56.7 | - 7.9 | 48.7 | 12.6 | 36.1 | 2023 |
| | Year-on-year percentage change ||||||||||||||||||||| |
| 2017 | - 4.5 | - 1.2 | - 6.2 | - 8.9 | - 11.6 | 2.7 | 2.3 | 1.3 | 82.9 | - 67.9 | - 4.0 | - 0.3 | - 0.1 | - 0.5 | - 12.2 | 58.7 | 1.0 | - 20.8 | - 1.0 | - 4.3 | 0.4 | 2017 |
| 2018 | - 3.5 | - 1.6 | 2.0 | 1.4 | 0.8 | - 3.4 | - 2.4 | - 0.2 | - 37.7 | - 70.1 | - 1.9 | - 0.3 | - 0.6 | 0.1 | - 6.0 | - 86.9 | - 16.9 | - 101.0 | - 31.5 | - 11.2 | - 39.1 | 2018 |
| 2019 | - 3.0 | 5.1 | - 5.4 | - 3.0 | - 0.3 | 5.8 | 6.1 | 6.8 | - 28.8 | 545.6 | - 1.6 | 2.3 | 0.4 | 4.3 | - 12.2 | 0.7 | - 15.2 | - 136.2 | - 70.1 | 16.6 | . | 2019 |
| 2020 | - 2.2 | 7.9 | - 1.7 | - 13.7 | - 26.0 | 2.9 | 2.0 | 0.2 | 42.3 | 46.4 | 1.5 | - 3.5 | - 0.5 | - 6.4 | 17.2 | - 97.7 | - 7.6 | 63.9 | 153.3 | 7.5 | . | 2020 |
| 2021 | - 3.6 | 2.9 | 1.4 | - 6.3 | - 16.8 | 17.9 | 14.9 | 8.2 | 40.2 | - 68.8 | 4.8 | 5.7 | 5.7 | 5.7 | 2.4 | 72.7 | 52.0 | 39.1 | 89.1 | 16.3 | 192.5 | 2021 |
| 2022 | - 4.1 | 12.0 | 11.4 | 26.9 | 52.6 | 0.1 | 1.8 | 6.1 | 98.3 | 55.2 | 11.8 | 3.3 | 3.6 | 2.9 | 34.7 | - 349.3 | - 2.6 | 30.2 | 1.0 | - 43.8 | 26.4 | 2022 |
| 2023 | - 4.8 | 0.9 | 16.7 | 98.5 | 197.7 | - 0.8 | - 3.5 | - 9.6 | 18.4 | 359.7 | 16.5 | 2.4 | 0.3 | 4.6 | 45.4 | 36.7 | 90.3 | - 220.8 | 78.5 | 130.1 | 65.5 | 2023 |
| | As a percentage of average total assets for the year ||||||||||||||||||||| |
| 2016 | . | . | 1.09 | 2.17 | 1.08 | 0.36 | 0.52 | 0.16 | 0.04 | 0.05 | 1.53 | 1.06 | 0.53 | 0.53 | 0.47 | - 0.10 | 0.37 | - 0.03 | 0.33 | 0.09 | 0.24 | 2016 |
| 2017 | . | . | 1.04 | 2.00 | 0.97 | 0.37 | 0.54 | 0.17 | 0.07 | 0.02 | 1.49 | 1.07 | 0.54 | 0.53 | 0.42 | - 0.04 | 0.37 | - 0.04 | 0.33 | 0.09 | 0.24 | 2017 |
| 2018 | . | . | 1.07 | 2.07 | 0.99 | 0.36 | 0.53 | 0.17 | 0.04 | 0.00 | 1.49 | 1.09 | 0.55 | 0.54 | 0.40 | - 0.08 | 0.32 | - 0.08 | 0.23 | 0.08 | 0.15 | 2018 |
| 2019 | . | . | 0.97 | 1.91 | 0.94 | 0.37 | 0.54 | 0.17 | 0.03 | 0.03 | 1.39 | 1.06 | 0.52 | 0.54 | 0.33 | - 0.08 | 0.26 | - 0.19 | 0.07 | 0.09 | - 0.03 | 2019 |
| 2020 | . | . | 0.88 | 1.53 | 0.65 | 0.35 | 0.51 | 0.16 | 0.04 | 0.04 | 1.31 | 0.95 | 0.48 | 0.47 | 0.36 | - 0.14 | 0.22 | - 0.06 | 0.16 | 0.09 | 0.06 | 2020 |
| 2021 | . | . | 0.87 | 1.39 | 0.52 | 0.40 | 0.57 | 0.17 | 0.05 | 0.01 | 1.33 | 0.97 | 0.49 | 0.48 | 0.36 | - 0.04 | 0.32 | - 0.04 | 0.29 | 0.10 | 0.18 | 2021 |
| 2022 | . | . | 0.86 | 1.57 | 0.71 | 0.36 | 0.51 | 0.16 | 0.09 | 0.02 | 1.33 | 0.90 | 0.46 | 0.44 | 0.43 | - 0.15 | 0.28 | - 0.02 | 0.26 | 0.05 | 0.21 | 2022 |
| 2023 | . | . | 1.00 | 3.10 | 2.10 | 0.35 | 0.49 | 0.14 | 0.11 | 0.08 | 1.54 | 0.91 | 0.45 | 0.46 | 0.63 | - 0.10 | 0.53 | - 0.07 | 0.46 | 0.12 | 0.34 | 2023 |
{#par-a125aa}
| | | | | | | | | | | | | | | | | | | | | | | | | |
| **Table 3.8: Profit and loss accounts by category of banks** ^1^ |||||||||||||||||||||||| |
| Financial year | Number of reporting institutions | € million |||||||||||||||||||||| |
| Financial year | Number of reporting institutions | Average total assets for the year^2^ | Interest business ||| Commissions business ||| Result from the trading portfolio | Other operating result | Operating income^4^ (col. 3 plus col. 6 plus col. 9 plus col. 10) | General administrative spending ||| Operating result before the valuation of assets (col. 11 less col. 12) | Result from the valuation of assets (other than tangible or financial fixed assets) | Operating result (col. 15 plus col. 16) | Other and extraordinary result | Profit or loss (-) for the financial year before tax (col. 17 plus col.18) | Taxes on income and earnings^6^ | Profit or loss (-) for the financial year after tax (col. 19 less col. 20) | With drawals from or transfers to (-) reserves and participation rights capital^7^ | Balance sheet profit or loss (-) (col. 21 plus col. 22) | Financial year |
| Financial year | Number of reporting institutions | Average total assets for the year^2^ | Net interest income (col. 4 less col. 5) | Interest received^3^ | Interest paid | Net commission income (col. 7 less col. 8) | Commissions received | Commissions paid | Result from the trading portfolio | Other operating result | Operating income^4^ (col. 3 plus col. 6 plus col. 9 plus col. 10) | Total (col. 13 plus col. 14) | Staff costs | Total other administrative spending^5^ | Operating result before the valuation of assets (col. 11 less col. 12) | Result from the valuation of assets (other than tangible or financial fixed assets) | Operating result (col. 15 plus col. 16) | Other and extraordinary result | Profit or loss (-) for the financial year before tax (col. 17 plus col.18) | Taxes on income and earnings^6^ | Profit or loss (-) for the financial year after tax (col. 19 less col. 20) | With drawals from or transfers to (-) reserves and participation rights capital^7^ | Balance sheet profit or loss (-) (col. 21 plus col. 22) | Financial year |
| Financial year | 1 | 2 | 3 | 4 | 5 | 6 | 7 | 8 | 9 | 10 | 11 | 12 | 13 | 14 | 15 | 16 | 17 | 18 | 19 | 20 | 21 | 22 | 23 | |
|----------------|----------------------------------|--------------------------------------|------------------------------------------|----------------------|---------------|--------------------------------------------|----------------------|------------------|-----------------------------------|------------------------|-------------------------------------------------------------------|------------------------------|-------------|----------------------------------------|------------------------------------------------------------------------|-------------------------------------------------------------------------------------|-----------------------------------------|--------------------------------|----------------------------------------------------------------------------|---------------------------------|----------------------------------------------------------------------------|------------------------------------------------------------------------------------|---------------------------------------------------------|----------------|
| | All categories of banks ||||||||||||||||||||||| |
| 2018 | 1,484 | 8,118,298 | 87,202 | 167,777 | 80,575 | 29,522 | 43,124 | 13,602 | 3,470 | 390 | 120,584 | 88,135 | 44,282 | 43,853 | 32,449 | - 6,763 | 25,686 | - 6,831 | 18,855 | 6,692 | 12,163 | - 13,116 | - 953 | 2018 |
| 2019 | 1,440 | 8,532,738 | 82,453 | 162,805 | 80,352 | 31,244 | 45,765 | 14,521 | 2,469 | 2,518 | 118,684 | 90,191 | 44,447 | 45,744 | 28,493 | - 6,719 | 21,774 | -16,133 | 5,641 | 7,806 | - 2,165 | 7,223 | 5,058 | 2019 |
| 2020 | 1,408 | 9,206,853 | 81,074 | 140,502 | 59,428 | 32,142 | 46,689 | 14,547 | 3,513 | 3,686 | 120,415 | 87,023 | 44,210 | 42,813 | 33,392 | -13,282 | 20,110 | - 5,822 | 14,288 | 8,388 | 5,900 | - 1,312 | 4,588 | 2020 |
| 2021 | 1,358 | 9,476,130 | 82,227 | 131,647 | 49,420 | 37,891 | 53,625 | 15,734 | 4,926 | 1,150 | 126,194 | 92,004 | 46,747 | 45,257 | 34,190 | - 3,625 | 30,565 | - 3,547 | 27,018 | 9,759 | 17,259 | - 8,511 | 8,748 | 2021 |
| 2022 | 1,302 | 10,609,156 | 91,575 | 167,014 | 75,439 | 37,923 | 54,617 | 16,694 | 9,767 | 1,785 | 141,050 | 94,995 | 48,429 | 46,566 | 46,055 | -16,288 | 29,767 | - 2,475 | 27,292 | 5,485 | 21,807 | - 9,666 | 12,141 | 2022 |
| 2023 | 1,240 | 10,701,001 | 106,887 | 331,442 | 224,555 | 37,620 | 52,714 | 15,094 | 11,560 | 8,206 | 164,273 | 97,302 | 48,586 | 48,716 | 66,971 | -10,317 | 56,654 | - 7,941 | 48,713 | 12,619 | 36,094 | - 18,918 | 17,176 | 2023 |
| | Commercial banks ||||||||||||||||||||||| |
| 2018 | 167 | 3,404,697 | 34,140 | 62,134 | 27,994 | 14,514 | 22,145 | 7,631 | 2,462 | - 779 | 50,337 | 39,899 | 16,558 | 23,341 | 10,438 | - 1,992 | 8,446 | - 4,918 | 3,528 | 906 | 2,622 | - 4,264 | - 1,642 | 2018 |
| 2019 | 165 | 3,591,261 | 30,191 | 56,720 | 26,529 | 15,154 | 23,252 | 8,098 | 1,560 | 1,959 | 48,864 | 41,481 | 16,933 | 24,548 | 7,383 | - 5,743 | 1,640 | -15,611 | -13,971 | 2,356 | -16,327 | 18,097 | 1,770 | 2019 |
| 2020 | 164 | 3,966,453 | 28,807 | 44,739 | 15,932 | 15,439 | 23,385 | 7,946 | 2,670 | 3,074 | 49,990 | 38,867 | 16,909 | 21,958 | 11,123 | - 8,336 | 2,787 | - 5,412 | - 2,625 | 2,334 | - 4,959 | 6,467 | 1,508 | 2020 |
| 2021 | 166 | 3,995,423 | 29,941 | 39,134 | 9,193 | 19,708 | 28,382 | 8,674 | 3,511 | 489 | 53,649 | 42,882 | 19,257 | 23,625 | 10,767 | - 2,361 | 8,406 | - 4,004 | 4,402 | 2,060 | 2,342 | 2,234 | 4,576 | 2021 |
| 2022 | 157 | 4,779,020 | 34,499 | 60,211 | 25,712 | 18,746 | 28,255 | 9,509 | 6,840 | -1,086 | 58,999 | 44,008 | 20,046 | 23,962 | 14,991 | - 4,584 | 10,407 | 613 | 11,020 | 144 | 10,876 | - 2,003 | 8,873 | 2022 |
| 2023 | 148 | 4,885,442 | 38,583 | 135,777 | 97,194 | 18,132 | 26,573 | 8,441 | 10,049 | 4,733 | 71,497 | 43,687 | 19,281 | 24,406 | 27,810 | - 4,287 | 23,523 | - 6,174 | 17,349 | 4,037 | 13,312 | - 1,868 | 11,444 | 2023 |
| | Big banks^8^ ||||||||||||||||||||||| |
| 2018 | 4 | 2,346,111 | 19,751 | 37,924 | 18,173 | 10,573 | 13,478 | 2,905 | 2,196 | -1,866 | 30,654 | 26,944 | 10,660 | 16,284 | 3,710 | - 382 | 3,328 | - 2,179 | 1,149 | - 97 | 1,246 | 22 | 1,268 | 2018 |
| 2019 | 4 | 2,475, 076 | 16,126 | 34,920 | 18,794 | 10,154 | 13,650 | 3,496 | 1,302 | - 32 | 27,550 | 27,806 | 10,807 | 16,999 | - 256 | - 4,723 | - 4,979 | -12,479 | -17,458 | 988 | -18,446 | 21,922 | 3,476 | 2019 |
| 2020 | 3 | 2,748,655 | 15,052 | 25,257 | 10,205 | 9,311 | 12,495 | 3,184 | 2,000 | 1,341 | 27,704 | 25,003 | 10,532 | 14,471 | 2,701 | - 5,270 | - 2,569 | - 3,415 | - 5,984 | 960 | - 6,944 | 7,344 | 400 | 2020 |
| 2021 | 3 | 2,461,038 | 15,568 | 22,111 | 6,543 | 11,124 | 14,085 | 2,961 | 1,985 | -1,595 | 27,082 | 26,866 | 11,614 | 15,252 | 216 | - 665 | - 449 | - 1,080 | - 1,529 | - 84 | - 1,445 | 2,659 | 1,214 | 2021 |
| 2022 | 3 | 2,716, 868 | 18,138 | 37,395 | 19,257 | 10,278 | 13,743 | 3,465 | 4,101 | -3,840 | 28,677 | 25,762 | 11,652 | 14,110 | 2,915 | - 707 | 2,208 | 3,922 | 6,130 | - 2,125 | 8,255 | - 3,276 | 4,979 | 2022 |
| 2023 | 3 | 2,760, 665 | 18,226 | 83,400 | 65,174 | 10,576 | 13,264 | 2,688 | 6,523 | 1,788 | 37,113 | 25,599 | 11,119 | 14,480 | 11,514 | - 2,462 | 9,052 | - 570 | 8,482 | 150 | 8,332 | - 2,549 | 5,783 | 2023 |
| | Regional and other commercial banks^8^ ||||||||||||||||||||||| |
| 2018 | 145 | 962,520 | 14,149 | 23,562 | 9,413 | 3,827 | 8,543 | 4,716 | 261 | 986 | 19,223 | 12,702 | 5,781 | 6,921 | 6,521 | - 1,574 | 4,947 | - 2,739 | 2,208 | 945 | 1,263 | - 4,258 | - 2,995 | 2018 |
| 2019 | 142 | 1,013,378 | 13,784 | 21,153 | 7,369 | 4,864 | 9,456 | 4,592 | 252 | 1,892 | 20,792 | 13,391 | 5,998 | 7,393 | 7,401 | - 997 | 6,404 | - 3,131 | 3,273 | 1,294 | 1,979 | - 3,794 | - 1,815 | 2019 |
| 2020 | 139 | 1,094,301 | 13,435 | 19,073 | 5,638 | 6,015 | 10,759 | 4,744 | 660 | 1,605 | 21,715 | 13,560 | 6,251 | 7,309 | 8,155 | - 2,846 | 5,309 | - 1,997 | 3,312 | 1,329 | 1,983 | - 884 | 1,099 | 2020 |
| 2021 | 139 | 1,382,623 | 13,956 | 16,740 | 2,784 | 8,496 | 14,160 | 5,664 | 1,514 | 1,975 | 25,941 | 15,727 | 7,528 | 8,199 | 10,214 | - 1,674 | 8,540 | - 2,927 | 5,613 | 2,045 | 3,568 | - 414 | 3,154 | 2021 |
| 2022 | 129 | 1,895,932 | 15,954 | 22,128 | 6,174 | 8,365 | 14,363 | 5,998 | 2,729 | 2,570 | 29,618 | 17,928 | 8,271 | 9,657 | 11,690 | - 3,763 | 7,927 | - 3,308 | 4,619 | 2,184 | 2,435 | 1,245 | 3,680 | 2022 |
| 2023 | 121 | 1,967,187 | 19,703 | 47,349 | 27,646 | 7,458 | 13,148 | 5,690 | 3,512 | 2,867 | 33,540 | 17,764 | 8,039 | 9,725 | 15,776 | - 1, 738 | 14,038 | - 5,604 | 8,434 | 3,722 | 4,712 | 641 | 5,353 | 2023 |
| | Branches of foreign banks ||||||||||||||||||||||| |
| 2018 | 18 | 96,066 | 240 | 648 | 408 | 114 | 124 | 10 | 5 | 101 | 460 | 253 | 117 | 136 | 207 | - 36 | 171 | 0 | 171 | 58 | 113 | - 28 | 85 | 2018 |
| 2019 | 19 | 102,807 | 281 | 647 | 366 | 136 | 146 | 10 | 6 | 99 | 522 | 284 | 128 | 156 | 238 | - 23 | 215 | - 1 | 214 | 74 | 140 | - 31 | 109 | 2019 |
| 2020 | 22 | 123,497 | 320 | 409 | 89 | 113 | 131 | 18 | 10 | 128 | 571 | 304 | 126 | 178 | 267 | - 220 | 47 | 0 | 47 | 45 | 2 | 7 | 9 | 2020 |
| 2021 | 24 | 151,762 | 417 | 283 | - 134 | 88 | 137 | 49 | 12 | 109 | 626 | 289 | 115 | 174 | 337 | - 22 | 315 | 3 | 318 | 99 | 219 | - 11 | 208 | 2021 |
| 2022 | 25 | 166,220 | 407 | 688 | 281 | 103 | 149 | 46 | 10 | 184 | 704 | 318 | 123 | 195 | 386 | - 114 | 272 | - 1 | 271 | 85 | 186 | 28 | 214 | 2022 |
| 2023 | 24 | 157,590 | 654 | 5,028 | 4,374 | 98 | 161 | 63 | 14 | 78 | 844 | 324 | 123 | 201 | 520 | - 87 | 433 | 0 | 433 | 165 | 268 | 40 | 308 | 2023 |
| | Landesbanken^8^ ||||||||||||||||||||||| |
| 2018 | 6 | 803,978 | 5,365 | 24,895 | 19,530 | 1,074 | 2,408 | 1,334 | 634 | 160 | 7,233 | 5,538 | 2,789 | 2,749 | 1,695 | - 2,625 | - 930 | - 91 | - 1,021 | 603 | - 1,624 | - 128 | - 1,752 | 2018 |
| 2019 | 6 | 862,346 | 5,327 | 27,818 | 22,491 | 1,226 | 2,617 | 1,391 | 466 | 280 | 7,299 | 5,729 | 2,805 | 2,924 | 1,570 | - 337 | 1,233 | - 410 | 823 | 196 | 627 | - 575 | 52 | 2019 |
| 2020 | 6 | 898,328 | 5,559 | 25,055 | 19,496 | 1,152 | 2,697 | 1,545 | 456 | 174 | 7,341 | 5,574 | 2,773 | 2,801 | 1,767 | - 643 | 1,124 | - 586 | 538 | 185 | 353 | - 527 | - 174 | 2020 |
| 2021 | 6 | 905,608 | 5,826 | 26,496 | 20,670 | 1,326 | 3,118 | 1,792 | 886 | 204 | 8,242 | 5,815 | 2,828 | 2,987 | 2,427 | - 50 | 2,377 | - 665 | 1,712 | 748 | 964 | - 1,154 | - 190 | 2021 |
| 2022 | 6 | 977,020 | 6,178 | 28,753 | 22,575 | 1,526 | 3,152 | 1,626 | 1,729 | 65 | 9,498 | 5,943 | 2,772 | 3,171 | 3,555 | - 1,550 | 2,005 | 16 | 2,021 | 868 | 1,153 | - 1,187 | - 34 | 2022 |
| 2023 | 6 | 1,000,033 | 7,056 | 65,309 | 58,253 | 1,503 | 3,095 | 1,592 | 1, 061 | 914 | 10,534 | 6,151 | 2,868 | 3,283 | 4,383 | - 851 | 3,532 | - 380 | 3,152 | 1,029 | 2,123 | - 1,295 | 828 | 2023 |
| | Savings banks^8^ |||||||||||||| ||||||||| |
| 2018 | 386 | 1,267,726 | 21,949 | 27,541 | 5,592 | 7,965 | 8,778 | 813 | 1 | 718 | 30,633 | 20,930 | 13,012 | 7,918 | 9,703 | - 704 | 8,999 | - 786 | 8,213 | 2,694 | 5,519 | - 4,070 | 1,449 | 2018 |
| 2019 | 380 | 1,315,579 | 21,217 | 26,758 | 5,541 | 8,458 | 9,405 | 947 | 10 | 17 | 29,702 | 21,211 | 13,079 | 8,132 | 8,491 | - 296 | 8,195 | 41 | 8,236 | 2,437 | 5,799 | - 4,390 | 1,409 | 2019 |
| 2020 | 377 | 1,407,118 | 20,741 | 24,986 | 4,245 | 8,660 | 9,646 | 986 | 5 | 8 | 29,414 | 20,630 | 12,832 | 7,798 | 8,784 | - 1,960 | 6,824 | - 88 | 6,736 | 2,513 | 4,223 | - 2,923 | 1,300 | 2020 |
| 2021 | 371 | 1,516,119 | 19,873 | 23,966 | 4,093 | 9,242 | 10,309 | 1,067 | 11 | 44 | 29,170 | 20,637 | 12,606 | 8,031 | 8,533 | - 209 | 8,324 | - 155 | 8,169 | 2,675 | 5,494 | - 4,190 | 1,304 | 2021 |
| 2022 | 362 | 1,573,071 | 23,065 | 26,326 | 3,261 | 9,673 | 10,745 | 1,072 | 9 | 1,249 | 33,996 | 21,067 | 12,768 | 8,299 | 12,929 | - 4,753 | 8,176 | 1,764 | 6,412 | 2,596 | 3,816 | - 2,660 | 1,156 | 2022 |
| 2023 | 354 | 1,556,061 | 29,344 | 40,943 | 11,599 | 10,039 | 10,980 | 941 | 12 | 729 | 40,124 | 22,522 | 13,393 | 9,129 | 17,602 | - 3,073 | 14,529 | - 274 | 14,255 | 4,284 | 9,971 | - 8,035 | 1,936 | 2023 |
| | Credit cooperatives ||||||||||||||||||||||| |
| 2018 | 875 | 911,385 | 16,375 | 19,424 | 3,049 | 5,160 | 6,318 | 1,158 | 4 | 408 | 21,947 | 14,520 | 8,564 | 5,956 | 7,427 | - 926 | 6,501 | - 172 | 6,329 | 2,078 | 4,251 | - 2,978 | 1,273 | 2018 |
| 2019 | 841 | 957,859 | 16,251 | 19,151 | 2,900 | 5,456 | 6,718 | 1,262 | 6 | 407 | 22,120 | 14,858 | 8,518 | 6,340 | 7,262 | 419 | 7,681 | - 174 | 7,507 | 2,124 | 5,383 | - 4,154 | 1,229 | 2019 |
| 2020 | 814 | 1,029,671 | 16,027 | 18,239 | 2,212 | 5,663 | 6,955 | 1,292 | 10 | 474 | 22,174 | 14,899 | 8,533 | 6,366 | 7,275 | - 745 | 6,530 | - 192 | 6,338 | 2,020 | 4,318 | - 3,119 | 1,199 | 2020 |
| 2021 | 770 | 1,108,885 | 16,326 | 18,122 | 1,796 | 6,141 | 7,507 | 1,366 | 11 | 634 | 23,112 | 15,235 | 8,665 | 6,570 | 7,877 | - 34 | 7,843 | - 122 | 7,721 | 2,007 | 5,714 | - 4,440 | 1,274 | 2021 |
| 2022 | 733 | 1,165,801 | 17,829 | 19,638 | 1,809 | 6,242 | 7,570 | 1,328 | 10 | 1,109 | 25,190 | 15,752 | 8,835 | 6,917 | 9,438 | - 4,040 | 5,398 | - 861 | 4,537 | 1,120 | 3,417 | - 2,288 | 1,129 | 2022 |
| 2023 | 693 | 1,160,222 | 20,337 | 27,901 | 7,564 | 6,270 | 7,557 | 1,287 | 9 | 1,085 | 27,701 | 16,696 | 9,314 | 7,382 | 11,005 | - 1,205 | 9,800 | - 541 | 9,259 | 2,547 | 6,712 | - 5,206 | 1,506 | 2023 |
| | Mortgage banks^8^ ||||||||||||||||||||||| |
| 2018 | 11 | 233,165 | 1,732 | 6,975 | 5,243 | - 80 | 97 | 177 | 6 | - 27 | 1,631 | 975 | 449 | 526 | 656 | - 341 | 315 | - 95 | 220 | 128 | 92 | - 795 | - 703 | 2018 |
| 2019 | 10 | 234,978 | 1,908 | 6,576 | 4,668 | - 109 | 116 | 225 | 0 | 15 | 1,814 | 929 | 428 | 501 | 885 | - 125 | 760 | - 217 | 543 | 160 | 383 | - 229 | 154 | 2019 |
| 2020 | 10 | 241,909 | 2,024 | 6,020 | 3,996 | - 123 | 109 | 232 | 0 | - 72 | 1,829 | 896 | 405 | 491 | 933 | - 357 | 576 | 271 | 847 | 700 | 147 | 19 | 166 | 2020 |
| 2021 | 9 | 232,447 | 2,121 | 5,452 | 3,331 | - 144 | 122 | 266 | 0 | - 335 | 1,642 | 862 | 404 | 458 | 780 | - 156 | 624 | 1,043 | 1,667 | 1,102 | 565 | 166 | 731 | 2021 |
| 2022 | 8 | 235,064 | 2,117 | 5,620 | 3,503 | - 102 | 121 | 223 | 0 | - 6 | 2,009 | 951 | 462 | 489 | 1,058 | - 301 | 757 | - 223 | 534 | 199 | 335 | - 124 | 211 | 2022 |
| 2023 | 7 | 225,456 | 2,170 | 8,078 | 5,908 | - 70 | 85 | 155 | 0 | 103 | 2,203 | 925 | 433 | 492 | 1,278 | - 552 | 726 | 22 | 748 | 269 | 479 | - 353 | 126 | 2023 |
| | Building and loan associations ||||||||||||||||||||||| |
| 2018 | 20 | 233,865 | 2,653 | 5,661 | 3,008 | - 500 | 1,295 | 1,795 | 0 | 14 | 2,167 | 1,921 | 696 | 1,225 | 246 | 22 | 268 | - 14 | 254 | 137 | 117 | 13 | 130 | 2018 |
| 2019 | 19 | 237,363 | 2,438 | 5,566 | 3,128 | - 548 | 1,309 | 1,857 | 0 | 52 | 1,942 | 1,838 | 647 | 1,191 | 104 | 49 | 153 | 303 | 456 | 105 | 351 | - 139 | 212 | 2019 |
| 2020 | 18 | 242,190 | 2,520 | 5,103 | 2,583 | - 493 | 1,270 | 1,763 | 0 | 30 | 2,057 | 1,880 | 661 | 1,219 | 177 | - 82 | 95 | 108 | 203 | 98 | 105 | 95 | 200 | 2020 |
| 2021 | 18 | 249,553 | 2,505 | 4,785 | 2,280 | - 389 | 1,295 | 1,684 | 0 | 26 | 2,142 | 2,005 | 752 | 1,253 | 137 | - 16 | 121 | 53 | 174 | 113 | 61 | 26 | 87 | 2021 |
| 2022 | 18 | 259,381 | 2,607 | 4,508 | 1,901 | - 174 | 1,834 | 2,008 | 0 | 393 | 2,826 | 2,209 | 991 | 1,218 | 617 | - 129 | 488 | - 138 | 350 | 143 | 207 | - 112 | 95 | 2022 |
| 2023 | 14 | 244,652 | 2,876 | 5,268 | 2,392 | - 178 | 1,565 | 1,743 | 0 | 197 | 2,895 | 2,042 | 809 | 1,233 | 853 | - 92 | 761 | - 255 | 506 | 262 | 244 | - 97 | 147 | 2023 |
| | Banks with special, development and other central support tasks ||||||||||||||||||||||| |
| 2018 | 19 | 1,263,482 | 4,988 | 21,147 | 16,159 | 1,389 | 2,083 | 694 | 363 | - 104 | 6,636 | 4,352 | 2,214 | 2,138 | 2,284 | - 197 | 2,087 | - 755 | 1,332 | 146 | 1,186 | - 894 | 292 | 2018 |
| 2019 | 19 | 1,333 ,52 | 5,121 | 20,216 | 15,095 | 1,607 | 2,348 | 741 | 427 | - 212 | 6,943 | 4,145 | 2,037 | 2,108 | 2,798 | - 686 | 2,112 | - 65 | 2,047 | 428 | 1,619 | - 1,387 | 232 | 2019 |
| 2020 | 19 | 1,421,184 | 5,396 | 16,360 | 10,964 | 1,844 | 2,627 | 783 | 372 | - 2 | 7,610 | 4,277 | 2,097 | 2,180 | 3,333 | - 1,159 | 2,174 | 77 | 2,251 | 538 | 1,713 | - 1,324 | 389 | 2020 |
| 2021 | 18 | 1,468,095 | 5,635 | 13,692 | 8,057 | 2,007 | 2,892 | 885 | 507 | 88 | 8,237 | 4,568 | 2,235 | 2,333 | 3,669 | - 799 | 2,870 | 303 | 3,173 | 1,054 | 2,119 | - 1,153 | 966 | 2021 |
| 2022 | 18 | 1,619,799 | 5,280 | 21,958 | 16,678 | 2,012 | 2,940 | 928 | 1,179 | 61 | 8,532 | 5,065 | 2,555 | 2,510 | 3,467 | - 931 | 2,536 | - 118 | 2,418 | 415 | 2,003 | - 1,292 | 711 | 2022 |
| 2023 | 18 | 1,629,135 | 6,521 | 48,166 | 41,645 | 1,924 | 2,859 | 935 | 429 | 445 | 9,319 | 5,279 | 2,488 | 2,791 | 4,040 | - 257 | 3,783 | - 339 | 3,444 | 191 | 3,253 | - 2,064 | 1,189 | 2023 |
| | Memo item: banks majority-owned by foreign banks^9^ ||||| | | | | | | | | | | | | |||||| |
| 2018 | 33 | 763,177 | 9,252 | 12,327 | 3,075 | 3,042 | 4,711 | 1,669 | 436 | - 340 | 12,390 | 8,717 | 4,064 | 4,653 | 3,673 | - 994 | 2,679 | - 992 | 1,687 | 586 | 1,101 | - 518 | 583 | 2018 |
| 2019 | 32 | 849,008 | 9,683 | 12,911 | 3,228 | 3,520 | 5,338 | 1,818 | 546 | 1,184 | 14,933 | 9,612 | 4,611 | 5,001 | 5,321 | - 164 | 5,157 | - 1,952 | 3,205 | 1,189 | 2,016 | 2,664 | 4,680 | 2019 |
| 2020 | 34 | 973,655 | 9,350 | 11,328 | 1,978 | 4,640 | 6,756 | 2,116 | 539 | 650 | 15,179 | 9,531 | 4,587 | 4,944 | 5,648 | - 1,869 | 3,779 | - 1,255 | 2,524 | 1,175 | 1,349 | 846 | 2,195 | 2020 |
| 2021 | 35 | 1,236,335 | 9,238 | 10,296 | 1,058 | 6,858 | 9,737 | 2,879 | 1,526 | 242 | 17,864 | 12,134 | 6,350 | 5,784 | 5,730 | - 581 | 5,149 | - 495 | 4,654 | 2,483 | 2,171 | 647 | 2,818 | 2021 |
| 2022 | 31 | 1,872,399 | 10,869 | 15,104 | 4,235 | 7,018 | 10,163 | 3,145 | 2,994 | 1,037 | 21,918 | 13,729 | 6,651 | 7,078 | 8,189 | - 2,158 | 6,031 | - 2,052 | 3,979 | 815 | 3,164 | - 768 | 2,396 | 2022 |
| 2023 | 29 | 2,022,854 | 12,472 | 35,377 | 22,905 | 6,712 | 9,601 | 2,889 | 4,453 | 967 | 24,604 | 13,221 | 6,188 | 7,033 | 11,383 | - 815 | 10,568 | - 3,134 | 7,434 | 2,796 | 4,638 | - 480 | 4,158 | 2023 |
{#par-e349a3}
| **Table 3.9: Credit institutions' charge items** ^1^ ||||||||||||||||||||||| |
| Financial year | Number of reporting institutions | Charges, € billion ||||||||||||||||||||| Financial year |
| Financial year | Number of reporting institutions | Total | Interest paid | Commissions paid | Net loss from the trading portfolio | Gross loss on transactions in goods and subsidiary transactions | General administrative spending |||||| Depreciation of and value adjustments to tangible and intangible assets || Other operating charges | Depreciation of and value adjustments to loans and advances, and provisions for contingent liabilities and for commitments | Depreciation of and value adjustments to participating interests, shares in affiliated enterprises and securities treated as fixed assets | Charges incurred from loss transfers | Extraordinary charges | Taxes on income and earnings | Other taxes | Profits transferred under profit pooling, a profit transfer agreement or a partial profit transfer agreement | Financial year |
| Financial year | Number of reporting institutions | Total | Interest paid | Commissions paid | Net loss from the trading portfolio | Gross loss on transactions in goods and subsidiary transactions | Total | Staff costs |||| Other administrative spending^2^ | Depreciation of and value adjustments to tangible and intangible assets || Other operating charges | Depreciation of and value adjustments to loans and advances, and provisions for contingent liabilities and for commitments | Depreciation of and value adjustments to participating interests, shares in affiliated enterprises and securities treated as fixed assets | Charges incurred from loss transfers | Extraordinary charges | Taxes on income and earnings | Other taxes | Profits transferred under profit pooling, a profit transfer agreement or a partial profit transfer agreement | Financial year |
| Financial year | Number of reporting institutions | Total | Interest paid | Commissions paid | Net loss from the trading portfolio | Gross loss on transactions in goods and subsidiary transactions | Total | Total | Wages and salaries | Social security costs and costs relating to pensions and other benefits || Other administrative spending^2^ | Depreciation of and value adjustments to tangible and intangible assets || Other operating charges | Depreciation of and value adjustments to loans and advances, and provisions for contingent liabilities and for commitments | Depreciation of and value adjustments to participating interests, shares in affiliated enterprises and securities treated as fixed assets | Charges incurred from loss transfers | Extraordinary charges | Taxes on income and earnings | Other taxes | Profits transferred under profit pooling, a profit transfer agreement or a partial profit transfer agreement | Financial year |
| Financial year | Number of reporting institutions | Total | Interest paid | Commissions paid | Net loss from the trading portfolio | Gross loss on transactions in goods and subsidiary transactions | Total | Total | Wages and salaries | Total | of which: Pensions | Other administrative spending^2^ | Total | of which: Assets leased | Other operating charges | Depreciation of and value adjustments to loans and advances, and provisions for contingent liabilities and for commitments | Depreciation of and value adjustments to participating interests, shares in affiliated enterprises and securities treated as fixed assets | Charges incurred from loss transfers | Extraordinary charges | Taxes on income and earnings | Other taxes | Profits transferred under profit pooling, a profit transfer agreement or a partial profit transfer agreement | |
|----------------|----------------------------------|-------|---------------|------------------|-------------------------------------|-----------------------------------------------------------------|-------|-------|--------------------|-------|--------------------|----------------------------------|-------|-------------------------|-------------------------|----------------------------------------------------------------------------------------------------------------------------|-------------------------------------------------------------------------------------------------------------------------------------------|--------------------------------------|-----------------------|------------------------------|-------------|--------------------------------------------------------------------------------------------------------------|----------------|
| 2015 | 1,679 | 256.6 | 105.0 | 14.1 | 0.5 | 0.0 | 86.0 | 46.0 | 36.4 | 9.6 | 3.7 | 39.9 | 5.9 | 1.8 | 17.9 | 7.2 | 3.6 | 1.2 | 2.5 | 8.4 | 0.3 | 4.1 | 2015 |
| 2016 | 1,611 | 240.9 | 90.4 | 13.5 | 0.2 | 0.0 | 84.4 | 44.6 | 36.1 | 8.6 | 2.7 | 39.8 | 6.6 | 2.3 | 13.8 | 12.7 | 3.7 | 0.9 | 1.8 | 7.9 | 0.3 | 4.7 | 2016 |
| 2017 | 1,538 | 224.1 | 79.9 | 13.6 | 0.0 | 0.0 | 84.0 | 44.6 | 35.6 | 8.9 | 2.9 | 39.4 | 7.0 | 2.6 | 14.8 | 8.3 | 1.5 | 0.6 | 2.3 | 7.5 | 0.3 | 4.3 | 2017 |
| 2018 | 1,484 | 226.9 | 80.6 | 13.6 | 0.0 | 0.0 | 83.6 | 44.3 | 34.6 | 9.7 | 3.9 | 39.4 | 7.4 | 2.9 | 15.2 | 10.0 | 1.7 | 0.5 | 1.7 | 6.7 | 0.2 | 5.7 | 2018 |
| 2019 | 1,440 | 242.0 | 80.4 | 14.5 | 0.1 | 0.0 | 84.8 | 44.4 | 34.9 | 9.6 | 3.6 | 40.3 | 9.2 | 3.7 | 14.7 | 10.0 | 12.2 | 0.9 | 3.2 | 7.8 | 0.3 | 4.1 | 2019 |
| 2020 | 1,408 | 211.0 | 59.4 | 14.5 | 0.1 | 0.0 | 82.6 | 44.2 | 34.7 | 9.5 | 3.6 | 38.3 | 8.5 | 4.0 | 12.2 | 14.9 | 2.8 | 0.3 | 4.0 | 8.4 | 0.2 | 2.9 | 2020 |
| 2021 | 1,358 | 204.0 | 49.4 | 15.7 | 0.0 | 0.0 | 87.1 | 46.7 | 36.4 | 10.3 | 4.4 | 40.4 | 9.4 | 4.5 | 16.0 | 7.0 | 1.5 | 0.3 | 3.6 | 9.8 | 0.3 | 3.9 | 2021 |
| 2022 | 1,302 | 247.9 | 75.4 | 16.7 | 0.0 | 0.0 | 90.5 | 48.4 | 36.6 | 11.9 | 5.9 | 42.1 | 9.4 | 5.0 | 22.9 | 18.4 | 3.4 | 0.6 | 1.0 | 5.5 | 0.3 | 3.7 | 2022 |
| 2023 | 1,240 | 392.8 | 224.6 | 15.1 | 0.0 | 0.0 | 92.3 | 48.6 | 38.2 | 10.4 | 4.1 | 43.7 | 9.6 | 4.6 | 15.8 | 11.9 | 2.5 | 0.5 | 0.8 | 12.6 | 0.3 | 6.8 | 2023 |
{#par-eea62o}
| **Table 3.10:** **Credit institutions' income items** ^1^ ||||||||||||||||||| |
| Financial year | Income, € billion |||||||||||||||||| Financial year |
| Financial year | Total | Interest received ||| Current income |||| Profits transferred under profit pooling, a profit transfer agreement or a partial profit transfer agreement | Commissions received | Net profit from the trading portfolio | Gross profit on transactions in goods and subsidiary transactions | Value readjustments to loans and advances, and provisions for contingent liabilities and for commitments | Value readjustments to participating interests, shares in affiliated enterprises and securities treated as fixed assets | Other operating income || Extraordinary income | Income from loss transfers | Financial year |
| Financial year | Total | Total | from lending and money market transactions | from debt securities and debt register claims | Total | from shares and other variable yield securities | from participating interests^2^ | from shares in affiliated enterprises | Profits transferred under profit pooling, a profit transfer agreement or a partial profit transfer agreement | Commissions received | Net profit from the trading portfolio | Gross profit on transactions in goods and subsidiary transactions | Value readjustments to loans and advances, and provisions for contingent liabilities and for commitments | Value readjustments to participating interests, shares in affiliated enterprises and securities treated as fixed assets | Total | of which: From leasing business | Extraordinary income | Income from loss transfers | Financial year |
|----------------|-------|-------|--------------------------------------------|-----------------------------------------------|-------|-------------------------------------------------|---------------------------------|---------------------------------------|--------------------------------------------------------------------------------------------------------------|----------------------|---------------------------------------|-------------------------------------------------------------------|----------------------------------------------------------------------------------------------------------|-------------------------------------------------------------------------------------------------------------------------|-------|---------------------------------|----------------------|----------------------------|----------------|
| 2015 | 274.7 | 183.1 | 160.1 | 22.9 | 15.0 | 6.7 | 1.8 | 6.5 | 2.8 | 44.5 | 4.2 | 0.2 | 3.8 | 1.9 | 17.6 | 4.7 | 0.5 | 1.1 | 2015 |
| 2016 | 260.8 | 166.8 | 147.1 | 19.7 | 10.0 | 5.8 | 1.3 | 2.9 | 4.7 | 43.2 | 3.3 | 0.2 | 4.0 | 3.4 | 20.3 | 5.5 | 4.9 | 0.0 | 2016 |
| 2017 | 244.1 | 151.0 | 134.4 | 16.5 | 11.0 | 6.9 | 1.1 | 3.0 | 3.4 | 44.2 | 5.6 | 0.2 | 4.7 | 3.1 | 18.8 | 6.0 | 1.6 | 0.6 | 2017 |
| 2018 | 239.1 | 152.4 | 136.9 | 15.5 | 10.0 | 5.3 | 1.1 | 3.5 | 5.4 | 43.1 | 3.5 | 0.2 | 3.3 | 0.9 | 18.5 | 6.3 | 1.2 | 0.7 | 2018 |
| 2019 | 239.8 | 152.2 | 137.5 | 14.7 | 7.6 | 4.8 | 1.1 | 1.7 | 3.0 | 45.8 | 2.5 | 0.2 | 3.3 | 1.6 | 21.0 | 8.4 | 1.9 | 0.7 | 2019 |
| 2020 | 216.9 | 131.4 | 119.1 | 12.3 | 6.0 | 3.5 | 0.6 | 1.9 | 3.2 | 46.7 | 3.6 | 0.2 | 1.6 | 1.4 | 20.0 | 9.1 | 2.3 | 0.6 | 2020 |
| 2021 | 221.2 | 121.8 | 111.8 | 10.0 | 7.1 | 4.0 | 1.3 | 1.7 | 2.7 | 53.6 | 4.9 | 0.2 | 3.4 | 2.1 | 21.7 | 10.5 | 2.4 | 1.2 | 2021 |
| 2022 | 269.7 | 156.5 | 144.7 | 11.7 | 8.1 | 3.9 | 1.2 | 3.0 | 2.4 | 54.6 | 9.8 | 0.2 | 2.1 | 5.2 | 29.8 | 11.4 | 0.9 | 0.0 | 2022 |
| 2023 | 428.9 | 320.6 | 294.9 | 25.6 | 7.9 | 3.8 | 1.4 | 2.8 | 2.9 | 52.7 | 11.6 | 0.2 | 1.6 | 1.6 | 28.8 | 11.0 | 1.1 | 0.0 | 2023 |
{#par-u94773}
1. {#_ftn_root_1} See Deutsche Bundesbank (2023a), p. 14.
2. {#_ftn_root_2} See Deutsche Bundesbank (2023a), p. 81.
3. {#_ftn_root_3} See Deutsche Bundesbank (2024a), p. 17.
4. {#_ftn_root_4} See Deutsche Bundesbank (2024a), p. 19.
5. {#_ftn_root_5} See Deutsche Bundesbank (2023a), p. 14.
6. {#_ftn_root_6} See Deutsche Bundesbank (2023b), p. 35.
7. {#_ftn_root_7} See Deutsche Bundesbank (2023b), p. 35, Deutsche Bundesbank (2023c), p. 41, Deutsche Bundesbank (2023d), p. 38 and Deutsche Bundesbank (2024b), p. 37.
8. {#_ftn_root_8} The total number of credit institutions fell by 56 to 1,340 in 2023, and the number of domestic branches declined by 944 to a total of 19,488.
9. {#_ftn_root_9} See Deutsche Bundesbank (2024c).
10. {#_ftn_root_10} See Deutsche Bundesbank (2024a), p. 65.
11. {#_ftn_root_11} See Deutsche Bundesbank (2024b), p. 34, Deutsche Bundesbank (2023d), p. 34, Deutsche Bundesbank (2023c), p. 37 and Deutsche Bundesbank (2023b), p. 31.
12. {#_ftn_root_12} See Deutsche Bundesbank (2024b), p. 34, Deutsche Bundesbank (2023d), pp. 34 f., Deutsche Bundesbank (2023c), pp. 37 ff. and Deutsche Bundesbank (2023b), pp. 31. Detailed information can be found [here](https://www.bundesbank.de/content/919298), in the chart entitled "Changes in credit standards for loans to enterprises and contributing factors".
13. {#_ftn_root_13} See Deutsche Bundesbank (2024b), p. 34, Deutsche Bundesbank (2023d), p. 35, Deutsche Bundesbank (2023c), p. 39 and Deutsche Bundesbank (2023b), p. 32.
14. {#_ftn_root_14} See Deutsche Bundesbank (2023d), p. 35, Deutsche Bundesbank (2023c), p. 40 and Deutsche Bundesbank (2023b), p. 32. Detailed information can be found [here](https://www.bundesbank.de/content/919298), in the chart entitled "Changes in credit standards for loans to households for house purchase and contributing factors".
15. {#_ftn_root_15} See Deutsche Bundesbank (2024b), p. 33, Deutsche Bundesbank (2023d), pp. 33 f., Deutsche Bundesbank (2023c), pp. 37 and Deutsche Bundesbank (2023b), p. 30.
16. {#_ftn_root_16} The 25-year span corresponds to the period covered by the statistics on banks' profit and loss accounts (profit and loss statistics), beginning in 1999. The data from the profit and loss statistics form the basis for the commentary in this article. For more information, see the supplementary information under "Methodological notes".
17. {#_ftn_root_17} Big banks, regional banks and other commercial banks, branches of foreign banks, Landesbanken, savings banks, credit cooperatives, mortgage banks, building and loan associations as well as banks with special, development and other central support tasks.
18. {#_ftn_root_18} Operating income less administrative spending and net valuation charges plus the balance of other and extraordinary items.
19. {#_ftn_root_19} It should be borne in mind, though, that over the last 25 years, German credit institutions' aggregate average total assets for the year also climbed by more than 70%. Annual growth rates have been in positive territory since 2019 in particular, whilst in the period from 1999 to 2018 total assets fluctuated but tended to move sideways. As such, the significant improvement in performance at the current end is likely to be partly due to the expansion in business volumes over recent years.
20. {#_ftn_root_20} Big banks, regional banks and other commercial banks, branches of foreign banks, Landesbanken, savings banks, credit cooperatives, mortgage banks, building and loan associations as well as banks with special, development and other central support tasks.
21. {#_ftn_root_21} Sum of net interest income, net commission income, result from the trading portfolio and other operating result.
22. {#_ftn_root_22} In 2022 operating income had increased by €14.9 billion (+11.8%).
23. {#_ftn_root_23} Big banks, regional banks and other commercial banks, branches of foreign banks, Landesbanken, savings banks, credit cooperatives, mortgage banks, building and loan associations as well as banks with special, development and other central support tasks.
24. {#_ftn_root_24} In 2022, net interest income had increased by €9.4 billion (+11.4%) to €91.6 billion.
25. {#_ftn_root_25} See Deutsche Bundesbank (2024b), p. 36, Deutsche Bundesbank (2023d), p. 37 and Deutsche Bundesbank (2023b), p. 34.
26. {#_ftn_root_26} See Deutsche Bundesbank (2023e), pp. 59f.
27. {#_ftn_root_27} See also Deutsche Bundesbank (2023a), p. 15 and pp. 41 f.
28. {#_ftn_root_28} See also Deutsche Bundesbank (2023a), pp. 41 f.
29. {#_ftn_root_29} In 2022, German banks' interest income from deposits held at the central bank amounted to only around €2 billion. See Deutsche Bundesbank (2024a), p. 84.
30. {#_ftn_root_30} This income was many times greater than the negative interest paid to the Eurosystem during the negative interest rate policy period.
31. {#_ftn_root_31} Owing to the negative remuneration of TLTRO III, German banks still generated interest income from monetary policy refinancing operations to the tune of roughly €2 billion in 2022. See Deutsche Bundesbank (2024a), p. 84.
32. {#_ftn_root_32} Big banks, regional banks and other commercial banks, branches of foreign banks, Landesbanken, savings banks, credit cooperatives, mortgage banks, building and loan associations as well as banks with special, development and other central support tasks.
33. {#_ftn_root_33} However, developments at individual institutions were not uniform. Whilst individual institutions in the category of big banks reported higher net interest income in the reporting year than in the previous year, others reported declines or figures on a par with the 2022 level. Overall, positive and negative changes in net interest income within this category of banks largely balanced each other out.
34. {#_ftn_root_34} Net interest income in relation to average total assets for the year.
35. {#_ftn_root_35} Net commission income in relation to average aggregate total assets for the year.
36. {#_ftn_root_36} See Deutsche Bundesbank (2024b), p. 36, Deutsche Bundesbank (2023d), p. 37 and Deutsche Bundesbank (2023b), p. 34.
37. {#_ftn_root_37} Summary item used to record income and charges from operating business that have no connection to net interest income, net commission income or the trading result. It includes leasing expenses and income, the gross result for transactions in goods and subsidiary transactions, depreciation of assets leased, other operating charges and income, and other taxes as well as withdrawals from and transfers to the fund required by the building and loan association rules (only for building and loan associations).
38. {#_ftn_root_38} Net valuation charges comprise the effects of value adjustments, write-ups and write-downs on accounts receivable and securities in the liquidity reserve. In addition, income and charges in connection with transfers from and to loan-loss provisions are taken into account, as are transfers and releases relating to undisclosed reserves pursuant to Section 340f of the German Commercial Code. However, due to the cross-offsetting option permissible under the Commercial Code, the annual accounts do not show the extent to which undisclosed reserves have been formed or released.
39. {#_ftn_root_39} Around 64% of savings banks and roughly 75% of credit cooperatives reported a drop in net valuation charges compared with the previous year.
40. {#_ftn_root_40} General administrative spending encompasses staff costs and other administrative spending. Other administrative spending includes, for example, investment in product development, information technology, and digitalisation. In addition, other administrative spending also comprises depreciation of and value adjustments to tangible and intangible assets.
41. {#_ftn_root_41} General administrative spending rose by 3.3% in 2022.
42. {#_ftn_root_42} The other and extraordinary account includes depreciation of and value adjustments to participating interests, shares in affiliated enterprises and securities treated as fixed assets, income from value readjustments to participating interests, shares in affiliated enterprises and securities treated as fixed assets, charges and income from loss transfers, extraordinary charges and income as well as profits transferred under profit pooling, a profit transfer agreement or a partial profit transfer agreement.
43. {#_ftn_root_43} In 2022, one institution in the category of big banks generated high income from value readjustments to participating interests and shares in affiliated enterprises. This significantly boosted the balance in the other and extraordinary account for German banks as an aggregate.
44. {#_ftn_root_44} Ratio of profit for the financial year before tax to annual average total assets.
45. {#_ftn_root_45} The return on assets in 2023 thus also stood well above the long-term average of 0.23%.
46. {#_ftn_root_46} In 2023, the return on equity (profit for the financial year before tax in relation to the average balance sheet equity for the year) followed a similar pattern to the return on assets. Although, at 8.39%, it reached a record high for the last ten years, much higher figures were observed over the last 25 years, especially in 1999 (11.26%) and 2005 (12.87%). Similar to the return on assets, the increase in the return on equity was likewise chiefly a result of the rise in the profit for the financial year before tax. However, stronger growth in equity compared with total assets dampened the increase in the return on equity slightly. Big banks generated the largest return on equity in 2023, at 12.12%. Posting figures of 10.22% and 8.92%, respectively, savings banks and credit cooperatives did not come close to the level of the big banks. Compared with the aggregate of all German credit institutions, however, savings banks and credit cooperatives also achieved an above-average return on equity.
47. {#_ftn_root_47} General administrative spending in relation to operating income.
48. {#_ftn_root_48} See Deutsche Bundesbank (2024f).
*[APP]: asset purchase programme
*[TLTRO]: targeted longer-term refinancing operations
*[BFA]: Bankenfachausschuss
*[**US**]: United States
*[US]: United States