# German enterprises’ profitability and financing in 2023 during the period of monetary policy tightening
* [*1 Underlying trends*](#tar-1 "1 Underlying trends")
* *[*2 Development of corporate insolvencies*](#tar-2 "2 Development of corporate insolvencies")*
* **[*19 pandemic*](#tar-3 "19 pandemic")**
* ***[*3 The impact of monetary policy tightening on business investment and financing*](#tar-4 "3 The impact of monetary policy tightening on business investment and financing")***
* ***[*4 Sales and income*](#tar-5 "4 Sales and income")***
* ***[*5 Balance sheet developments*](#tar-6 "5 Balance sheet developments")***
* ***[*The adoption and objectives of artificial intelligence in German firms*](#tar-7 "The adoption and objectives of artificial intelligence in German firms")***
* ***[*Profitability and financial position of German listed groups in 2023 and an outlook for 2024*](#tar-8 "Profitability and financial position of German listed groups in 2023 and an outlook for 2024 ")***
* ***[*6 Conclusion*](#tar-9 "6 Conclusion")***
* ***[*List of references*](#tar-10 "List of references")***
****Although the German economy was virtually stagnant, the profitability of non-financial corporations improved in 2023, with their pre-tax profit margin rising significantly to 5.3 % from 4.2 % in the previous year. This was mainly due to lower materials costs: in terms of volume, the fall in the prices for energy and intermediate inputs was greater than the rise in personnel expenses and interest costs. This was particularly true for energy companies, which benefited considerably from lower energy prices. On the income side, revenues rose only slightly in an environment of continued high inflation. Interest income and income from other long-term equity investments were the major contributors to profit margins, with the latter factor playing a particularly important role in transport equipment. Yet even without the one-off developments in the energy company and transport equipment sectors, the profit margin of non-financial enterprises remained high. With regard to their profitability, German enterprises seem to have coped well with the stagnation of economic activity in 2023.****{#par-io92u5}
****Starting from a low level, corporate insolvencies rose sharply in 2023, mainly owing to the poor economic situation, catch-up and normalisation effects following the pandemic, and higher financing costs. Contact-intensive areas such as retail and the hotel and restaurant sector were particularly hard hit, as were sectors that tend to be more sensitive to interest rates, such as construction and real estate. The sector and business-related services, which experienced exceptionally high demand during the pandemic, also contributed significantly to the increase.****{#par-aie393}
****In 2023, monetary policy tightening also pushed up the average interest rate on bank loans to non-financial corporations in Germany. Estimates using firm-level data from the Bundesbank show that contractionary monetary policy shocks already tend to dampen investment by non-financial corporations in Germany in the same year. The strongest impact is estimated to occur after about two years. Consistent with this, the interest rate reversal had left only moderate traces in enterprises' financial statements by the end of 2023.****{#par-i73361}
****Despite the weak state of the economy, enterprises remained well positioned in 2023 in terms of their liquidity and stability. The equity ratio rose again in 2023, having fallen over the previous three years, but remains below its pre-pandemic level. Enterprises' liquidity positions also remained favourable in 2023 and liquidity needs trended lower. The good profitability, solvency and liquidity position of enterprises in the non-financial corporate sector as a whole largely reflects developments across sectors.****{#par-u8u738}
****The ongoing economic weakness is likely to continue to weigh on enterprises' business activity and thus their sales growth in 2024. At the same time, the pressure on costs is expected to remain high due to persistently high financing and energy costs, as well as the sharp rise in wages. Cost factors are placing a particular strain on the competitive position of the industrial sector. On balance, this is likely to have a negative impact on profitability in some parts of the corporate sector in 2024.****{#par-iuu63a}
***1 Underlying trends*** {#tar-1}
----------------------------------
*****The German economy stagnated in 2023, while the tightening of monetary policy increased financing costs.** Real declined by a seasonally-adjusted 0.1 % compared to the previous year, due partly to the structural growth problems of the German economy and partly to weak domestic and foreign demand. Production remained well below medium-term aggregate production capacities. The rise in interest rates and high construction costs dampened investment demand. Gross fixed capital formation, especially in construction, fell. Private consumption also weakened after being a major driver of the economy in the two previous years. High inflation per se depressed real incomes and consumers' willingness to spend. Exports virtually stagnated in the face of weak global demand and a less favourable competitive environment, due in part to the appreciation of the euro. On the production side, the significant decline in the prices of imported intermediate inputs and commodities, especially in the energy sector, eased pressure on the cost structure in industry. Nevertheless, input prices remained above 2021 levels. The stable labour market helped employees to largely achieve their demands for real wage adjustments, increasing enterprises' personnel expenses. On the whole, therefore, the business environment remained difficult despite the fall in energy prices compared to the previous year.***{#par-uu4i52}
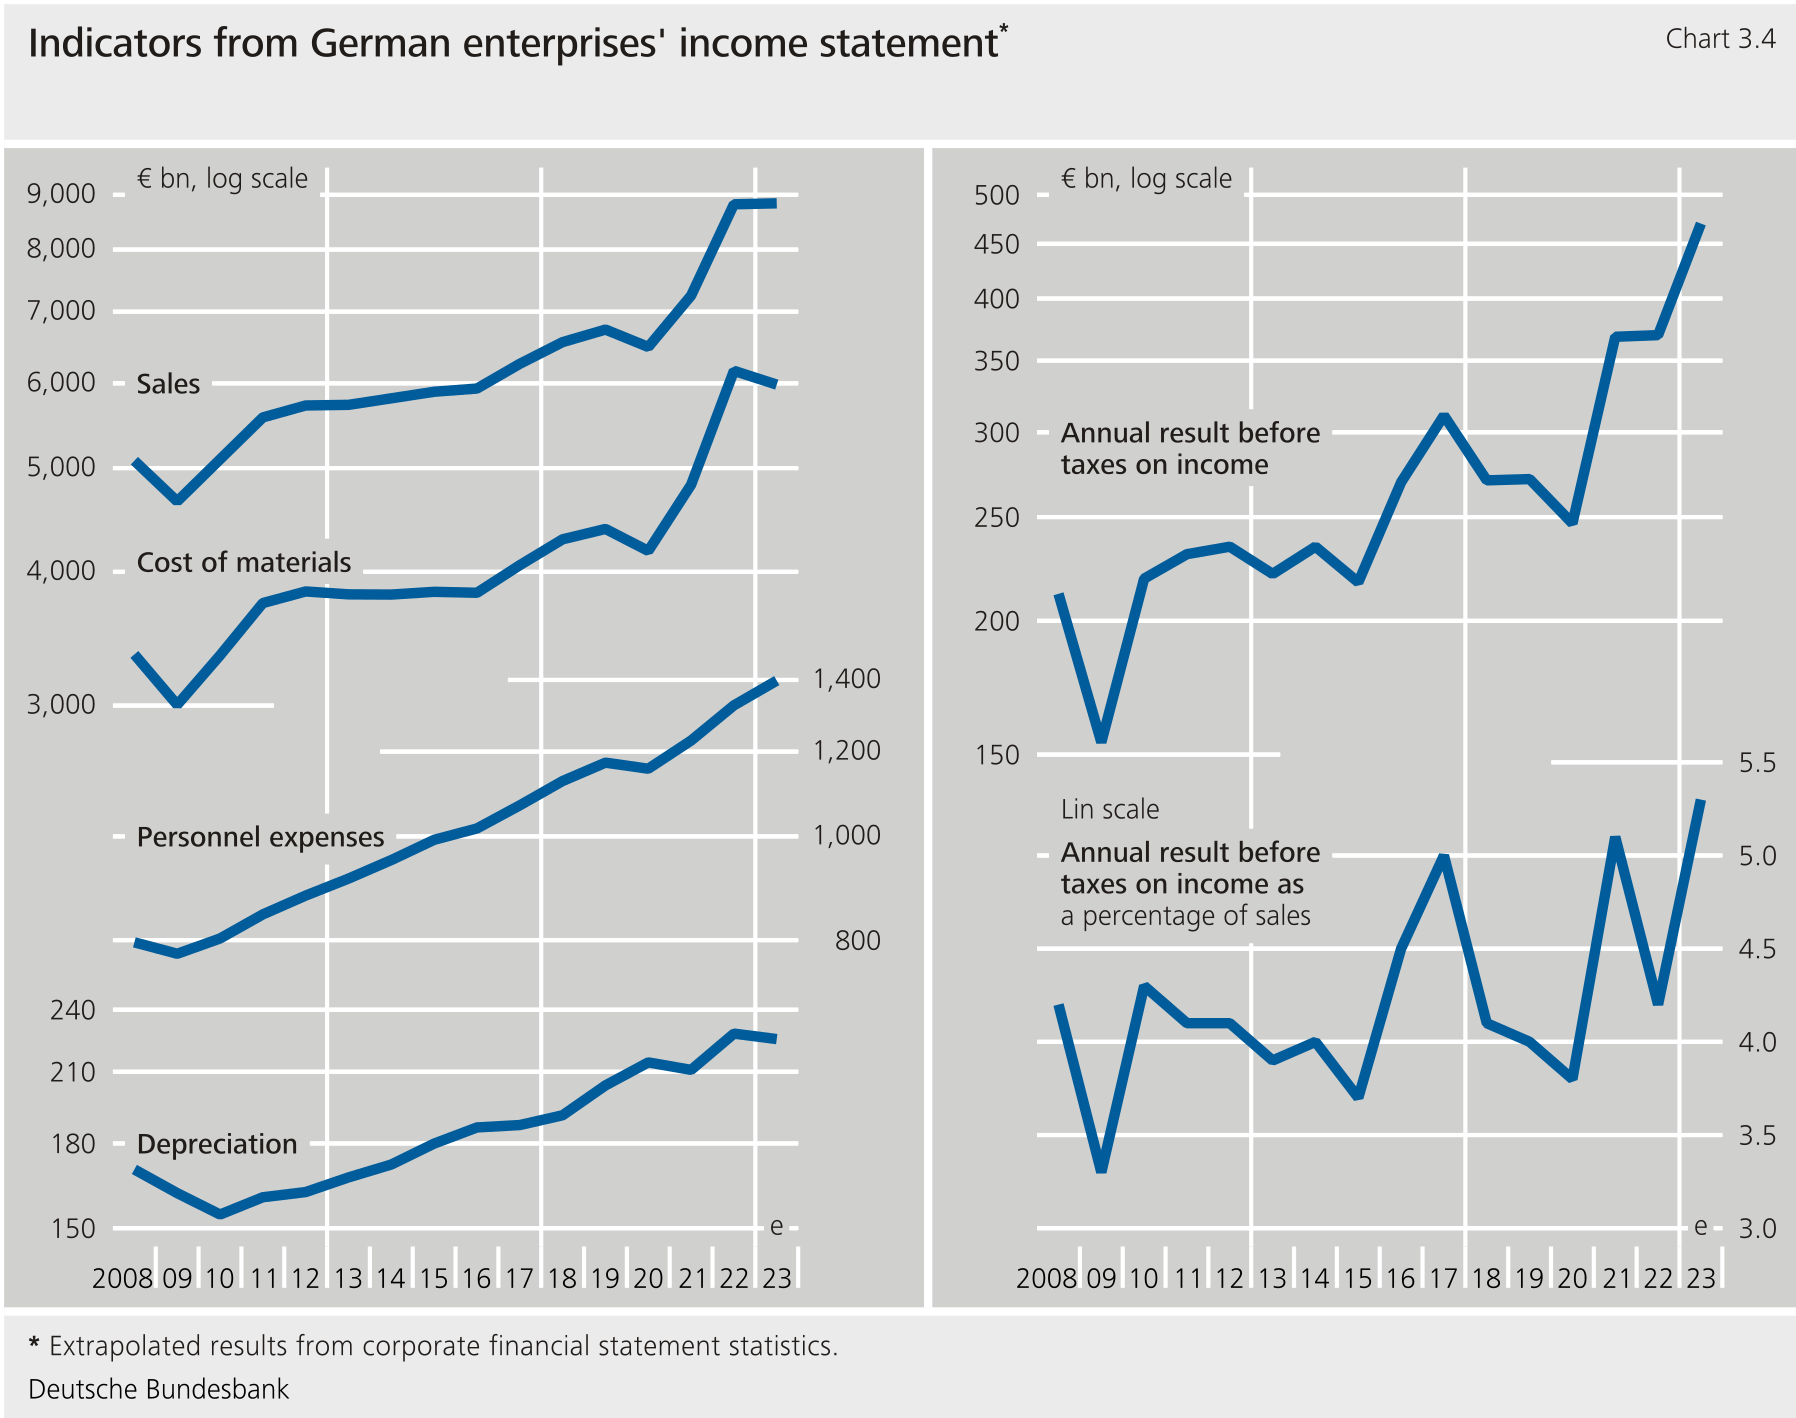
*****Based on the annual financial statements available to date, pre-tax profit margins rose in 2023, from 4.2 % in the previous year to 5.3 %.** [\[1\]](#_ftn_root_1)This was only just below the record figure from 2007. This positive development was due both to cost-side relief and to favourable developments on the income side. Material costs fell significantly due to the decline in prices of intermediate inputs, especially of energy. Despite a slight increase in interest costs, total costs fell significantly because lower material costs more than offset the higher personnel expenses. On the income side, revenues increased slightly. In view of the continuing strong increases in selling prices, the price-adjusted revenues of enterprises are likely to have fallen, however. Nevertheless, interest income and income from other long-term equity investments contributed to an improvement in the earnings of enterprises compared to the previous year.***{#par-i79477}
****Developments in the automotive industry and amongst energy companies contributed to the increase in gross profit margins across the corporate sector.** In contrast to 2022 and most likely also 2024, car sales were comparatively brisk in 2023.[\[2\]](#_ftn_root_2) In addition, the automotive industry realised significant income from participating interests, mainly from abroad, possibly with the aim of smoothing fluctuations in profit in view of the annual financial statements. After recording some major losses in the previous year, energy companies reported their highest annual profits since records began in 1997, boosted by significantly lower material costs. The fact that sales declined less in comparison could indicate that price reductions on the purchasing side were not fully passed on to end customers. This would have significantly increased profit margins.[\[3\]](#_ftn_root_3) Without the contribution of these two sectors, the gross profit margin would have increased by only 0.2 percentage point in 2023.[\[4\]](#_ftn_root_4) But the gross profit margin in 2023 was high in a long-term comparison even without the contribution of these two sectors. With regard to their profitability, German enterprises seem to have coped well with the stagnation of economic activity in 2023.**{#par-u5ue61}
**2 Development of corporate insolvencies** {#tar-2}
----------------------------------------------------
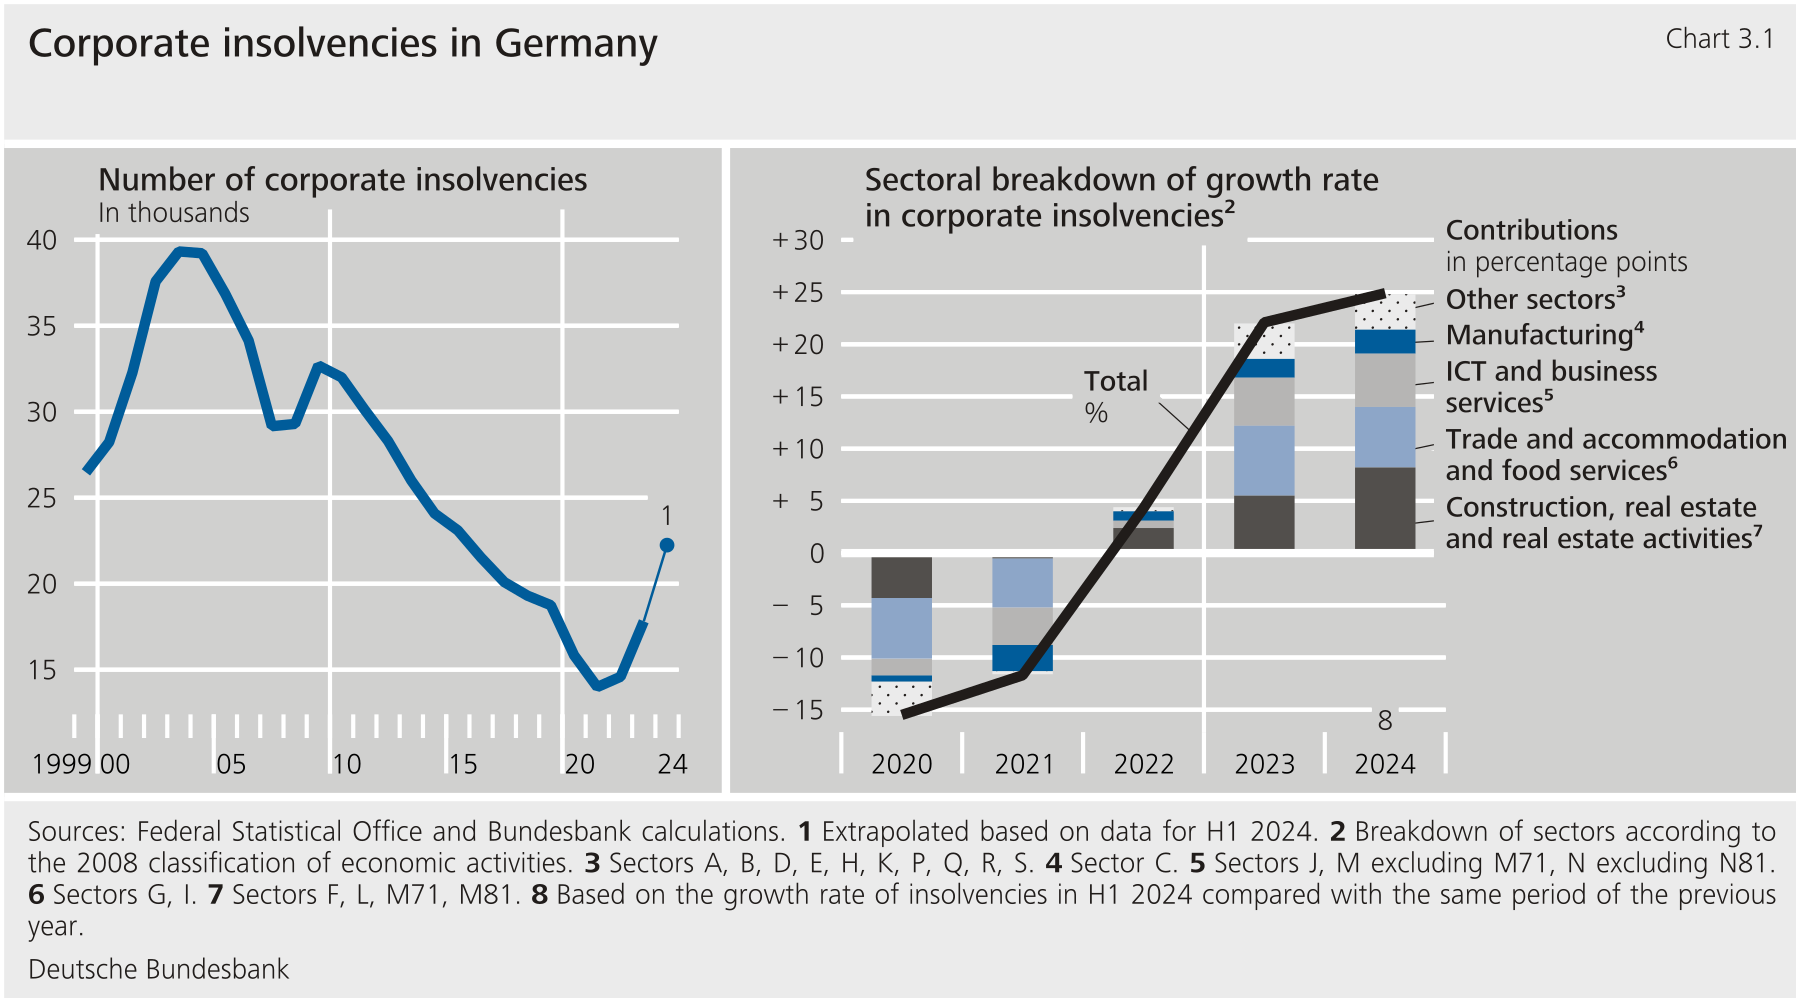
****Corporate insolvencies rose sharply in 2023 year on year** . The increase is due to the weak economic environment as well as to catch-up and normalisation effects in the wake of the pandemic. This applies in particular to the contact-intensive sectors of retail and the hotel and restaurant sector, which accounted for almost a third of the increase in corporate insolvencies in 2023. While economic activity in these sectors declined, in some cases significantly, during the coronavirus pandemic, corporate insolvencies in these industries fell sharply. The main factors in this were probably the suspension of the obligation to file for insolvency and extensive government support measures.[\[5\]](#_ftn_root_5) Despite this development, the share of persistently unprofitable enterprises in Germany did not increase during the pandemic (see the supplementary information entitled "[Zombie firms in Germany during the -19 pandemic](https://preview.publikationen.bundesbank.de/publikationen-en/reports-studies/monthly-reports/monthly-report-december-2024-947276?article=german-enterprises-profitability-and-financing-in-2023-during-the-period-of-monetary-policy-tightening-947298#Zombie-firms-in-Germany-during-the-COVID-19-pandemic)"). Furthermore, by 2023, demand in sectors that had benefited from extremely strong demand during the pandemic is likely to have normalised. This is particularly true of information and communication services and business services, which together contributed slightly over one-fifth of the increase in corporate insolvencies in 2023. Moreover, the rise in corporate insolvencies can be partly attributed to the interest rate reversal in the summer of 2022. Evidence for this can be seen in the sharp increase in insolvencies in interest rate-sensitive segments such as construction, real estate and other real estate-related sectors. Together, they accounted for a little over a quarter of the increase in corporate insolvencies. The manufacturing sector, in contrast, contributed comparatively little.**{#par-u3131e}
{#par-a97o4a}
****
****Zombie firms in Germany during the** -**19 pandemic**** {#tar-3}
--------------------------------------------------------------------
****The phenomenon of zombie firms has once again come to the fore in view of weak productivity growth in Germany.** In the literature, zombie firms are defined as firms that remain in the market despite having been unprofitable for several years.[\[1\]](#_ftn_555_1) They can benefit from the fact that banks grant them particularly favourable lending conditions in order to avoid realising losses from their business with them (something known as evergreening).[\[2\]](#_ftn_555_2) A sufficiently large number of unprofitable firms would impair aggregate productivity growth, as they tie economic resources -- be it labour or capital input -- inefficiently. The low interest rate environment during the years preceding the pandemic had already fuelled concerns that undercapitalised lenders would continue to finance this type of firm. Earlier Bundesbank analyses did not suggest an elevated share of zombie firms in Germany.[\[3\]](#_ftn_555_3) During the -19 pandemic, German enterprises were granted extensive government support measures. This includes loans in which the development bank Kreditanstalt für Wiederaufbau () assumed a large part of the default risk. In addition, the obligation to file for insolvency was temporarily suspended. These measures were intended to support firms that had suffered large losses in turnover and earnings as a result of the pandemic and the measures taken to contain it and to prevent fundamentally profitable firms from exiting the market. However, previously unprofitable enterprises may also have benefited from the support measures.**{#par-u162io}
{#par-o53ee8}
**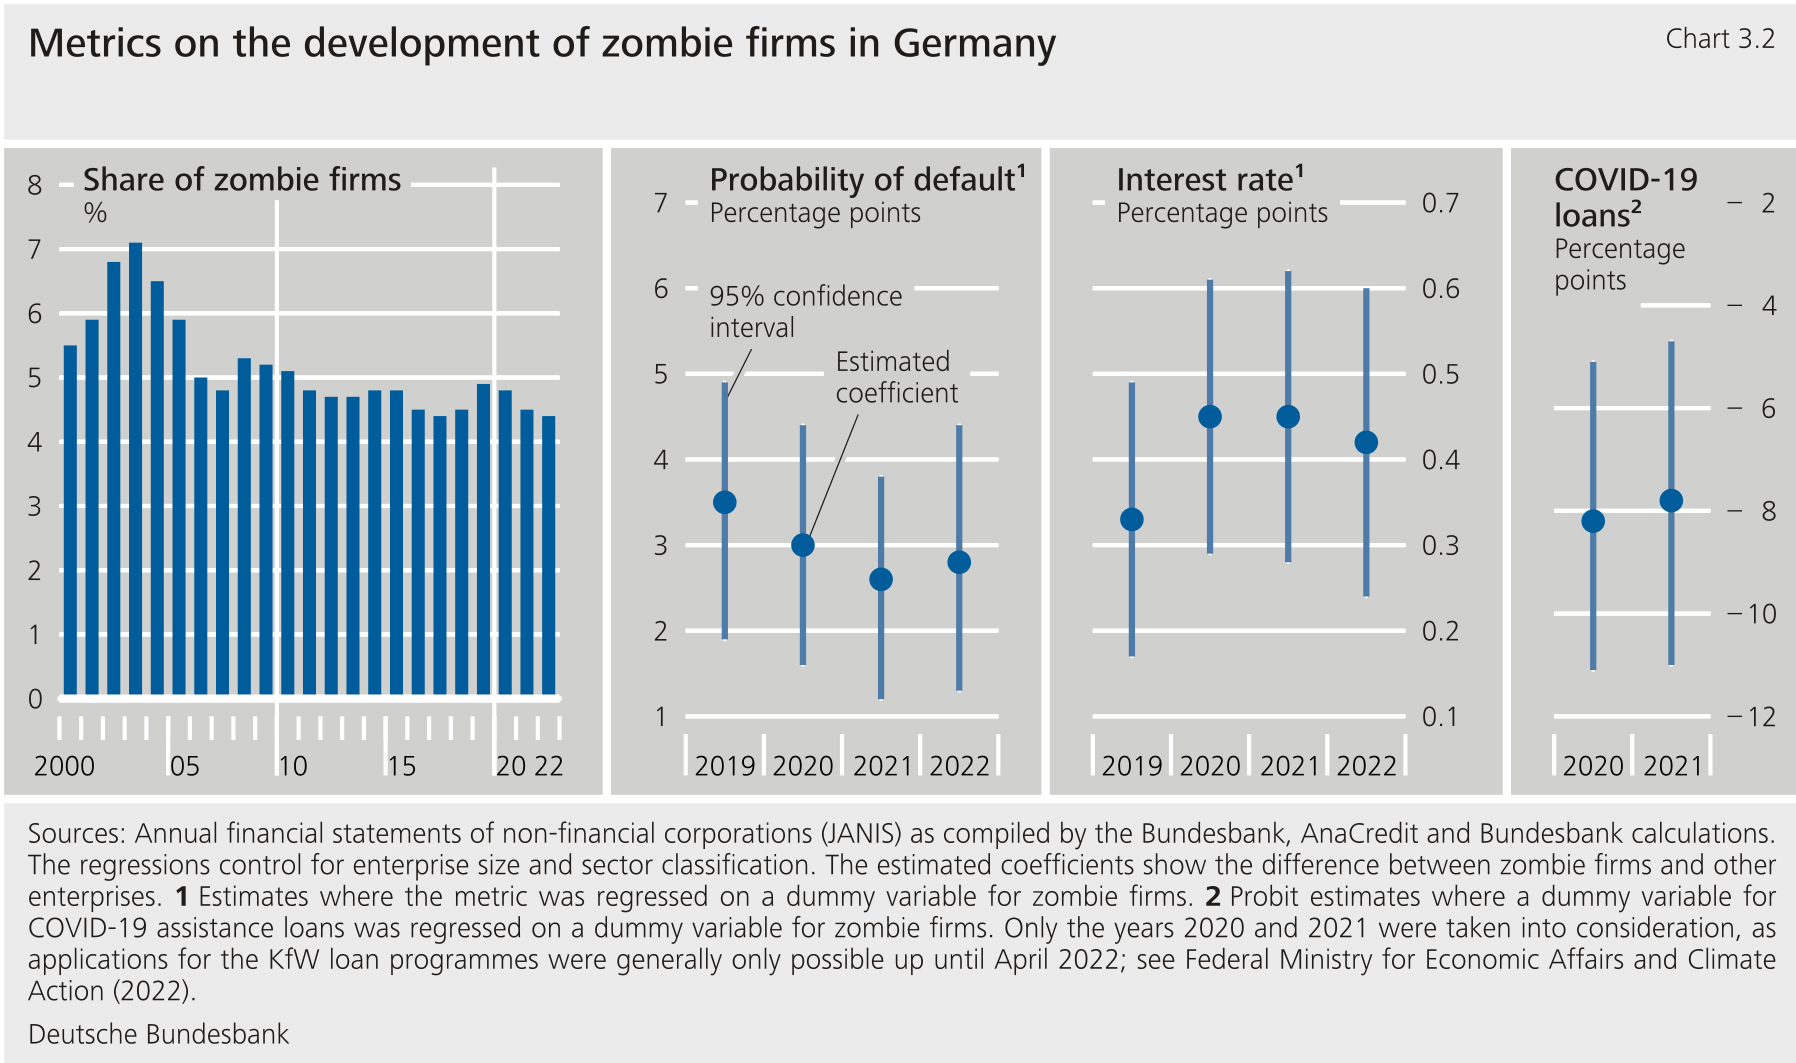**
****Developments in the share of persistently unprofitable firms in Germany can be estimated on the basis of the annual financial statements of non-financial corporations** ()**as compiled by the Bundesbank.** [\[4\]](#_ftn_555_4) In the dataset, these firms include -- in line with the literature -- any enterprises that have been unable to cover their interest expenses from their operating result for three consecutive years and are older than ten years.[\[5\]](#_ftn_555_5) In addition, the definition used here allows firms to use additional financial income (including from equity interests in other enterprises) to cover interest expenses.[\[6\]](#_ftn_555_6) This income is not insignificant for German enterprises.**{#par-o68u24}
****The results show that the percentage of zombie firms in Germany did not increase during the** -**19 pandemic.** In addition, their share of sales declined during this period.[\[7\]](#_ftn_555_7) In contrast to earlier periods of weakness, such as the recession in the early 2000s or the economic and financial crisis of 2008‑09, when the share of persistently unprofitable enterprises in Germany increased, it tended to decline during the pandemic. The fact that this share has dropped since 2020 -- despite the pandemic and energy crisis -- could be partly attributable to the conditions of the -19 assistance measures. Some of these were linked to firms' profitability in the preceding years.[\[8\]](#_ftn_555_8)**{#par-i2o15e}
****Further analyses show whether persistently unprofitable firms benefited from particularly favourable financing conditions during the pandemic.** This provides evidence of the extent to which these enterprises were kept alive by preferential treatment by banks (evergreening thesis). This also makes it possible to assess whether they benefited excessively from the -19 assistance loans. To this end, financial characteristics of enterprises from the AnaCredit datasets up to 2022 are linked to enterprises' annual financial statements data.[\[9\]](#_ftn_555_9) This allows us to analyse whether enterprises that were classified as zombie firms in 2019 were better off in terms of financial characteristics during the pandemic.[\[10\]](#_ftn_555_10)**{#par-au9997}
****Between 2019 and 2022, German credit institutions estimated the probability of loan default** ()**for persistently unprofitable firms to be higher than for other firms and demanded an appropriate interest rate premium.** In the pre-crisis year of 2019, banks determined that zombie corporate borrowers were on average around 3 percentage points more likely to default on loans than other firms. This largely also applies to the pandemic period.[\[11\]](#_ftn_555_11) In other words, credit institutions were already aware of the risk of potential payment difficulties for these firms before -- but also during -- the pandemic.[\[12\]](#_ftn_555_12) The associated higher interest rate premia reflect this.Even before the outbreak of the -19 crisis, these firms had to pay an interest rate premium of around 30 basis points compared with other firms. The estimates suggest that this premium rose somewhat during the -19 crisis -- although this increase is in the range of statistical uncertainty. Overall, these results contradict the evergreening thesis and preferential treatment of zombie firms -- including during the pandemic.**{#par-i56e1o}
****In addition, the probability of persistently unprofitable firms receiving a** -**19 assistance loan was lower than for other firms.** This is the result of additional estimates which match up with previous findings that these firms did not benefit any more than other enterprises from more favourable financing conditions during the pandemic.[\[13\]](#_ftn_555_13)**{#par-o551u6}
****The analysis does not provide a comprehensive assessment of support programmes during the pandemic.** First, it is based on only a small part of the support measures, namely the -19 assistance loans. By contrast, the expansion of short-time working benefits and other extensive assistance to enterprises, such as direct transfers, say in the form of direct company subsidies for fixed costs, were not included in this analysis. Second, the share of zombie firms is only one of several criteria that should be used to assess the support measures.[\[14\]](#_ftn_555_14)**{#par-ao17ei}
****Looking at the results as a whole, there was no significant rise in persistently unprofitable firms in Germany during the pandemic.** On the contrary, credit institutions appear to have been aware of the higher risk of lending to these corporate debtors -- measured by and the interest rate -- before and during the pandemic. These firms did not benefit excessively from the assistance loan programmes launched in the context of the pandemic either.[\[15\]](#_ftn_555_15) It is therefore unlikely that zombie firms play a prominent role in the German economy's weak productivity growth which has been observed for some time now.**{#par-uuo89u}
1. **{#_ftn_555_1} The term zombie was first used to describe enterprises in the stagnating Japanese economy of the 1990s; see Caballero et al. (2008).**
2. **{#_ftn_555_2} For an overview of the literature, see Acharya et al. (2022).**
3. **{#_ftn_555_3} See Deutsche Bundesbank (2017, 2020) and Bittner et al. (2021).**
4. **{#_ftn_555_4} See Becker et al. (2024).**
5. **{#_ftn_555_5} See Andrews and Petroulakis (2017) as well as McGowan et al. (2018).**
6. **{#_ftn_555_6}This definition differs from the usual definition; see Andrews and Petroulakis (2017). This approach is consistent with a recent study that suggests that the results could be distorted if additional income, such as financial revenues, is not taken into account. In particular, this increases the likelihood of enterprises being wrongly classified as zombie firms; see De Jonghe et al. (2024).**
7. **{#_ftn_555_7}According to international comparative studies, the share of zombie firms in Germany was very low between 1997 and 2021; see Albuquerque and Iyer (2023). Earlier analyses by the Bundesbank confirm that the share of zombie firms in Germany has tended to decline since the beginning of the 2010s; see Deutsche Bundesbank (2020).**
8. **{#_ftn_555_8}For example, express loans were subject to conditions relating to firms' profitability in the years prior to the pandemic. The emergency aid for small enterprises and the self-employed as well as the bridging aid were conditional on pandemic-related losses in turnover.**
9. **{#_ftn_555_9}The analytical credit datasets, or AnaCredit, contain monthly information on individual bank loan agreements with legal persons and a lending volume of more than €25,000.**
10. **{#_ftn_555_10}To this end, the AnaCredit financial characteristics are regressed to a dummy variable, which indicates whether an enterprise is a zombie firm as per the definition in 2019. The estimated coefficients show the difference between the categories of enterprises before (2019) and during the pandemic (2020 to 2022). The estimates are carried out separately for the years 2019, 2020, 2021 and 2022 and take into account sector classification and enterprise size.**
11. **{#_ftn_555_11}During the pandemic, zombie firms' decreased slightly compared with other firms. However, these changes cannot be clearly distinguished from one another statistically.**
12. **{#_ftn_555_12}In line with this, further results show that zombie firms experienced credit defaults, non-performing loans and payment arrears more frequently in relative terms between 2019 and 2022.**
13. **{#_ftn_555_13}-19 loans were, on average, larger in volume and had more favourable interest rates than normal loans.**
14. **{#_ftn_555_14}Moreover, the Bundesbank's annual financial statements statistics are not a representative sample. Larger enterprises are overrepresented in the data, and sectoral coverage is uneven.**
15. **{#_ftn_555_15}These results are largely in line with studies in France (see Cœuré (2021)), Italy (see Pelosi et al. (2021)), the United States (see Favara et al. (2021)) and the European Union (see Bighelli et al. (2022)).**
****In the first half of 2024, corporate insolvencies continued to rise sharply compared with the same period a year earlier.** Extrapolated to the year, corporate insolvencies are expected to exceed pre-pandemic levels again in 2024 for the first time. Higher financing costs as well as catch-up and normalisation effects in the wake of the pandemic are having an impact this year, too. The fact that the German economy has not yet regained momentum is probably playing a certain role in the continued sharp rise in insolvencies.**{#par-u94uii}
**3 The impact of monetary policy tightening on business investment and financing** {#tar-4}
--------------------------------------------------------------------------------------------
****The interest rate reversal in the euro area increased financing costs for German enterprises in 2023.**This trend increased the cost of external financing for enterprises and raised debt servicing costs for new liabilities. In principle, this limits the scope for investment. The impact this has ultimately depends on the debt structure and the ability of enterprises to service interest costs or switch to other sources of financing. In addition to the impact on cash flow, an interest rate hike tends to dampen corporate investment by reducing the profitability of investment projects and making alternative investments more attractive, while falling asset prices also lower the collateral base for loans.**{#par-ia9869}
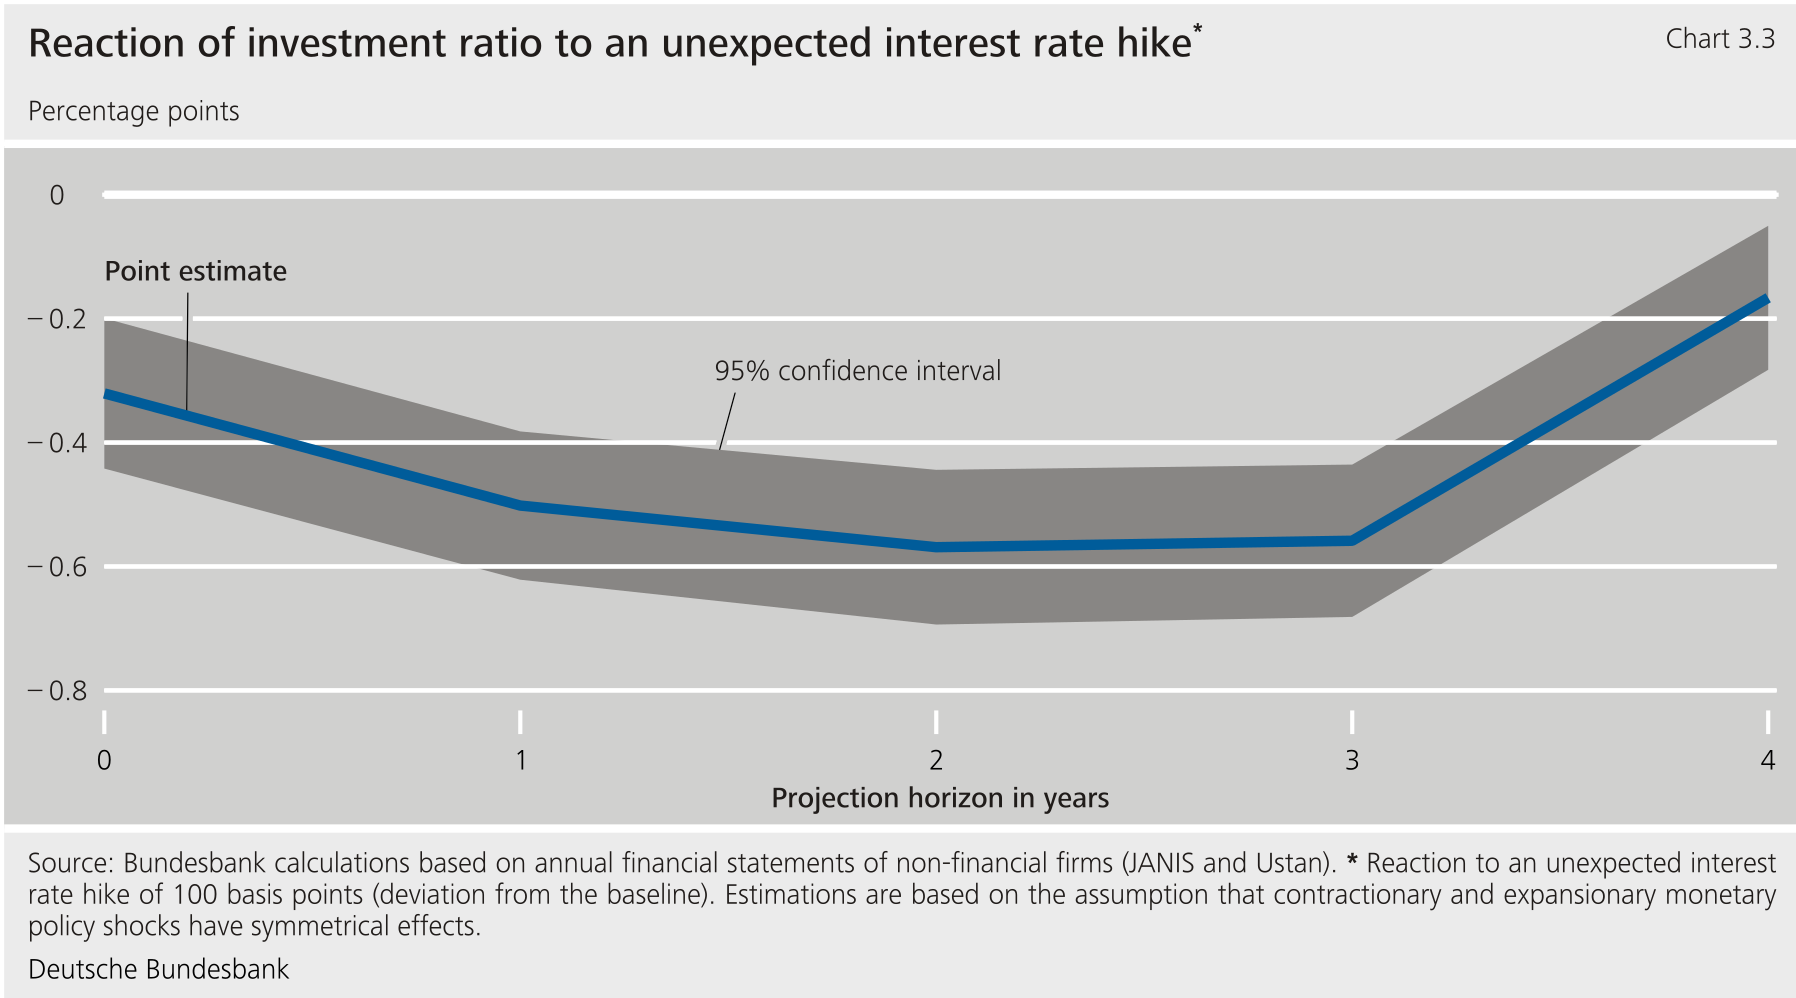
****Estimates using Bundesbank firm-level data can provide insights into how the interest rate increases affected investment by German firms in the 2023 reporting year.** The study is based on extensive firm-level data by the Bundesbank since the 1970s, making it possible to analyse the effects of interest rate cycles over several decades.[\[6\]](#_ftn_root_6) The local projections method is used to estimate the impact of monetary policy shocks on the investment ratio.[\[7\]](#_ftn_root_7) The results show that, in the past, contractionary monetary policy shocks significantly dampened investment by non-financial corporations in Germany. For example, in the past an unexpected interest rate increase of 100 basis points reduced the investment ratio of German enterprises by 0.6 percentage point within two years. The effect could generally be seen in the year of the interest rate change and then intensified in subsequent years, before gradually subsiding after four years.**{#par-oi73i6}
****According to a rough calculation based on the estimated results, the latest interest rate hikes totalling 400 basis points between July 2022 and the end of 2023 may have reduced the investment ratio in the corporate sector by up to 2.4 percentage points.** [\[8\]](#_ftn_root_8) This assumes that these interest rate hikes were completely unexpected -- which is unlikely to have been the case. Nevertheless, the estimates show that monetary policy tightening is likely to have a significant adverse effect on investment by the German corporate sector.**{#par-eo3u2e}
{#par-o43782}
****
****The results show that interest rate increases had a greater impact on the investment ratio than interest rate cuts.** Looking at interest rate hikes separately from interest rate cuts in the estimates, an unexpected interest rate increase of, say, 100 basis points reduced German firms' investment ratio by around 1.3 percentage points on average after one year,[\[9\]](#_ftn_root_9) while an interest rate cut of the same size only increased the investment ratio by 0.7 percentage point in the short term.[\[10\]](#_ftn_root_10) This asymmetrical effect is presumably due to the fact that in some cases, higher interest rates can have the same effect as tighter credit restrictions for enterprises with weaker finances. One indicator of an enterprise's financial situation could be its equity base. This is because, according to the estimates, companies with a low equity ratio react more strongly to monetary policy shocks, while financially sounder companies are more resilient.[\[11\]](#_ftn_root_11) Additional analyses suggest that the asymmetrical effect has diminished over time, possibly because of the significant improvement in the capital base in the corporate sector over the last two decades. This may have reduced sensitivity to interest rate increases.**{#par-e4i943}
****The interest rate reversal left only moderate traces in the annual financial statements available up to the end of 2023.**Changes in interest rates are most likely to be reflected in companies' interest expenses and income, as well as in their liabilities. Accordingly, interest expenses did increase. The imputed interest rate, which is a measure of enterprises' actual financing costs, was only 3.6 %, placing it above the previous year's rate, but still below the level before 2016, with the exception of a one-off increase to 4.1 % in 2018. One reason for the comparatively moderate increase could be the slight rise in the discount rate for pension provisions, which reduced interest expenses somewhat. In previous years, the continuous decline of this rate, which is calculated as an average over the past ten years, had driven up expenses. In addition, many companies appear to have taken measures to limit their interest costs. For example, companies have scaled back long-term interest-bearing bank debt and are increasingly using customer advance payments as a source of financing. Companies also favoured financing with their own funds over using external funds.**{#par-o256e6}
****In nominal terms, the investment ratio and the gross and net additions to tangible fixed assets continued to rise.**This is also true for investments in subcategories such as land and buildings, technical equipment and machinery, and furniture and equipment. However, price effects in particular are likely to play a role here. According to the national accounts, gross fixed capital formation in the economy as a whole and investment in machinery and equipment fell after adjustment for inflation. Moreover, the effects of the interest rate reversal are not expected to be fully felt until two years after the interest rate hike, i.e. in the financial years 2024 and 2025, based on the estimates. It should be noted that interest rates on bank loans to non-financial corporations have fallen slightly again in 2024, which in itself is likely to mitigate the financial burden on companies somewhat.**{#par-o32i74}
**4 Sales and income** {#tar-5}
-------------------------------
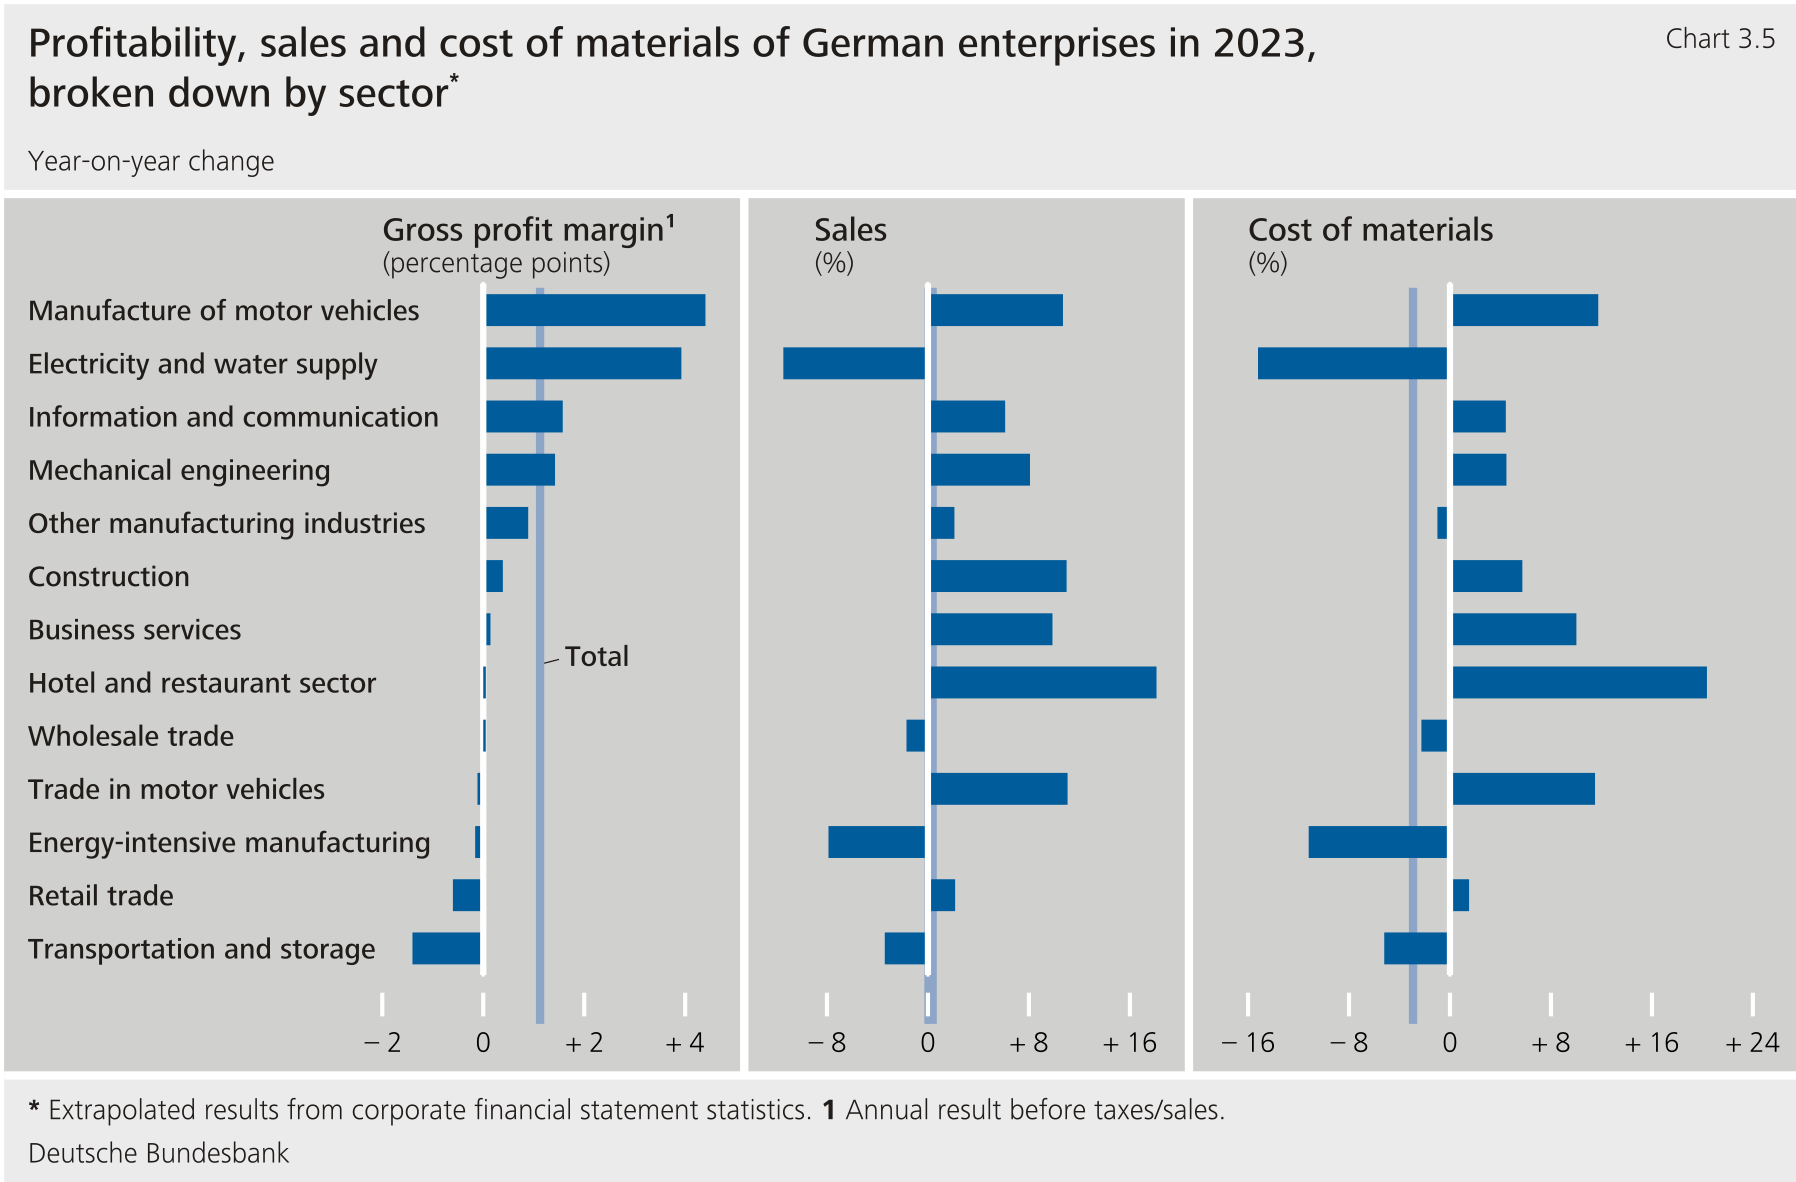
****Unsurprisingly, given the challenging economic environment, the performance of non-financial corporations was weak in 2023.** Sales in the non-financial corporate sector increased only slightly. The sales trend varied greatly by sector. For example, sales grew strongly in the hotel and restaurant sector (probably due in part to certain pandemic-related catch-up effects), among business service providers, in the motor vehicle trade, construction, manufacture of transport equipment and mechanical engineering. By contrast, energy-intensive industrial sectors such as the wood, paper and printing industry, the chemical and pharmaceutical industry and energy supply saw sales decline.[\[12\]](#_ftn_root_12) The decrease in sales in the energy-intensive manufacturing sector is probably also related to the fact that energy prices, although falling, were still high. For example, this could have led to parts of production being moved abroad or to a decline in shares of exports due to reduced competitiveness. Lower energy prices led to an immediate decline in sales in the energy supply business. The rise in sales in some parts of the services sector is thought to be mainly due to price effects given the environment of persistently high inflation. By contrast, interest income continued to grow strongly across all sectors as a result of the interest rate reversal. Income from other long-term equity investments rose significantly off the back of developments in the transport equipment and chemical and pharmaceutical industries.**{#par-u8e8i1}
****Despite the generally weak performance, corporate profits rose sharply** . This was mainly due to the fact that expenses were lower on average. This was because the cost of materials declined, partly as a result of falling prices for intermediate goods, especially energy. However, the drop in the cost of materials was limited to energy supply, energy-intensive manufacturing, and the transportation and storage sector. In the remaining economic sectors, costs merely increased less than in the previous year. In sectors with high sales growth, the cost of materials increased correspondingly. There were further sharp increases (in most sectors) in personnel expenses due to significant wage increases and in interest expenses due to the interest rate reversal. One exception to this is the chemical and pharmaceutical industry, where both cost items fell.[\[13\]](#_ftn_root_13)**{#par-e864u5}
{#par-iia8a6}
****
****From a sectoral perspective, too, profitability remained robust in 2023.** Despite falling sales, the profitability of energy-intensive manufacturing industries declined only slightly because of reduced costs. Although gross profit margins fell in the wood, paper and printing industries, for example, they were still above the historical average. In the other energy-intensive industrial sectors, profitability remained close to the long-term average. Across all sectors, the highest increases in gross profit margin were recorded by the manufacture of transport equipment, energy supply and electrical engineering. The sectors in which the increase in profitability was primarily due to growth in income rather than reduced pressure on expenses included -- in addition to transport equipment and the rest of the manufacturing sector -- the information and communication sector, the mechanical engineering sector and the construction sector[\[14\]](#_ftn_root_14).**{#par-a327ie}
{#par-o67372}
****
{#par-uuii4i}{#par-u685o9}{#par-e6a156}{#par-ai8ia9}{#par-i38317}{#par-a372ou}{#par-oau7i2}{#par-oe8ie4}{#par-i8u6o4}{#par-u21euo}{#par-oao4u4}{#par-i22a5i}{#par-ea291o}{#par-ui2e8a}{#par-iaa952}{#par-iii59e}{#par-ei7664}{#par-eu19o9}{#par-u948ia}{#par-o727ua}{#par-ie6854}{#par-u35a24}{#par-eei86u}{#par-oiaooe}{#par-a23386}{#par-uu925u}{#par-e7794e}{#par-a8e74a}
| **Table 3.1: Enterprises' income statement\*** ||||||
| Item | 2021 | 2022 | 2023s | 2022 | 2023s |
| Item | € billion ||| Year-on-year change ||
| Item | € billion ||| % ||
| **Income** | |||||
| Sales | 7,246.7 | 8,818.6 | 8,836.8 | 21.7 | 0.2 |
| Change in finished goods^1^ | 85.7 | 111.1 | 77.8 | 29.6 | − 30.0 |
| Gross revenue | 7,332.4 | 8,929.7 | 8,914.7 | 21.8 | − 0.2 |
| Interest and similar income | 17.7 | 22.2 | 55.0 | 25.0 | 148.2 |
| Other income^2^ | 319.7 | 336.5 | 360.7 | 5.3 | 7.2 |
| of which: | |||||
| from other long-term equity investments | 61.7 | 68.8 | 91.9 | 11.5 | 33.7 |
| Total income | 7,669.8 | 9,288.4 | 9,330.3 | 21.1 | 0.5 |
| **Expenses** | |||||
| Cost of materials | 4,823.8 | 6,163.6 | 5,983.1 | 27.8 | − 2.9 |
| Personnel expenses | 1,229.0 | 1,325.6 | 1,398.1 | 7.9 | 5.5 |
| Depreciation | 210.8 | 228.0 | 225.3 | 8.1 | − 1.2 |
| of tangible fixed assets3 | 192.8 | 200.1 | 206.7 | 3.8 | 3.3 |
| Other^4^ | 18.0 | 27.9 | 18.6 | 54.9 | − 33.3 |
| Interest and similar expenses | 63.2 | 77.6 | 86.3 | 22.9 | 11.2 |
| Operating taxes | 4.9 | 4.9 | 5.3 | 0.1 | 7.5 |
| Other expenses^5^ | 969.6 | 1,118.8 | 1,162.2 | 15.4 | 3.9 |
| Total expenses before taxes on income | 7,301.3 | 8,918.6 | 8,860.3 | 22.2 | − 0.7 |
| Annual result before taxes on income | 368.5 | 369.8 | 470.0 | 0.4 | 27.1 |
| Taxes on income^6^ | 75.0 | 83.9 | 81.7 | 11.9 | − 2.6 |
| Annual result | 293.5 | 285.9 | 388.3 | − 2.6 | 35.8 |
| Memo items: | |||||
| Cash flow^7^ | 616.6 | 639.9 | 633.2 | 3.8 | − 1.0 |
| Net interest paid | 45.4 | 55.5 | 31.3 | 22.1 | − 43.5 |
| | as a percentage of sales ||| in percentage points ||
| Gross income^8^ | 34.6 | 31.4 | 33.2 | − 3.2 | 1.8 |
| Annual result | 4.0 | 3.2 | 4.4 | − 0.8 | 1.2 |
| Annual result before taxes on income | 5.1 | 4.2 | 5.3 | − 0.9 | 1.1 |
| Net interest paid | 0.6 | 0.6 | 0.4 | 0.0 | − 0.3 |
|-----------------------------------------|--------:|--------:|--------:|-------|--------|
{#par-iio861}
**5 Balance sheet developments** {#tar-6}
-----------------------------------------
****The growth in corporate assets weakened in 2023 in view of the more subdued economic situation.** Growth in non-financial corporations' total assets was much lower on average than in the two previous years. Enterprises used the additional funds largely for the formation of non-financial assets, while the acquisition of financial assets was weak. The share of financial assets thus decreased, as in the previous year, due mainly to the decline in total receivables. While long-term receivables continued to rise, short-term receivables, which account for a much larger share of the balance sheet, decreased. By contrast, other long-term equity investments rose sharply, as in the two previous years. In 2023, efforts to conserve liquidity were no longer a major factor for most enterprises, as liquid funds in the form of cash and bank deposits were reduced. The liquidity needs of most sectors changed only slightly. The strong increase in non-financial assets in large parts of the corporate sector was due in roughly equal measure to tangible fixed assets and inventories. The increase in tangible fixed assets was higher than in the previous year, while intangible fixed assets barely increased. However, it is not immediately obvious from corporate financial statements that many enterprises are looking into the use of artificial intelligence. This is easier to identify using more granular datasets (see the supplementary information on "The adoption and objectives of artificial intelligence in German firms"). However, the increase in inventories was not as high as in the previous year, partly due to muted price developments and stagnating sales. Moreover, supply chain disruptions were resolved in 2023, which reduced the need for increased inventory.**{#par-i6e536}
****The adoption and objectives of artificial intelligence in German firms**** {#tar-7}
---------------------------------------------------------------------------------------
****The digital transformation has the potential to radically alter business and working life.** The use of artificial intelligence () especially could invigorate aggregate productivity growth in Germany, which has long been sluggish.[\[1\]](#_ftn_666_1) Generative is seen as the major technological advance in this regard. Because it can handle complex tasks that were previously considered exclusively executable by humans, it holds the promise of substantial productivity gains. In contrast to earlier technological innovations that automated routine tasks, generative is able to create content such as text or images by itself, which could potentially make human work significantly more efficient.[\[2\]](#_ftn_666_2)**{#par-e4ea9e}
****A representative online survey of just under 7,000 German firms conducted by the Bundesbank provides detailed insights into the use of digital technologies in 2024 as well as the reasons motivating their adoption.** [\[3\]](#_ftn_666_3)The analysis focuses on four key technologies: predictive and generative , cloud computing, infrastructure technologies for integrating work and/or production processes, and robotics. Until now, there has been very little reliable information on the adoption and use of digital technologies in the German corporate sector.[\[4\]](#_ftn_666_4)**{#par-a3ia3u}
****In the current early phase of** **adoption, two-fifths of firms are already engaging with the technology.** Notably, in the second quarter of 2024, 43 % of the surveyed enterprises were using predictive or generative at least experimentally or were planning to introduce it before the end of 2024.[\[5\]](#_ftn_666_5) Only 3 % were making extensive use of it, which is probably because the technology is so new. Most firms using were therefore doing so experimentally (19 %). A slightly smaller number of firms had already taken things a step further and were using it to a limited extent (14 %). A further 8 % do plan to implement it by the end of 2024. The majority of firms are not yet using and are not intending to introduce it before the end of 2024. Cloud computing (66 %) and infrastructure technologies (49 %), on the other hand, are more widespread. Robotics (14 %) are deployed chiefly in industrial sectors.**{#par-i6ae38}
{#par-u782a7}
**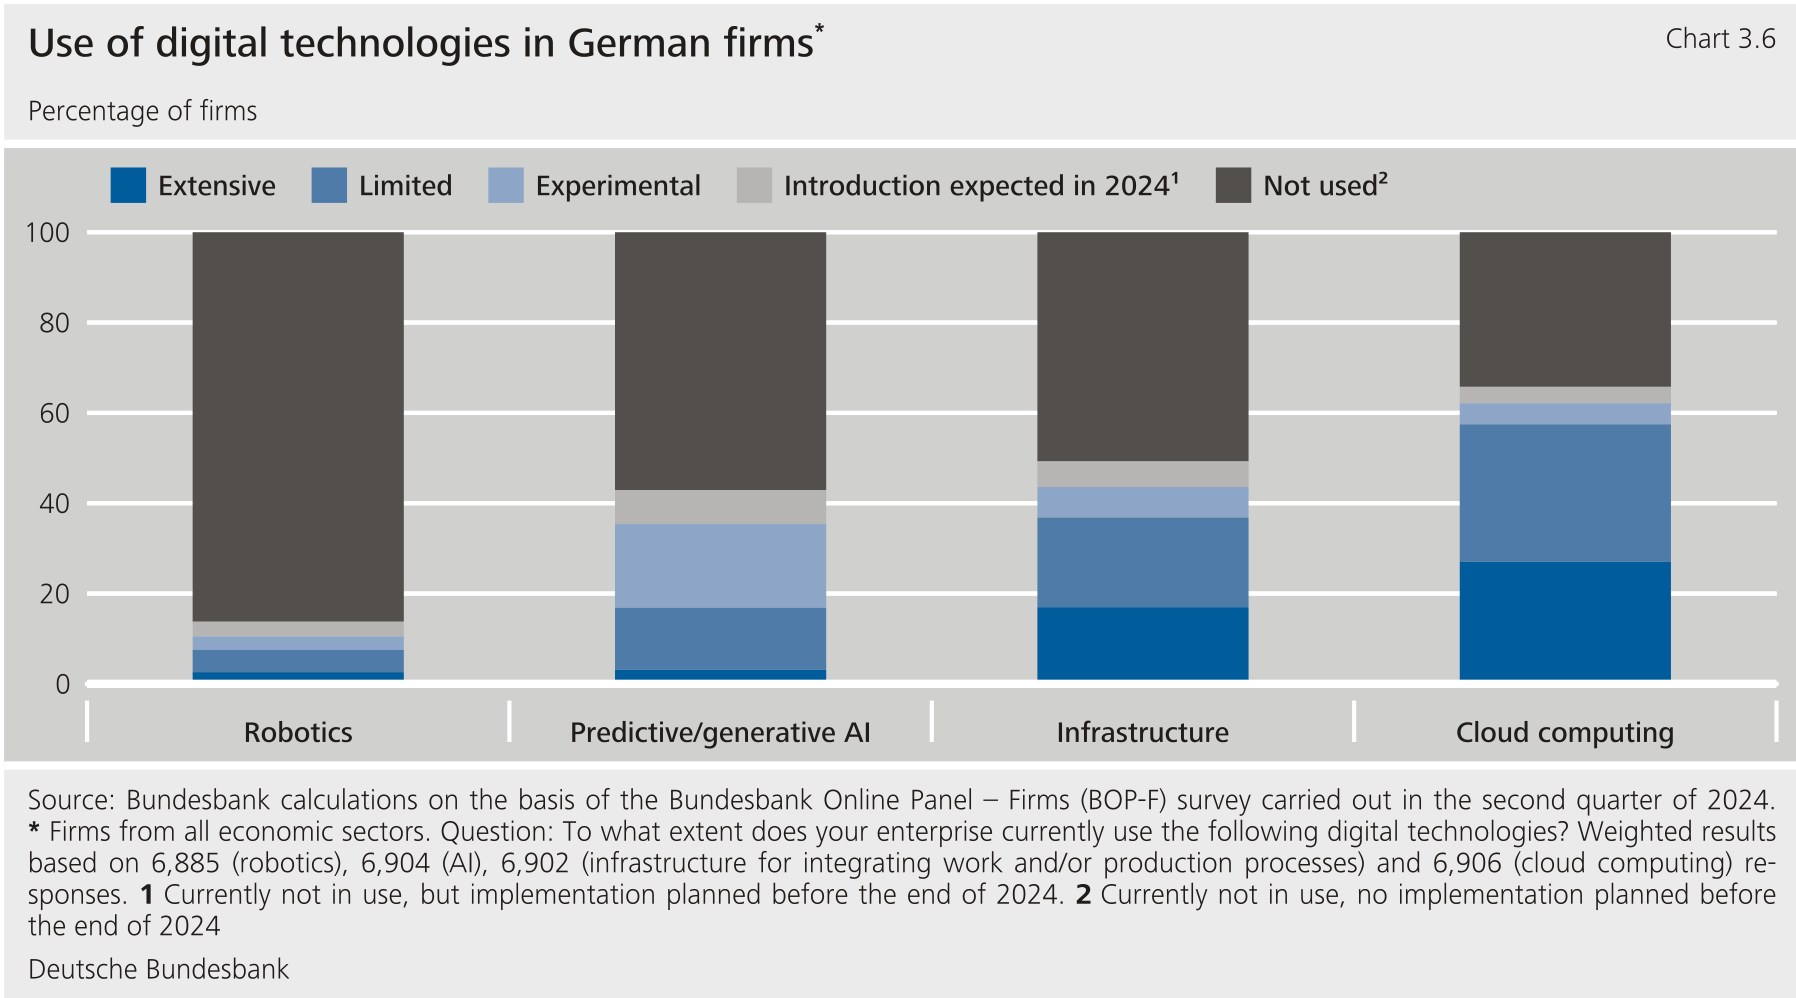**
****The use of predictive and generative** **varies widely depending on sector and firm size.** It is particularly prevalent in sectors characterised by data-driven processes and digital interaction, such as information, communication and finance. By contrast, it figures less frequently in economic sectors where tasks are of a more manual or interactive nature, such as healthcare, hospitality and transport. Large firms are driving the adoption of AI: 78 % of enterprises with turnovers of more than €229 million use or are planning to introduce it, compared with just 37 % of firms with turnovers under €1 million. According to an study, high costs, a lack of technical expertise and lower perceived benefit are key barriers for smaller firms.[\[6\]](#_ftn_666_6) The same pattern is also evident with other digital technologies, such as cloud computing and robotics.**{#par-ea7u6o}
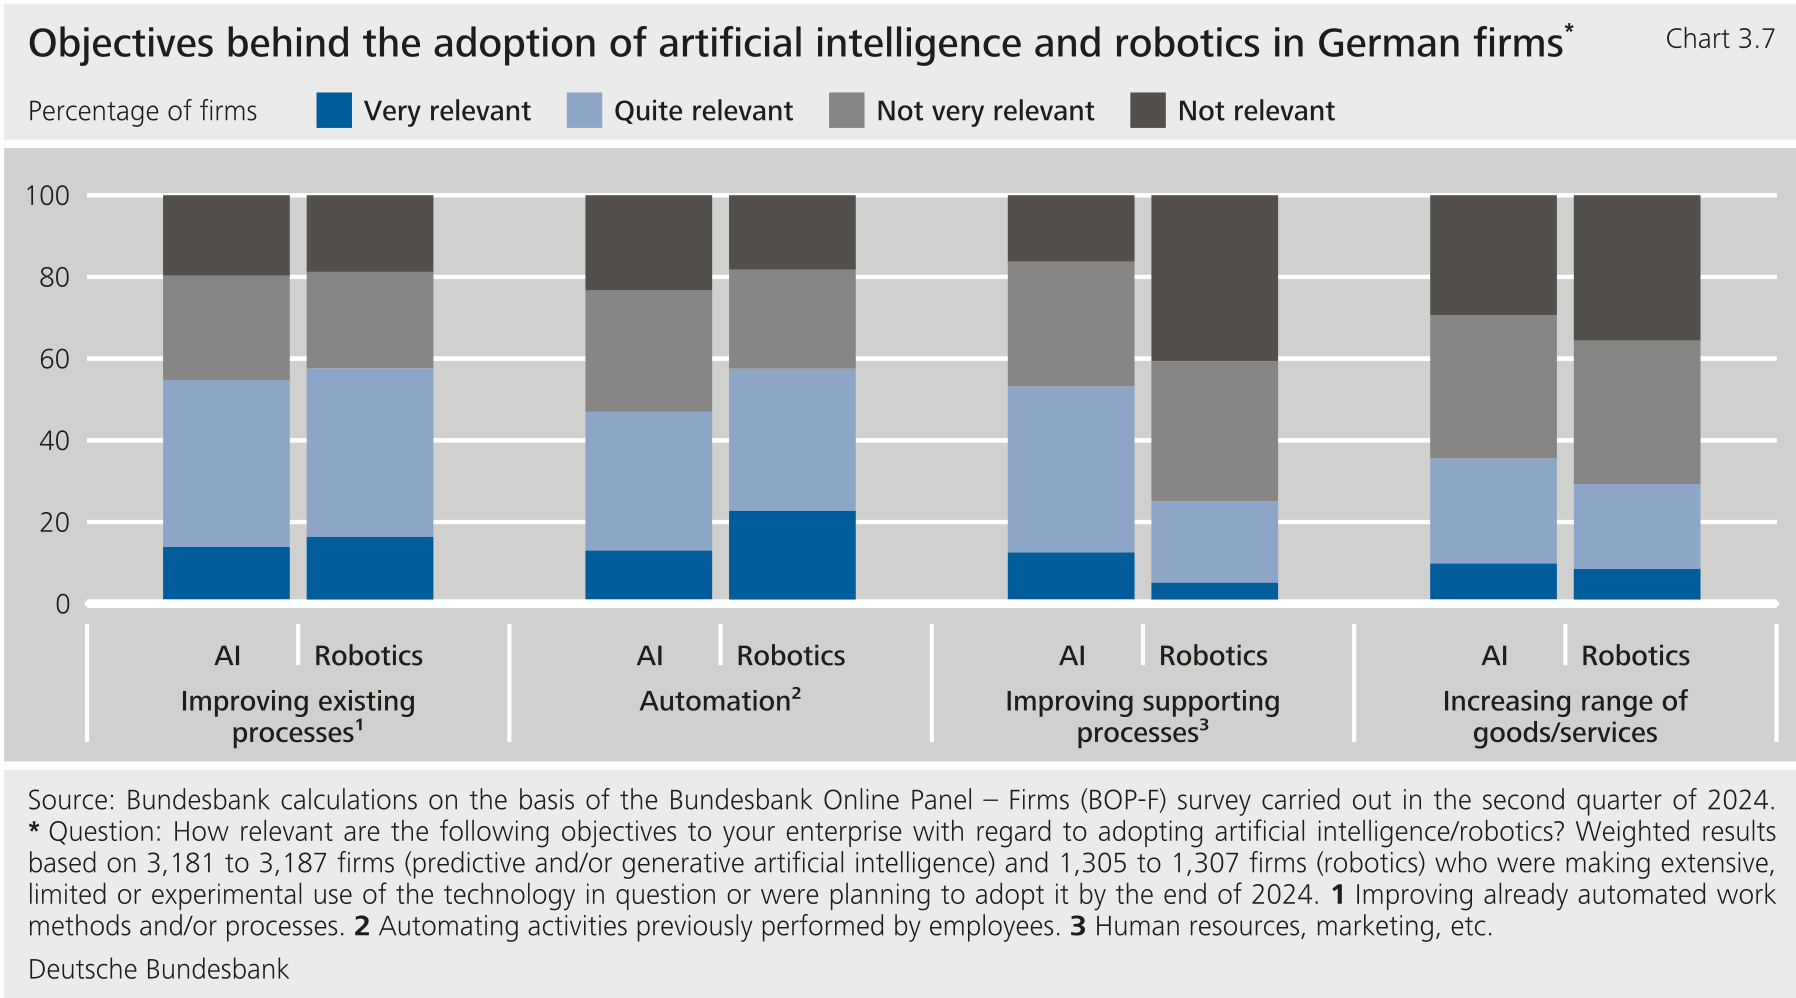
****According to the findings, firms primarily use robotics to automate tasks, whilst** **is mainly being used to improve supporting processes.** A key objective for both technologies is the optimisation of methods or processes that are already automated (AI: 55 %; robotics: 58 %). The automation of existing activities is particularly important for robotics (58 %), but does also play a significant role for (47 %). is also important for improving supporting processes such as in the areas of human resources or marketing (53 %), whereas robotics are naturally less applicable in these areas (25 %). Expanding the range of goods and services on offer is a lower-priority objective in the case of both technologies (AI: 36 %; robotics: 29 %).**{#par-a19611}
{#par-o5i5i7}
****
****The effects of generative** **on the labour market and productivity are likely to be very different from those of robotics.** While the survey results do not provide direct insights into the productivity or labour market impacts of or robotics, they do suggest -- in line with the literature -- that robotics are predominantly being used to automate manual activities. In contrast, generative comprehensively transforms work processes and could significantly boost productivity, especially in supporting functions. Widespread use of generative could thus provide positive impetus for aggregate potential growth. Estimates of AI's effect on productivity are, however, fraught with uncertainty. Empirical studies show a wide range of outcomes, ranging from modest effects to substantial aggregate productivity gains.[\[7\]](#_ftn_666_7) What is sure, is that improved digital infrastructure and targeted training measures are essential to fully realising the growth potential of this technology.**{#par-ue7o3e}
1. **{#_ftn_666_1} For details on the general significance of digitalisation for productivity growth, see Deutsche Bundesbank (2023).**
2. **{#_ftn_666_2} See also Elondou et al. (2023).**
3. **{#_ftn_666_3} For more information on the Bundesbank Online Panel -- Firms (BOP-F) survey, see Bundesbank (2021c) and Boddin and Köhler (2023).**
4. **{#_ftn_666_4} Exceptions include results of surveys conducted by the Federal Statistical Office and the Institute. See Destatis (2024) and Schaller et al. (2023).**
5. **{#_ftn_666_5} Surveys by the Institute have found that the proportion of firms using grew by 14 percentage points to 27 % between 2023 and 2024. See Kerkhof et al. (2024). In a similar vein, generative appears to be being adopted exceptionally rapidly in the United States, with uptake progressing at a much faster pace than previous rollouts of new technologies such as the or internet. See Bick et al. (2024).**
6. **{#_ftn_666_6} See Lane et al. (2023).**
7. **{#_ftn_666_7} For studies on productivity gains in specific activities, see Noy and Zhang (2023), Peng et al. (2023) and Dell'Acqua et al. (2023). On the basis of a back-of-the-envelope calculation, Acemoglu (2024) estimates that the impact on annual labour productivity growth in the United States will be fairly modest, amounting to about 0.1 % over the next ten years. A similar analysis by Bergeaud (2024) under different assumptions shows slightly larger effects for the euro area. In contrast to this, other studies point towards very sizeable effects; see Briggs and Kodani (2023) and Aghion and Bunel (2024).**
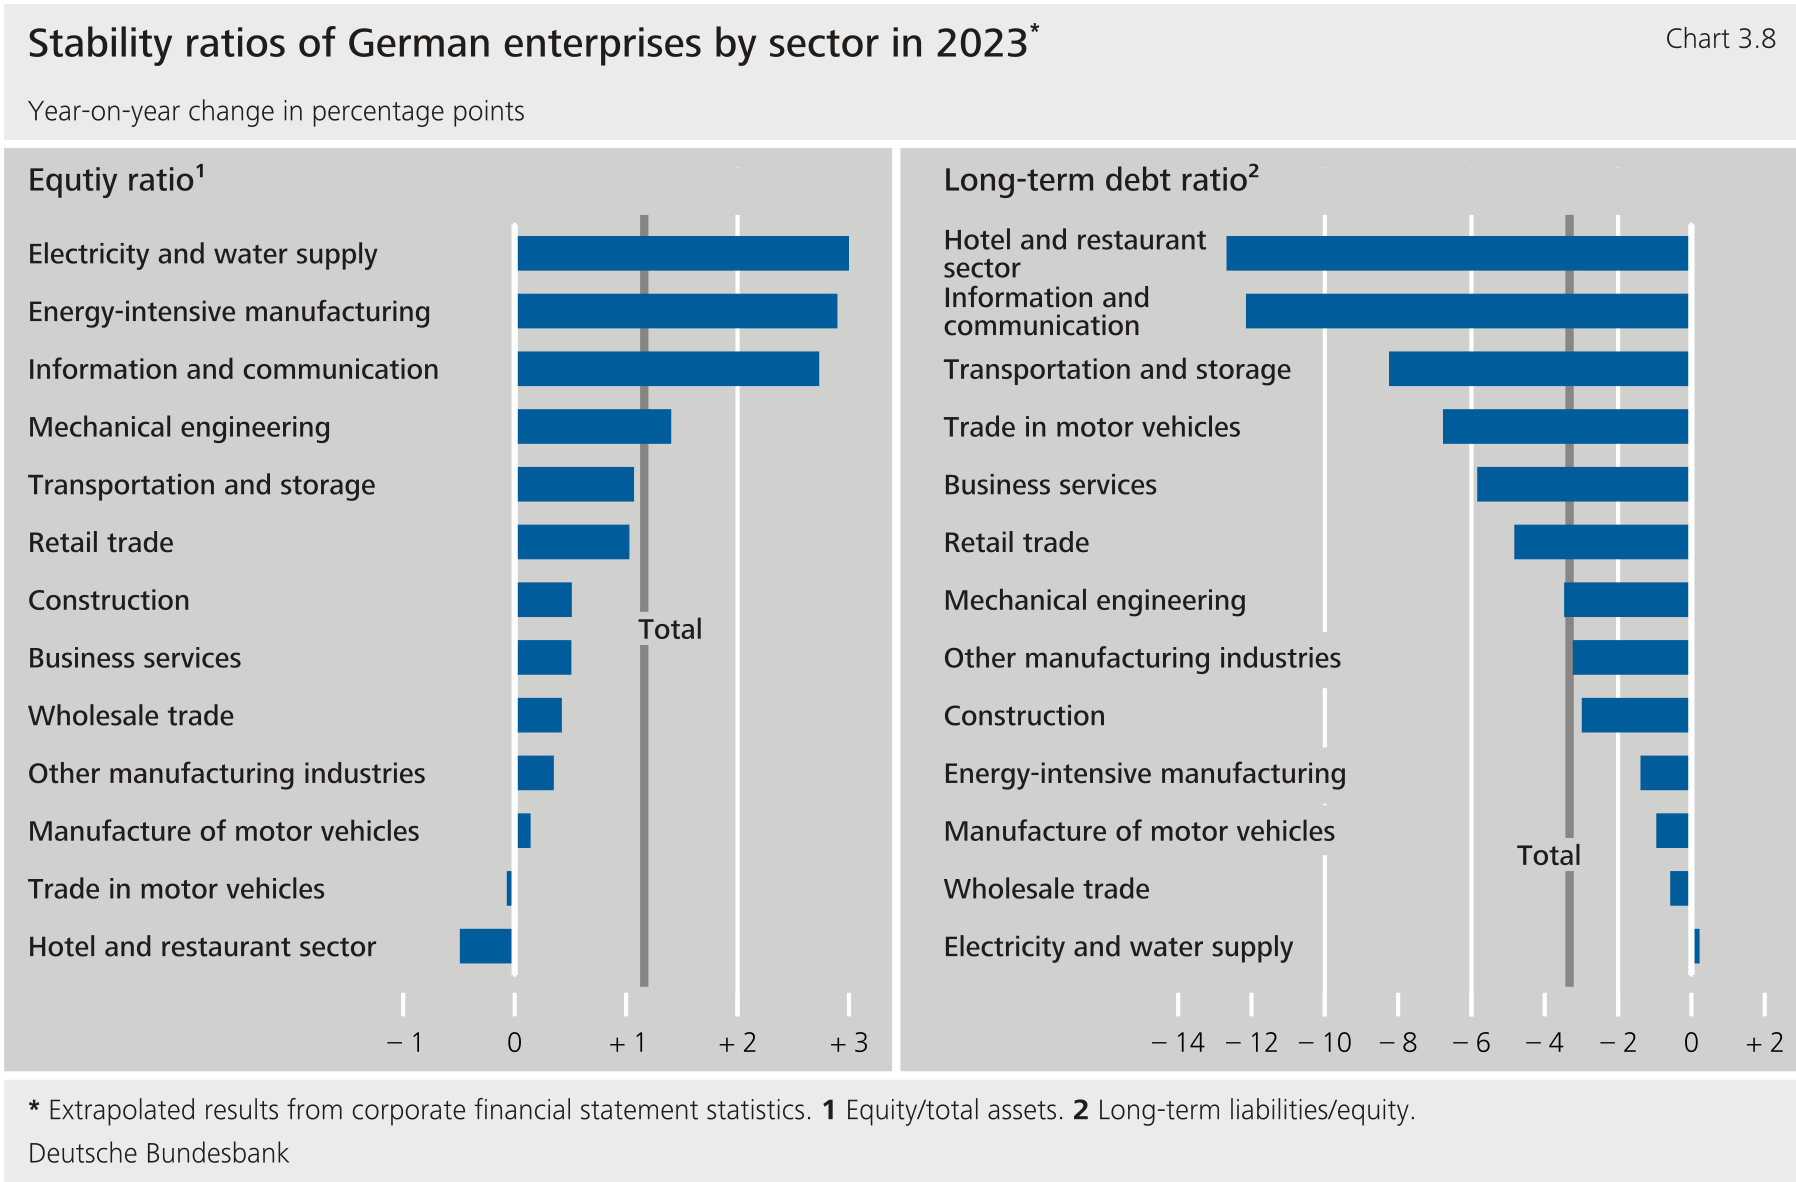
****The capital base of enterprises improved on average in 2023.**On the revenue side, most of the additional corporate funds were sourced internally, with a significant share coming from retained earnings. In contrast to equity, liabilities and provisions increased only slightly. The noticeable increase in the equity ratio thus roughly offset the decline from the previous year. The equity ratio rose in almost all sectors.**{#par-o63211}
{#par-a15ia4}
****
****Liabilities shifted proportionately from long-term to short-term on balance, as in the two previous years.** Short-term liabilities rose only slightly on average in 2023. Although advance payments received on account of orders and short-term liabilities to banks increased sharply, the reduction in trade payables and other liabilities had an offsetting effect. At the same time, enterprises reduced their long-term liabilities by decreasing their long-term liabilities to banks.[\[15\]](#_ftn_root_15) In contrast to the three previous years, provisions also increased only slightly. The rising discount rate resulting from the interest rate reversal may also have provided relief with respect to pension provisions.**{#par-i21583}
{#par-i21583}
{#par-o8a57e}{#par-i4a328}{#par-i22a61}{#par-e3e27o}{#par-i48486}{#par-oaouii}{#par-a7e4i2}{#par-i3e74i}{#par-o5o713}{#par-a47329}{#par-oai86e}{#par-au2795}{#par-a3i4ao}{#par-o88717}{#par-oe5u93}{#par-u7ao15}{#par-i9a88e}{#par-o3i128}{#par-u73o1a}{#par-i66238}{#par-i9eee6}{#par-e61ai5}{#par-ao82a3}{#par-oo7au1}{#par-e15o86}{#par-ua87o2}{#par-u4a9o4}{#par-o78976}
| **Table 3.2: Enterprises' sources and uses of funds\*** € billion ||||||
| Item | 2021 | 2022 | 2023s | Year-on-year change ||
| Item | 2021 | 2022 | 2023s | 2022 | 2023s |
| **Sources of funds** | |||||
| Capital increase from profits and contributions to the capital | |||||
| of non-corporations^1^ | 93.4 | 75.3 | 84.0 | - 18.1 | 8.7 |
| Depreciation (total) | 210.8 | 228.0 | 225.3 | 17.1 | - 2.7 |
| Increase in provisions^2^ | 112.3 | 126.0 | 19.7 | 13.7 | - 106.3 |
| Internal funds | 416.6 | 429.3 | 329.0 | 12.8 | - 100.3 |
| Increase in capital of corporations^3^ | 70.5 | 26.0 | 48.5 | - 44.5 | 22.5 |
| Change in liabilities | 263.1 | 404.4 | 34.9 | 141.2 | - 369.5 |
| Short-term | 260.5 | 393.2 | 40.8 | 132.7 | - 352.4 |
| Long-term | 2.6 | 11.2 | - 5.9 | 8.5 | - 17.1 |
| External funds | 333.6 | 430.3 | 83.4 | 96.8 | - 346.9 |
| Total | 750.1 | 859.7 | 412.4 | 109.5 | - 447.2 |
| **Use of funds** | |||||
| Increase in tangible fixed assets (gross) | 258.9 | 267.1 | 285.0 | 8.2 | 17.9 |
| Increase in tangible fixed assets (net)*^4^* | 66.1 | 67.0 | 78.3 | 1.0 | 11.2 |
| Depreciation of tangible fixed assets | 192.8 | 200.1 | 206.7 | 7.2 | 6.6 |
| Change in inventories | 129.9 | 213.1 | 57.2 | 83.2 | - 155.9 |
| Non-financial asset formation (gross investments) | 388.8 | 480.2 | 342.1 | 91.4 | - 138.1 |
| Change in cash | 54.1 | 24.2 | - 2.3 | - 29.9 | - 26.5 |
| Change in receivables^5^ | 223.8 | 264.6 | - 13.1 | 40.8 | - 277.7 |
| Short-term | 227.8 | 245.5 | - 32.9 | 17.6 | - 278.3 |
| Long-term | - 4.0 | 19.2 | 19.8 | 23.2 | 0.6 |
| Acquisition of securities | 8.9 | 10.1 | 3.5 | 1.2 | - 6.6 |
| Acquisition of other long-term equity investments6 | 74.6 | 80.6 | 82.2 | 6.0 | 1.6 |
| Financial asset formation | 361.3 | 379.5 | 70.3 | 18.2 | - 309.2 |
| Total | 750.1 | 859.7 | 412.4 | 109.5 | - 447.2 |
| Memo item: | |||||
| Internal funds as a percentage of gross investments | 107.1 | 89.4 | 96.2 | . | . |
|----------------------------------------------------------------|------:|------:|-------:|-------:|--------:|
{#par-u52aoi}
{#par-o2iu8e}
| **Table 3.3: Enterprises' balance sheet\*** ||||||
| Item | 2021 | 2022 | 2023^s^ | 2022 | 2023^s^ |
| Item | € billion ||| Year-on-year change ||
| Item | € billion ||| % ||
| **Assets** | |||||
| Intangible fixed assets^1^ | 81.5 | 83.3 | 83.6 | 2.2 | 0.4 |
| Tangible fixed assets | 1,311.7 | 1,377.0 | 1,454.9 | 5.0 | 5.7 |
| Inventories | 930.2 | 1,143.3 | 1,200.4 | 22.9 | 5.0 |
| Non-financial assets | 2,323.4 | 2,603.5 | 2,739.0 | 12.1 | 5.2 |
| Cash | 497.3 | 521.5 | 519.2 | 4.9 | − 0.4 |
| Receivables | 1,854.6 | 2,114.8 | 2,099.2 | 14.0 | − 0.7 |
| of which: | | | | | |
| Trade receivables | 518.7 | 575.4 | 588.3 | 10.9 | 2.3 |
| Receivables from affiliated companies | 1,071.5 | 1,233.9 | 1,227.8 | 15.2 | − 0.5 |
| Securities | 115.7 | 125.8 | 129.3 | 8.7 | 2.7 |
| Other long-term equity investments^2^ | 1,014.3 | 1,071.4 | 1,137.6 | 5.6 | 6.2 |
| Prepaid expenses | 38.9 | 39.5 | 42.5 | 1.5 | 7.8 |
| Financial assets | 3,520.8 | 3,873.0 | 3,927.7 | 10.0 | 1.4 |
| Total assets^3^ | 5,844.2 | 6,476.5 | 6,666.7 | 10.8 | 2.9 |
| **Capital** | |||||
| Equity^3^ | 1,770.7 | 1,872.0 | 2,004.5 | 5.7 | 7.1 |
| Liabilities | 3,098.4 | 3,502.7 | 3,537.6 | 13.1 | 1.0 |
| of which: | |||||
| to banks | 599.3 | 640.5 | 641.7 | 6.9 | 0.2 |
| Trade payables | 414.7 | 480.9 | 470.4 | 16.0 | − 2.2 |
| to affiliated companies | 1,322.5 | 1,513.1 | 1,518.7 | 14.4 | 0.4 |
| Advance payments received on account of orders | 349.7 | 424.3 | 474.9 | 21.3 | 11.9 |
| Provisions | 908.8 | 1,031.9 | 1,048.3 | 13.5 | 1.6 |
| of which: | |||||
| Provisions for pensions | 317.6 | 370.3 | 374.9 | 16.6 | 1.2 |
| Deferred income | 66.4 | 69.9 | 76.3 | 5.3 | 9.1 |
| Liabilities and provisions | 4,073.5 | 4,604.5 | 4,662.2 | 13.0 | 1.3 |
| Total capital^3^ | 5,844.2 | 6,476.5 | 6,666.7 | 10.8 | 2.9 |
| Memo items: | | | | | |
| Sales | 7,246.7 | 8,818.6 | 8,836.8 | 21.7 | 0.2 |
| Sales as a percentage of total assets | 124.0 | 136.2 | 132.6 | . | . |
|------------------------------------------------|--------:|--------:|--------:|------|---------|
{#par-u52e56}
{#par-i5oo31}
| **Table 3.4: Enterprises' balance sheet ratios\*** ||||
| Item | 2021 | 2022 | 2023^s^ |
| Item | As a percentage of total assets^1^ || 2023^s^ |
| Intangible fixed assets^2^ | 1.4 | 1.3 | 1.3 |
| Tangible fixed assets | 22.4 | 21.3 | 21.8 |
| Inventories | 15.9 | 17.7 | 18.0 |
| Short-term receivables | 29.1 | 30.0 | 28.6 |
| Long-term equity and liabilities^3^ | 50.2 | 47.9 | 48.5 |
| of which: | |||
| Equity^1^ | 30.3 | 28.9 | 30.1 |
| Long-term liabilities | 14.5 | 13.2 | 12.8 |
| Short-term liabilities | 38.5 | 40.8 | 40.3 |
| | As a percentage of tangible fixed assets^4^ || |
| Equity^1^ | 127.1 | 128.2 | 130.3 |
| Long-term equity and liabilities^3^ | 210.7 | 212.4 | 210.1 |
| | As a percentage of fixed assets^5^ || |
| Long-term equity and liabilities^3^ | 111.7 | 111.7 | 109.9 |
| | As a percentage of short-term liabilities || |
| Cash resources^6^ and short-term receivables | 99.8 | 95.2 | 92.4 |
| | As a percentage of liabilities and provisions^7^ || |
| Cash flow^8^ | 17.2 | 15.7 | 15.3 |
|----------------------------------------------|------:|------:|--------:|
{#par-o78o44}
**Profitability and financial position of German listed groups in 2023 and an outlook for 2024** {#tar-8}
---------------------------------------------------------------------------------------------------------
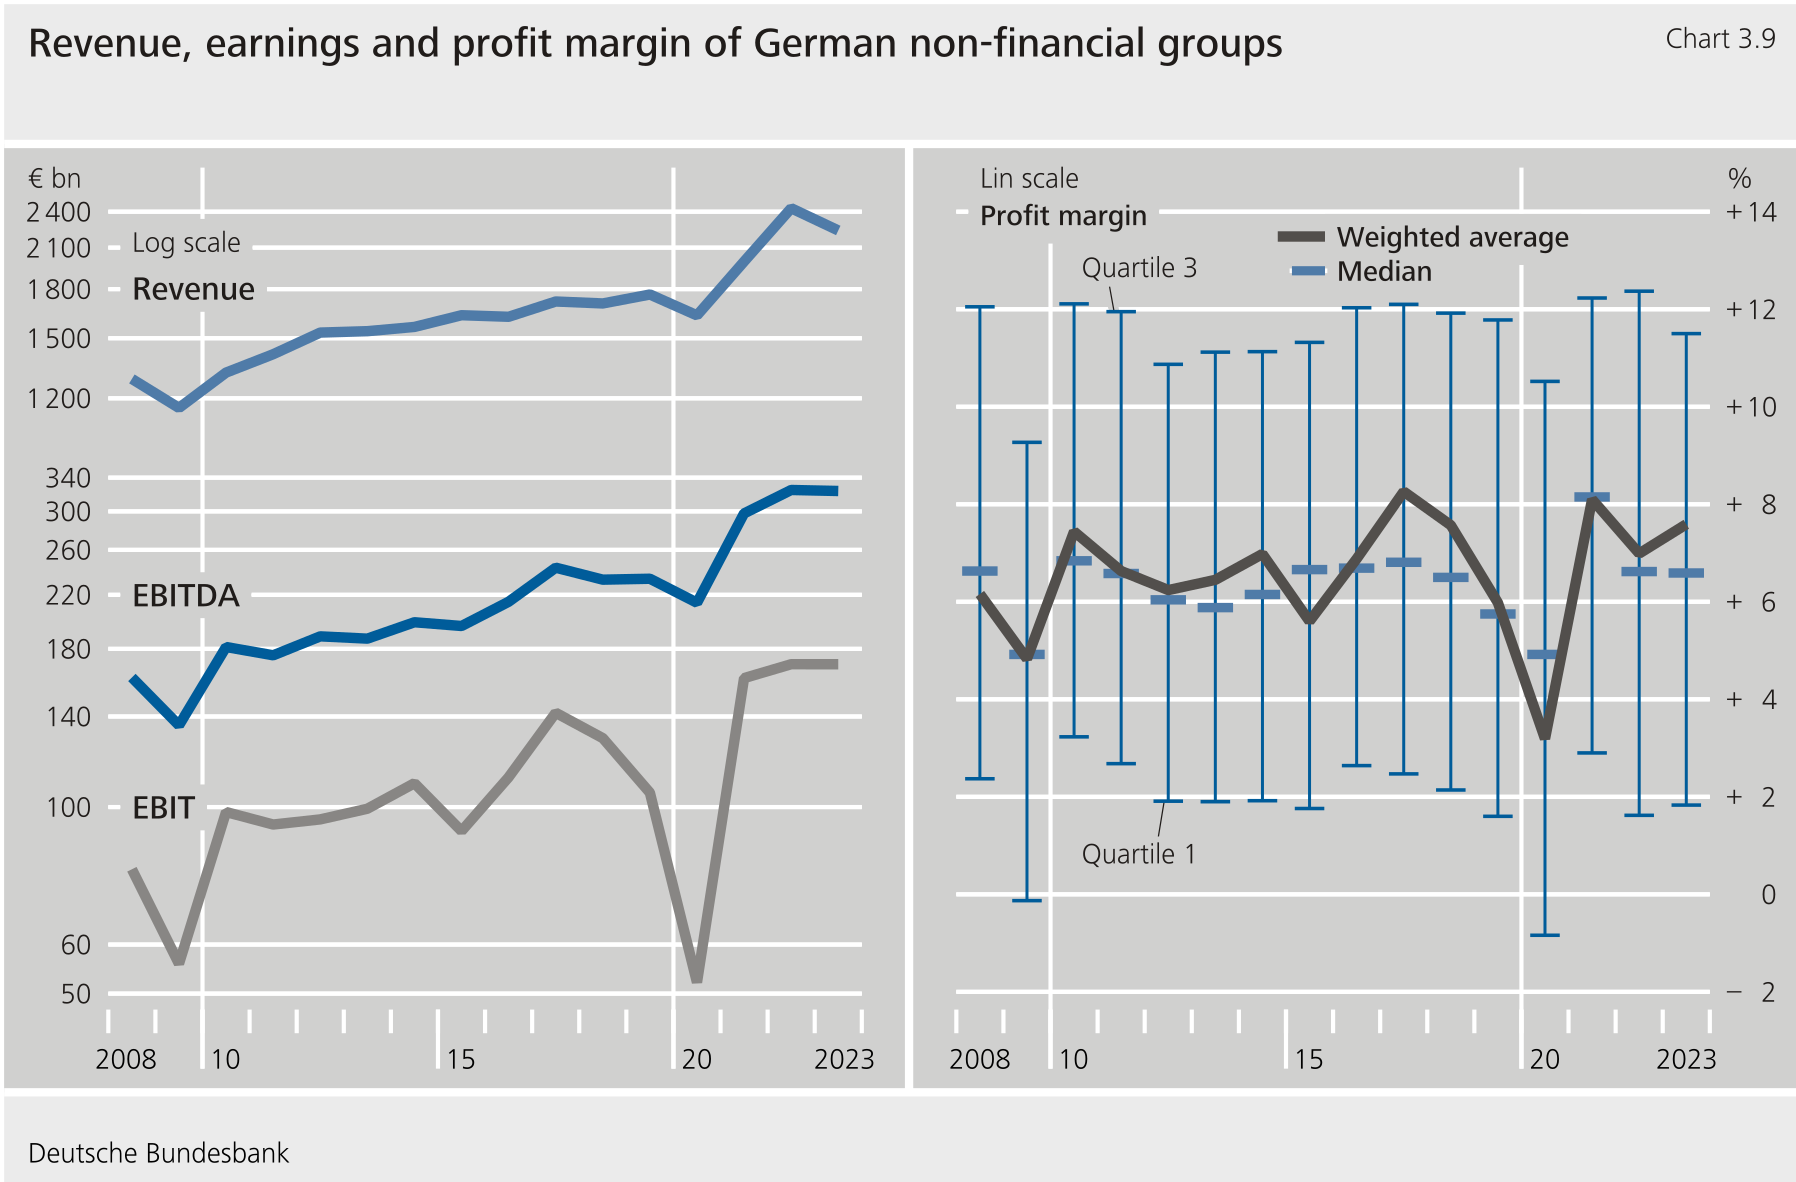
****German listed groups' revenue fell by 8 % in 2023, following strong growth in the two preceding years.** [\[1\]](#_ftn_777_1) Operating income before () and after (EBIT) depreciation and amortisation stagnated. As a result, the profit margin increased by 0.7 percentage point to 7.6 %.[\[2\]](#_ftn_777_2) It is thus above its mean since 2007 of 6.6 %.**{#par-auo3e1}
****The increase seen in groups' profit margin is not broad based.**The profit margin rose, especially in the case of large energy groups. Measured in terms of EBIT, their earnings situation in 2022 was still considerably affected by the additional costs of purchases to make up for the absence of commodity supplies from Russia and unfavourable valuation effects of derivatives for hedging against commodity price risks. These burdens ceased to exist in 2023, meaning that energy groups improved their profits significantly despite a decline in revenue. Excluding energy groups, the profit margin in the production sector fell by 1 percentage point to 7.6 %. The chemical industry, in particular, suffered from energy prices that were still higher than in 2019. These prices weighed on their competitiveness and it is likely that relocations of production abroad took place. Moreover, impairments were necessary due to higher capital costs and deteriorating business prospects. The profit margin in the services sector fell by 1 percentage point to 10.1 %. This was chiefly attributable to the drop in the profit margin seen in the logistics sector when taking the exceptionally high level in 2022 as a starting point. Average freight rates fell in 2023 as a result of weak demand and the normalisation of supply chains, which had a detrimental effect on the profitability of the logistics sector. The profit margin of groups in the rest of the services sector did not improve either.**{#par-i1uu34}
{#par-o861uu}
****
****The balance sheet saw groups' assets contract by 3 % in 2023.** This was mainly due to the significant loss in the value of energy groups' derivative assets. Lower commodity prices had an impact here. As a result, long-term assets fell by 1 % and short-term assets by 7 % in the reporting sample. In the case of the latter, the exceptionally high profit distribution of one single logistics group was another factor behind this development.**{#par-ee181i}
{#par-e48i33}
**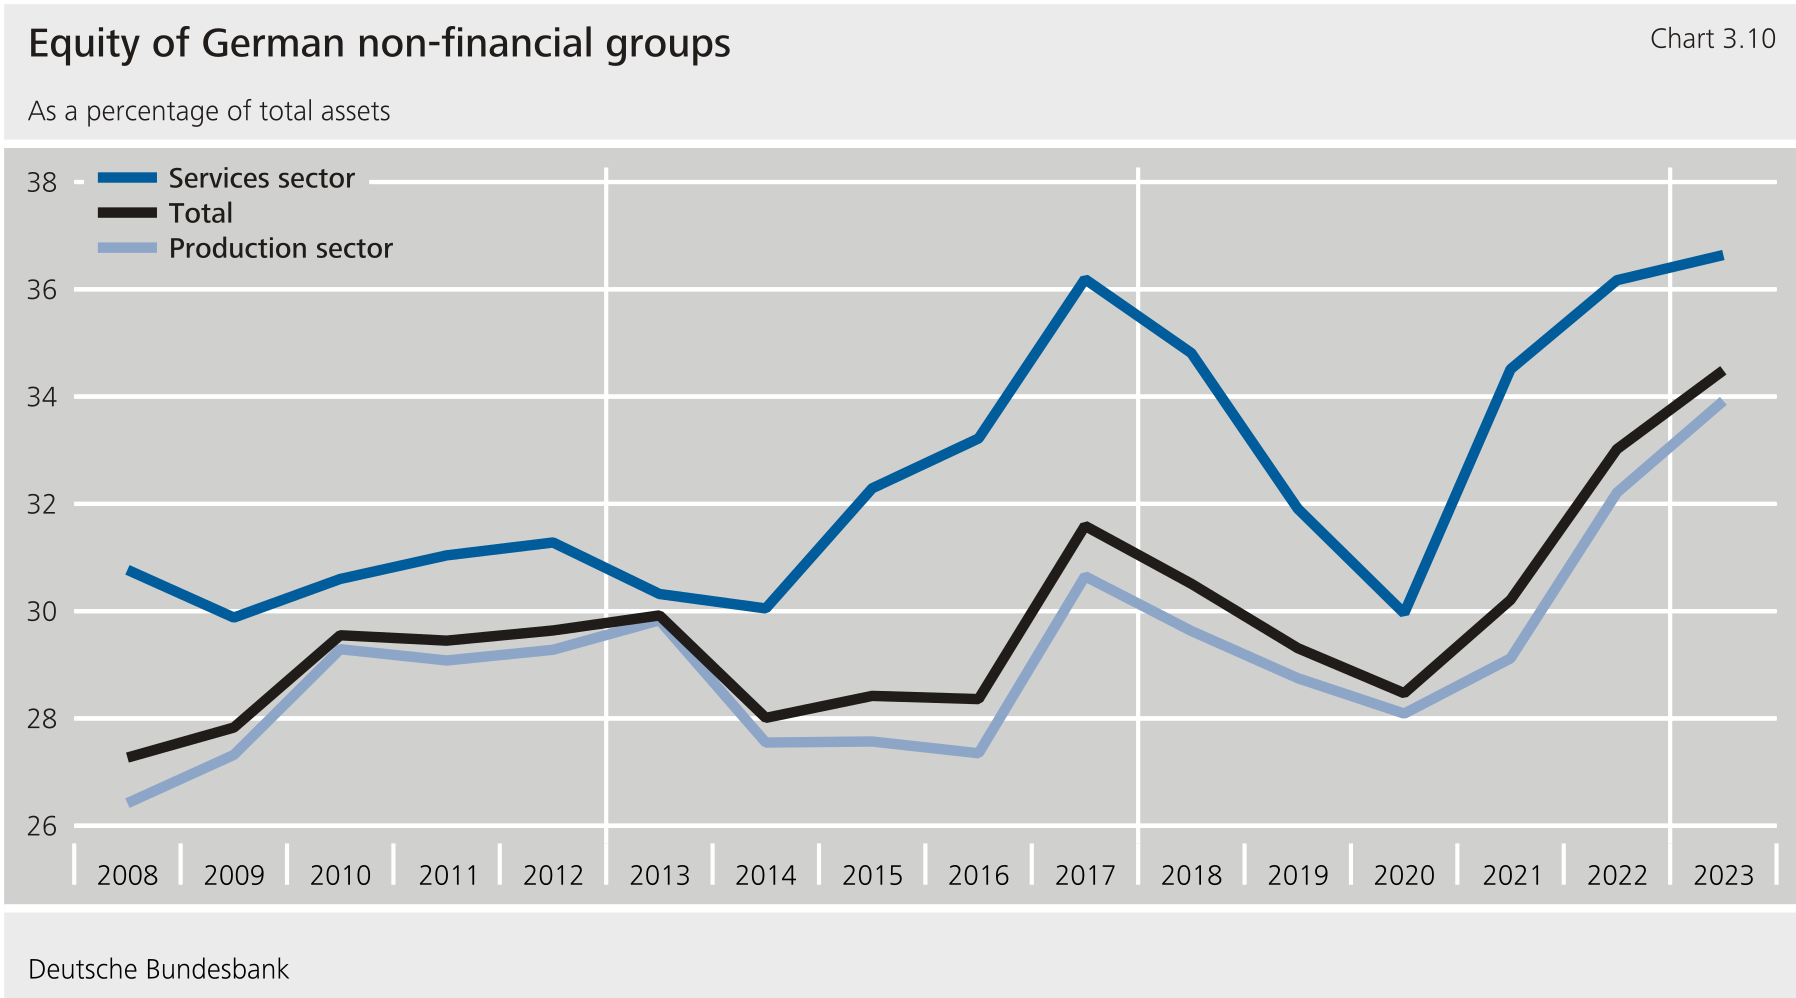**
****On the financing side, equity was up slightly by 1 % in 2023.** The retention of profits played a key role in this context. High spending on pension provisions and currency translation differences had a negative impact. Buy-backs also weighed on equity. Debt fell by 5 %, mainly due to the valuation of energy groups' derivatives positions, as was the case for assets. Overall, the leverage ratio declined, and the capital ratio increased by 1.5 percentage point to 34.5 %. In the production sector, it rose from 32.2 % to 33.9 %. The ratio grew more moderately in the services sector, rising 0.4 percentage point to 36.6 %. The lower capital ratio of the production sector compared with the services sector was once again attributable to automobile manufacturers' financing business in 2023. In some cases, this has a major impact on the financial structure at group level. Excluding the segments in automobile groups with a focus on financial services business, the capital ratio of the production sector increased from 36.8 % to 39.8 % in 2023.**{#par-aa9742}
{#par-oe82i5}
**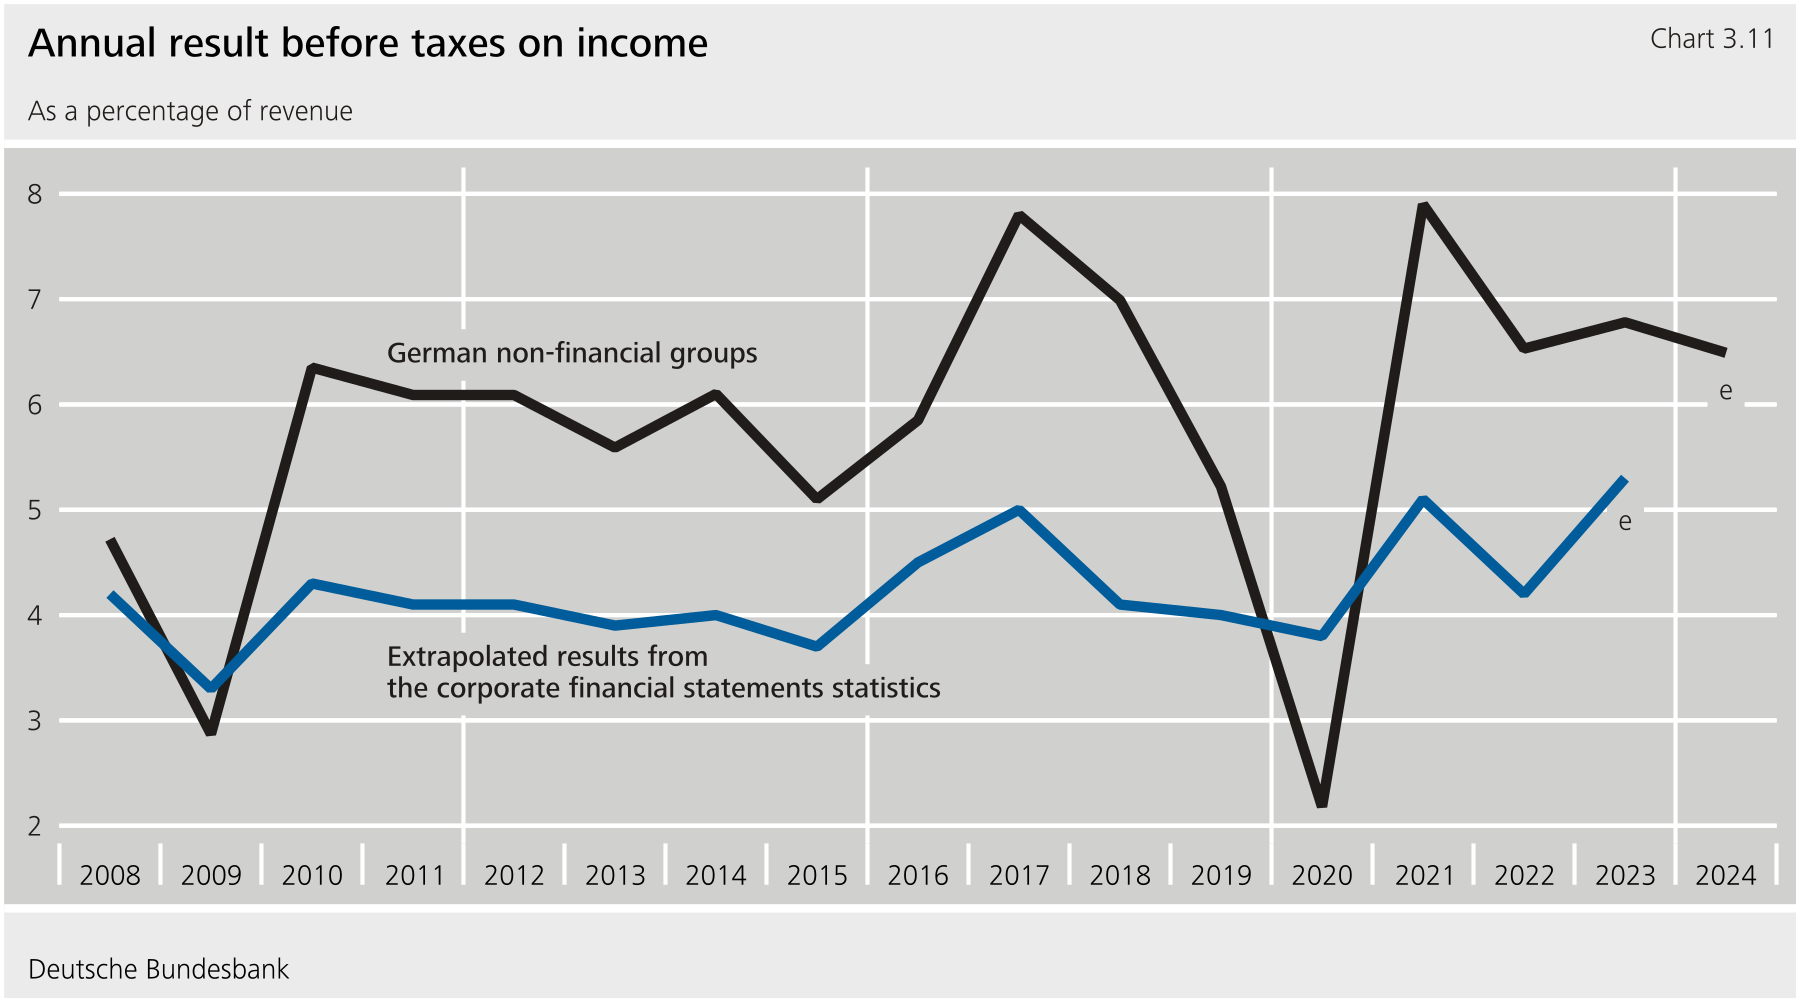**
****For 2024, there appears to be a moderate decline in revenue and a significant drop in pre-tax profits according to groups' interim financial statements that are currently available and have been evaluated.** Groups' profit margin is likely to decline somewhat as a result. This probably partly reflects the current earnings trends of domestic companies in the corporate financial statements statistics.[\[3\]](#_ftn_777_3) Viewed at the sector level of groups in the year to date, the picture that emerges is mixed. The services sector has increased its revenue and profits slightly. In the production sector, by contrast, automobile manufacturers, in particular, have recorded a decrease in revenue and strong earnings declines due to a weakness in sales as well as restructuring and transformation expenses. In addition, falling electricity and gas prices have led to a decline in energy groups' revenue, while their pre-tax profits have not reached the high level achieved in the previous year.**{#par-e4323u}
1. **{#_ftn_777_1} The reporting sample for the consolidated financial statements statistics comprises around 220 non-financial groups admitted for trading on the Prime Standard segment of the Frankfurt Stock Exchange (excluding real estate activities) that publish quarterly or half-yearly consolidated financial statements and make a meaningful contribution to value added in Germany. Groups are allocated to the production sector or services sector based on the main focus of their economic activity.**
2. **{#_ftn_777_2} The rates of change for revenue, earnings before interest, taxes, depreciation and amortisation (), earnings before interest and taxes (EBIT) and the profit margin (ratio of EBIT to revenue) are published with reporting and consolidation basis adjustments, albeit not the figures in euro billions or the weighted average profit margin.**
3. **{#_ftn_777_3} Alongside the stronger impact of global economic developments on consolidated financial statements, the metrics derived from the financial statements are materially shaped by differences between the accounting standards applied (German for corporate financial statement statistics (single-entity), for consolidated financial statement statistics).**
**6 Conclusion** {#tar-9}
-------------------------
****Despite the weak development of the economy and higher financing costs, non-financial corporations performed well in 2023 in terms of their earnings and financing conditions.** Energy-intensive enterprises continued to be negatively affected, probably in connection with the rise in energy prices, which worsened their competitive position. However, the corporate sector as a whole was able to increase its profitability compared to the previous year despite higher interest and personnel expenses. The fact that enterprises are offsetting lost revenue with cost savings also played a role, as sales growth was weak in 2023, and inflation remained high.**{#par-au4a16}
****Stability metrics also improved.** In addition to the gross profit margin and the capital base, enterprises' liquidity levels was also very good and long-term liabilities continued to fall.**{#par-a173ai}
****2024 will be another challenging year for enterprises.** The ongoing economic weakness is likely to weigh on enterprises' business activity and thus their sales growth in 2024. At the same time, the pressure on costs is expected to remain high due to persistently high financing and energy costs, as well as the sharp rise in wages. These pressures can also be seen in the increased number of corporate insolvencies, which are expected to exceed pre-pandemic levels again for the first time in 2024. On the one hand, cyclical stress factors are creating headwinds for enterprises. On the other, German firms are facing structural challenges posed by a shortage of skilled workers due to demographic factors, the green and digital transition of the economy, and the changed global economic environment. On balance, this is likely to weigh on profitability in some parts of the corporate sector, such as the manufacturing industry, and dampen profitability in the corporate sector as a whole in 2024.**{#par-aa5ae1}
**Long series of extrapolated results of the corporate financial statement statistics are available online at [www.bundesbank.de](https://www.bundesbank.de/content/796226).**{#par-iu73au}
**List of references** {#tar-10}
--------------------------------
**Acemoglu, D. (2024), The Simple Macroeconomics of , National Bureau of Economic Research, Working Paper, No 32487.**{#par-i25418}
**Acharya, V.V., M. Crosignani, T. Eisert and S. Steffen (2022), Zombie Lending: Theoretical, International, and Historical Perspectives, Annual Review of Financial Economics, Vol. 14, pp. 21--38.**{#par-ou7435}
**Aghion, P. and S. Bunel (2024), and Growth: Where Do We Stand, London School of Economics, Mimeo.**{#par-o77e96}
**Albuquerque, B. und R. Iyer (2023), The Rise of the Walking Dead: Zombie Firms Around the World, Working Paper, June 2023.**{#par-io2459}
**Alder, M., N. Coimbra and U. Szczerbowicz (2024), Corporate Debt Structure and Heterogeneous Monetary Policy Transmission, Discussion Paper, No 18787.**{#par-aeu36e}
**Andrews, D., and F. Petroulakis (2019), Breaking the shackles, Zombie firms, weak banks and depressed restructuring in Europe, European Central Bank, Working Paper Series, No 2240.**{#par-a26aeo}
**Becker, T., E. Biewen, D. Hüwel, and S. Schultz (2024), Individual Financial Statements of Non-Financial Firms (), Data Report 2024‑09 -- Metadata Version Data-Docv-13, Deutsche Bundesbank, Research Data and Service Centre.**{#par-e2e81i}
**Becker, T., E. Biewen, D. Hüwel, and S. Schultz (2022), Corporate Balance Sheets (Ustan) 1964--1986, Data Report 2022‑18 -- Metadata Version 1, Deutsche Bundesbank, Research Data and Service Centre.**{#par-ouee6a}
**Becker, T., E. Biewen, S. Schultz, and M. Weisbecker (2020), Corporate Balance Sheets (Ustan) 1987--2019, Data Report 2020‑08 -- Metadata Version 4, Deutsche Bundesbank, Research Data and Service Centre.**{#par-oe812e}
**Bergeaud, A. (2024), [The Past, Present and Future of European Productivity](https://www.ecb.europa.eu/pub/pdf/sintra/ecb.forumcentbank2024_Bergeaud_paper~e2cab1d8ac.en.pdf). Forum on Central Banking 2024.**{#par-a71459}
**Bick, A., A. Blandin and D. J. Deming (2024), The Rapid Adoption of Generative , Working Paper, No 32966.**{#par-e66u2i}
**Bighelli, T., T. Lalinsky, and J. Vanhala (2022), Covid-19 pandemic, state aid and firm productivity, Bank of Finland Research Discussion Papers, No 1/2022.**{#par-a2865o}
**Bittner, C., F. Fecht and C. Georg (2021) Contagious Zombies, Deutsche Bundesbank Discussion Paper No 15/2021.**{#par-a9eui4}
**Boddin, D. and M. Köhler, The High Frequency Firm Survey "Bundesbank Online Panel -- Firms", [Jahrbücher für Nationalökonomie und Statistik](https://www.degruyter.com/journal/key/jbnst/html), Vol. 244(3), pp. 267--275.**{#par-iioo15}
**Briggs, J. and D. Kodnani (2023), The Potentially Large Effects of Artificial Intelligence on Economic Growth, Goldman Sachs Economics Research.**{#par-a726u3}
**Caballero, R. J., T. Hoshi, and A. K. Kashyap (2008), Zombie Lending and Depressed Restructuring in Japan, American Economic Review Vol 98(5), pp. 1943--77.**{#par-e1o68e}
**Cœuré, B. (2021), What 3.5 million French firms can tell us about the efficiency of Covid-19 support measures.**{#par-iea4a9}
**De Jonghe, O., Mulier, K. and Samarin, I. (2024), Counting the undead: A new metric for identifying zombie firms.**{#par-io8ia7}
**Dell'Acqua, F., E. McFowland III, E. R. Mollick, H. Lifshitz-Assaf, K. Kellogg, S. Rajendran, L. Krayer, F. Candelon and K. R. Lakhani (2023), Navigating the Jagged Technological Frontier: Field Experimental Evidence of the Effects of on Knowledge Worker Productivity and Quality, Harvard Business School Technology \& Operations Management Unit Working Paper, No 24‑013.**{#par-aa8u4a}
**Deutsche Bundesbank (2023), The impact of digitalisation on labour productivity growth, Monthly Report, March 2023, pp. 43‑65.**{#par-i1io2a}
**Deutsche Bundesbank (2021a), Corporate insolvencies in Germany during the coronavirus crisis, Monthly Report, December 2021, pp. 47-- 49.**{#par-a75u7e}
**Deutsche Bundesbank (2021b). The impact of monetary policy depending on the debt situation in the non-financial private sector: Evidence for the euro area, Monthly Report, April 2021, pp. 15--33.**{#par-eo7ia5}
**Deutsche Bundesbank (2021c), Assessments and expectations of firms in the pandemic: findings from the Bundesbank Online Panel Firms, Monthly Report, April 2021, pp. 33ff.**{#par-eo4a3a}
**Deutsche Bundesbank (2020): German enterprises' profitability and financing in 2019, Box -- Updated assessment of the development of zombie firms in Germany, Monthly Report, December 2020, p. 68‑70.**{#par-o983au}
**Deutsche Bundesbank (2017): German enterprises' profitability and financing in 2016, Box -- The emergence of zombie firms in Germany in the low-interest-rate environment, Monthly Report, December 2017, pp. 37‑40.**{#par-e53658}
**Eloundou T., S. Manning, P. Mishkin and D. Rock (2023), are : An Early Look at the Labor Market Impact Potential of Large Language Models.**{#par-o87iu1}
**Favara, G., C. Minoiu and A. Perez-Orive, (2021), U.S. Zombie firms: How many and how consequential? FEDS Notes, Board of Governors of the Federal Reserve System.**{#par-ae4ie6}
**Federal Ministry for Economic Affairs and Climate Action (2022), Informationen zu Corona-Hilfen des Bundes.**{#par-e7e943}
**Federal Statistical Office (2024), Rechtliche Einheiten mit Nutzung von Technologien der künstlichen Intelligenz () nach Beschäftigtengrößenklassen.**{#par-i8e8u3}
**Jordà, Ò. (2005), Estimation and Inference of Impulse Responses by Local Projections, American Economic Review, Vol. 95 (1), pp. 161--182.**{#par-e95889}
**Kerkhof, A., T. Licht, M. Menkhoff and K. Wohlrabe (2024), Die Nutzung von Künstlicher Intelligenz in der deutschen Wirtschaft, Schnelldienst, Vol. 77 (08), pp. 39--43.**{#par-o63239}
**Kilian, L., and H. Lütkepohl (2017), Structural Vector Autoregressive Analysis, Cambridge University Press.**{#par-oa6416}
**Kurt, E., Asymmetric effects of monetary policy on firms, Journal of Money, Credit, and Banking (forthcoming).**{#par-o68345}
**Lane, M., M. Williams and S. Broecke (2023), The impact of on the workplace: Main findings from the surveys of employers and workers. Social, Employment and Migration Working Papers, No 288.**{#par-i393ei}
**McGowan, M., D. Andrews and V. Millot (2018), The walking dead? Zombie firms and productivity performance in countries, Economic Policy, Vol. 33, pp. 685--736.**{#par-ueu26u}
**Noy, S. and W. Zhang (2023), Experimental Evidence on the Productivity Effects of Generative Artificial Intelligence, Science, Vol. 381 (6654), pp. 187--192.**{#par-u2257i}
**Pelosi, M., G. Rodano and E. Sette, (2021), Zombie firms and the take-up of support measures during Covid-19, Banca d'Italia Occasional Paper, No 650.**{#par-u66o5i}
**Peng, S., E. Kalliamvakou, P. Cihon and M. Demirer (2023), The Impact of on Developer Productivity: Evidence from GitHub Copilot.**{#par-ae8989}
**Pérez-Orive, A., and Y. Timmer (2023), Distressed Firms and the Large Effects of Monetary Policy Tightenings FEDS Notes, Board of Governors of the Federal Reserve System.**{#par-i43237}
**Schaller, D., K. Wohlrabe and A. Wolf (2023), , Cloud Computing und Blockchain -- wo steht die deutsche Wirtschaft?, Schnelldienst, 2023, Vol. 8 2023, pp. 3--9.**{#par-u451uo}
1. **{#_ftn_root_1} The analysis for 2023 is based on some 19,500 corporate annual financial statements, which were roughly extrapolated based on the evaluation of aggregate sales data from the business register.**
2. **{#_ftn_root_2} According to the Federal Statistical Office, both domestic and foreign sales in the automotive industry rose by around 11 % in 2023 over the previous year.**
3. **{#_ftn_root_3} In addition, income increased due to the reversal of provisions for anticipated losses from pending transactions.**
4. **{#_ftn_root_4} However, without these two sectors, it also fell less sharply in the previous year. In this calculation, the decline came to 0.5 instead of 0.9 percentage point and the gross profit margin to 5.3 % instead of 4.2 %.**
5. **{#_ftn_root_5} See Bundesbank (2021a).**
6. **{#_ftn_root_6} The data comprise over 160,000 observations from around 10,000 companies from 1973 to 2019 and are based on the Ustan and datasets. See Becker et al. (2020, 2022, 2024).**
7. **{#_ftn_root_7} In the first step, monetary policy shocks were identified using a Bayesian vector autoregressive model. See Kilian and Lütkepohl (2017). In the second step, the estimate based on local projections takes into account both firm-specific and macroeconomic factors to determine the effect of unexpected interest rate changes on the firm-level indicators. The control variables include firm-specific characteristics such as the equity ratio and liquidity as well as macroeconomic variables such as the interbank interest rate and the output gap. See Jordà (2005) on the local projections method. See Alder et al. (2023) and Perez-Orive and Timmer (2023) for similar studies on France and the United States. The corporate investment ratio is defined here, as is common in the literature, as the change in tangible fixed assets (net investment) in relation to total assets in the previous year.**
8. **{#_ftn_root_8} Given an average investment ratio of around 12 % in the dataset this effect is quantitatively significant.**
9. **{#_ftn_root_9} Taken in isolation and in view of the current interest rate increase, roughly speaking, the investment ratio could be reduced even more strongly than the results without asymmetry suggest, i.e. by 5.2 percentage points.**
10. **{#_ftn_root_10} For similar results, see Perez-Orive and Timmer (2023) and Kurt (forthcoming).**
11. **{#_ftn_root_11} See also Deutsche Bundesbank (2021b) and Perez-Orive and Timmer (2023).**
12. **{#_ftn_root_12} Here, the energy-intensive manufacturing sector comprises the wood, paper and printing industries, the chemical and pharmaceutical industries, the rubber, plastics and ceramics industries, and the metal industry. Owing to the small number of enterprises, the coke and refined petroleum products industry, which is also energy-intensive, is not reported separately in the annual financial statements statistics. It cannot therefore be included in the energy-intensive manufacturing sector.**
13. **{#_ftn_root_13} The decline in personnel expenses is mainly due to lower expenses for company pensions (including an adjustment of the pension trend due to lower inflation expectations) at large enterprises. On the one hand, the sharp fall in liabilities played a role in the decline in interest expense. On the other, the interest expense in 2022 was exceptionally high by historical standards.**
14. **{#_ftn_root_14} The rest of the manufacturing sector mainly comprises the electrical industry, the food industry and the clothing industry.**
15. **{#_ftn_root_15} The minimal increase in additional liabilities was the main reason for the low contribution of external financing to corporate funding in 2023.**
*[IMF]: International Monetary Fund
*[ECB]: European Central Bank
*[NBER]: National Bureau of Economic Research
*[EBITDA]: earnings before interest, taxes, depreciation and amortization
*[AI]: artificial intelligence
*[GAAP]: Generally Accepted Accounting Principles
*[GPTs]: generative pre-trained transformers
*[COVID]: coronavirus disease
*[**JANIS**]: Jahresabschlüsse deutscher nichtfinanzieller Unternehmen
*[JANIS]: Jahresabschlüsse deutscher nichtfinanzieller Unternehmen
*[GDP]: gross domestic product
*[**AI**]: artificial intelligence
*[OECD]: Organisation for Economic Co-operation and Development
*[ifo]: economic research institution
*[PC]: personal computer
*[**PD**]: probability of default
*[PD]: probability of default
*[ICT]: information and communications technology
*[IFRS]: International Financial Reporting Standard
*[KfW]: Kreditanstalt für Wiederaufbau
*[KI]: Künstliche Intelligenz
*[**COVID**]: coronavirus disease