# 5 Metrics
* [*5.1 Euro portfolio*](#tar-1 "5.1 Euro portfolio")
* *[*5.1.1 GHG metrics*](#tar-2 "5.1.1 GHG metrics")*
* **[*5.1.2 Green and brown shares of business activities*](#tar-3 "5.1.2 Green and brown shares of business activities")**
* ***[*5.1.3 Compliance with international standards and other sustainability aspects*](#tar-4 "5.1.3 Compliance with international standards and other sustainability aspects")***
* ***[*5.2 Reserve assets*](#tar-5 "5.2 Reserve assets")
* *[*5.2.1 Bonds issued by promotional and development banks*](#tar-6 "5.2.1 Bonds issued by promotional and development banks")*
* **[*5.2.2 Sovereign investments*](#tar-7 "5.2.2 Sovereign investments")**
* ***[*5.2.3 The Bundesbank's gold holdings*](#tar-8 "5.2.3 The Bundesbank’s gold holdings")******
* ***[*5.3 The Eurosystem's monetary policy holdings of corporate bonds and covered bonds*](#tar-9 "5.3 The Eurosystem’s monetary policy holdings of corporate bonds and covered bonds")
* *[*5.3.1 The Eurosystem's monetary policy holdings of covered bonds*](#tar-10 "5.3.1 The Eurosystem’s monetary policy holdings of covered bonds")*
* **[*5.3.2 The Eurosystem's monetary policy holdings of corporate bonds*](#tar-11 "5.3.2 The Eurosystem’s monetary policy holdings of corporate bonds")*****
***In today's financial world, giving consideration to climate and sustainability-related information is increasingly becoming a strategic necessity. Like all other Eurosystem central banks, the Bundesbank discloses relevant metrics to help improve transparency about climate-related risks and impacts in the financial sector. This type of reporting also allows the Bundesbank to continuously analyse relevant aspects of its financial investments, which helps it to identify and manage risks at an early stage.***{#par-u1876u}
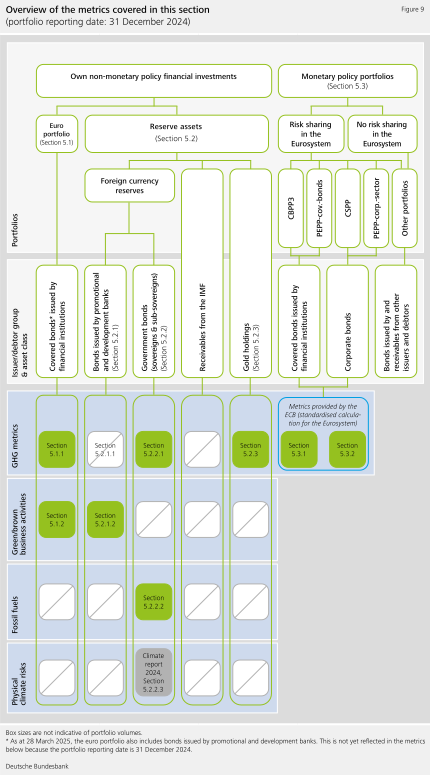
***Figure 9 provides an overview of the portfolios, asset classes and metrics that are covered in this section. Reporting focuses on metrics such as the , **total carbon emissions** and the **carbon footprint** . From 2023, the calculation methods have been based on a common Eurosystem central bank disclosure framework, which is revised and updated annually. This framework is aligned with the recommendations of the Task Force on Climate-related Financial Disclosures () and the Partnership for Carbon Accounting Financials (). The calculation methods are explained in detail in the [Annex](https://publikationen.bundesbank.de/content/959492).***{#par-a1a3e5}
{#par-i5a379}
****
**For the first time, the Bundesbank is also reporting on **metrics for the Eurosystem's monetary policy holdings of corporate and covered bonds** . The relevant metrics were calculated centrally for the Eurosystem by the and provided to the Bundesbank. They are also published in the [ECB's climate-related financial disclosures](https://www.ecb.europa.eu/ecb/climate/climate-related-financial-disclosures/html/index.en.html), together with other metrics on these and other Eurosystem monetary policy holdings.**{#par-u4oa7o}
**5.1 Euro portfolio** {#tar-1}
-------------------------------
**As at the reporting date of 31 December 2024, the euro portfolio consisted exclusively of covered bonds -- as was the case on the reporting dates of previous disclosures. These are bonds issued by banks, which are mainly backed by real estate mortgages. The following [Annex](https://publikationen.bundesbank.de/content/959492) relate to the issuers of these bonds. The decisive factor is thus the sustainability and environmental performance of the issuing banks (in relation to their business activities as a whole). Insufficient data are available for the cover pools, on the other hand.**{#par-e8265e}
**When these disclosures were prepared, the euro portfolio had already been expanded to include unsecured bonds -- more specifically, bonds issued by supranational and national promotional and development banks (see Section [3 Strategy](https://publikationen.bundesbank.de/content/957502)). However, because the reporting date is 31 December 2024, these are not yet reflected in the following metrics.**{#par-a4944u}
### **5.1.1 metrics** {#tar-2}
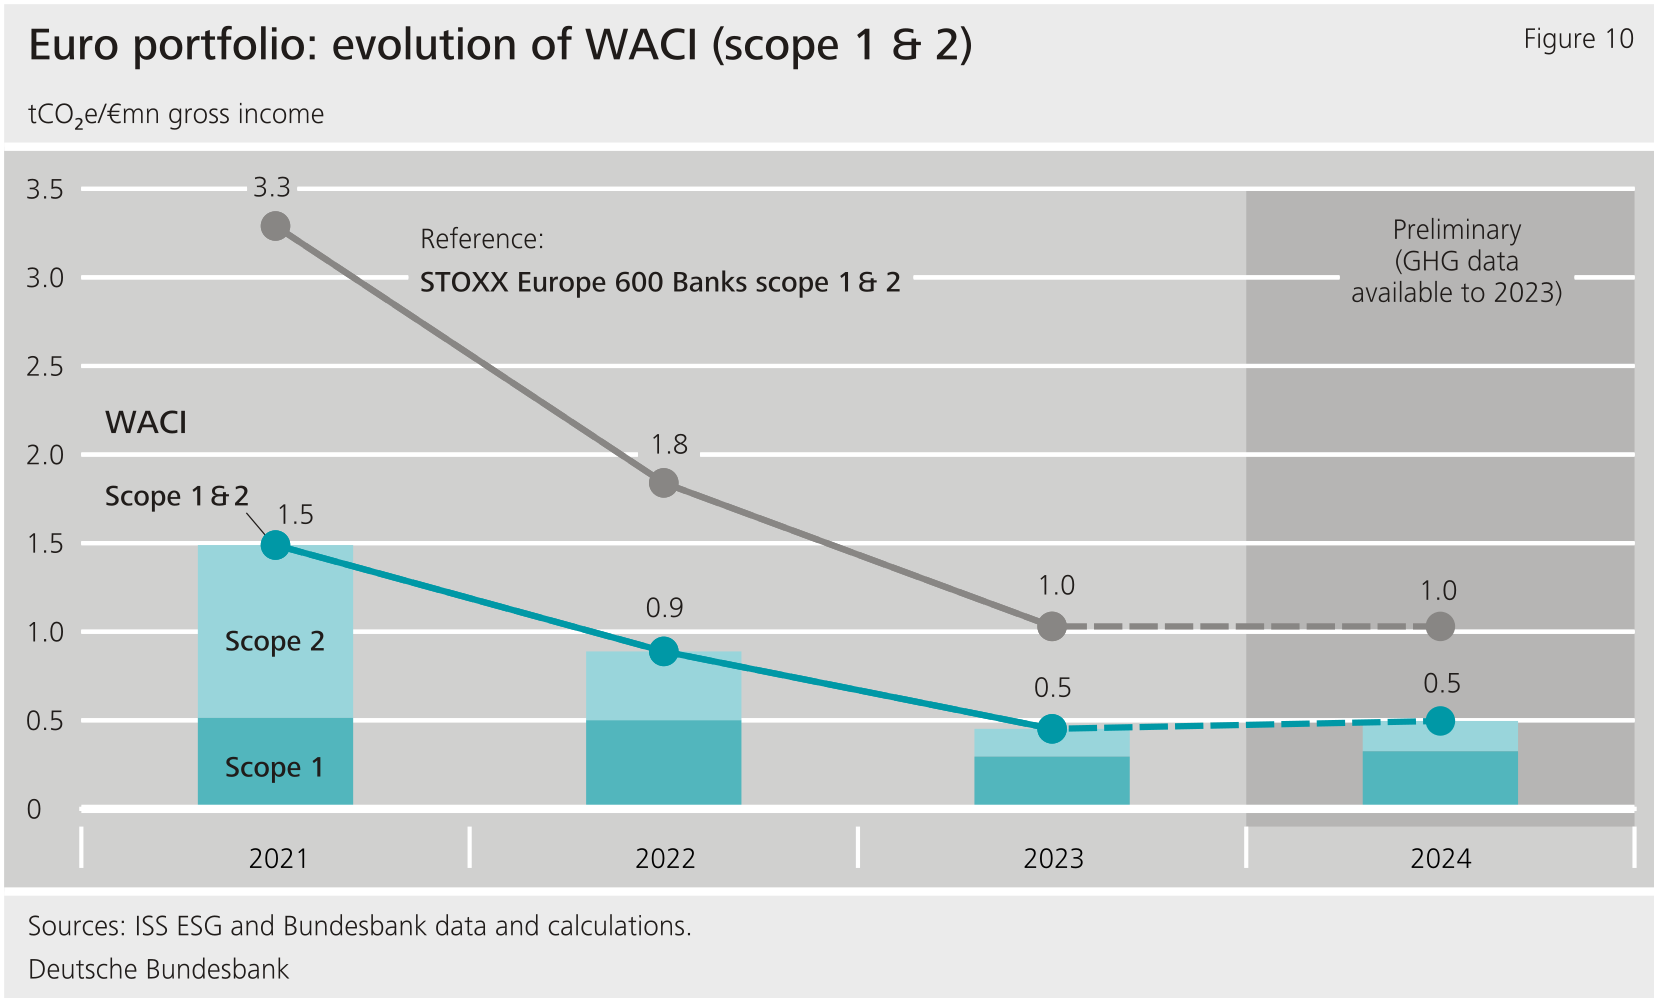
**As at 31 December 2024, the (scope 1 \& 2) of the euro portfolio was 0.5 tonnes of CO~2~e per million euro of gross income (see Table 1). The metrics as at the portfolio reporting date of 31 December 2023 were updated retroactively based on the data that are now available for 2023. With the exception of 2024, for which metrics are still based on the 2023 data for the time being, the has seen a persistent and significant decline since 2021. Banks' scope 2 emissions, in particular, are decreasing (see Figure 10). This is probably first and foremost because banks are increasingly purchasing electricity from renewable sources.**{#par-i12136}
{#par-u373o4}{#par-i52a1o}{#par-o54ao8}{#par-o67o4i}{#par-a272o4}{#par-i63a4a}{#par-oe6iua}
| Table 1: Overview of metrics for the euro portfolio |||||||
| ||| **Portfolio as at:** ||||
|---|---|------------------|----------------------|-----------------------------------|--------------------|--------------------|
| ||| **31.12.2021** | **31.12.2022** | **31.12.2023** | **31.12.2024** |
| **Portfolio holdings** (by nominal value) ||| **€10.0 billion** | **€8.9 billion** | **€7.3 billion** | **€5.2 billion** |
| (tCO~2~e/€mn of gross income) || **Scope 1 \& 2** | **1.49** (86.4 %) | **0.89** (92.3 %) | **0.45** (94.1 %) | **0.50** (96.5 %) |
| **Total carbon emissions** (tCO~2~e) || **Scope 1 \& 2** | **1,445.4** (80.0 %) | **1,037.0**{#par-iaoo37} (87.0 %) | **646.0** (80.2 %) | **535.4** (96.5 %) |
| **Carbon footprint** (tCO~2~e/€mn of investment) || **Scope 1 \& 2** | **0.18** (80.0 %) | **0.13** (87.0 %) | **0.11** (80.2 %) | **0.11** (96.5 %) |
{#par-o44327}
**The euro portfolio is roughly half as -intensive compared with the average of the 50 largest European banks by market capitalisation according to the STOXX Europe 600 Banks stock index.[\[1\]](#_ftn_root_1) For the STOXX Europe 600 Banks index, too, the decline in intensity is largely attributable to scope 2 emissions.**{#par-o3eo7o}
{#par-e1aae5}
****
****Total carbon emissions** (scope 1 \& 2) as at 31 December 2024 amounted to 535.4 tonnes of CO~2~e. emissions financed by the euro portfolio thus continue to decline significantly. This effect is also due to the fact that portfolio holdings declined from €10.0 billion to €5.2 billion between the end of 2021 and the end of 2024. Nevertheless, the **carbon footprint** (scope 1 \& 2), which expresses total carbon emissions in relation to portfolio volume, decreased as well (from 0.18 to 0.11 tonne of CO~2~e/€mn of investment from 2021 to 2024).**{#par-ee2u8o}
**The aforementioned metrics represent only a small part of the total emissions associated with the euro portfolio, however, and therefore do not reveal the full picture. This is because neither scope 1 nor scope 2 emissions include, inter alia, emissions associated with the financing activities of the issuing banks, because these form part of scope 3 emissions. However, the scope 3 data disclosed by banks rarely include their financed emissions.[\[2\]](#_ftn_root_2) As at the reporting date of 31 December 2024, such data are only disclosed for around 36 % of the euro portfolio volume. Despite continuous improvements, the scope 3 data thus do not provide sufficient coverage of the euro portfolio at the moment. Given this, the Bundesbank is not reporting scope 3 metrics on the euro portfolio at present.**{#par-ao2u85}
### **5.1.2 Green and brown shares of business activities** {#tar-3}
**The **"green" and "brown" shares** of a portfolio are dependent on the business activities of enterprises financed by the portfolio. The metrics consider green and brown business activities as a share of an enterprise's revenue. This is based on a classification system created by , which classes business activities as beneficial ("green") or harmful ("brown") to the environment in alignment with the Sustainable Development Goals (). If the funded enterprises are banks (as in the case of the euro portfolio), shares of business volume (including lending and investment) rather than revenue shares are taken into account. Based on these shares, a weighted average is calculated for the portfolio along similar lines to the methodology.[\[3\]](#_ftn_root_3)**{#par-a1e4io}
**The **green share** for the euro portfolio comes to 1.8 % (Figure 11). It is thus higher than the average green share of the STOXX Europe 600 Banks index (0.8 %).[\[4\]](#_ftn_root_4) Around half of the green share is made up of financing arrangements aimed primarily at achieving the climate goal within the meaning of the ("mitigating climate change"). This is predominantly the financing of renewable energies and energy efficiency measures. The other half of the green business activities primarily serve the environmental goal of "promoting sustainable buildings", but thus are also very much climate-related. This includes financing of real estate certified as sustainable and/or energy-efficient.**{#par-au1i64}
{#par-e2u46o}
**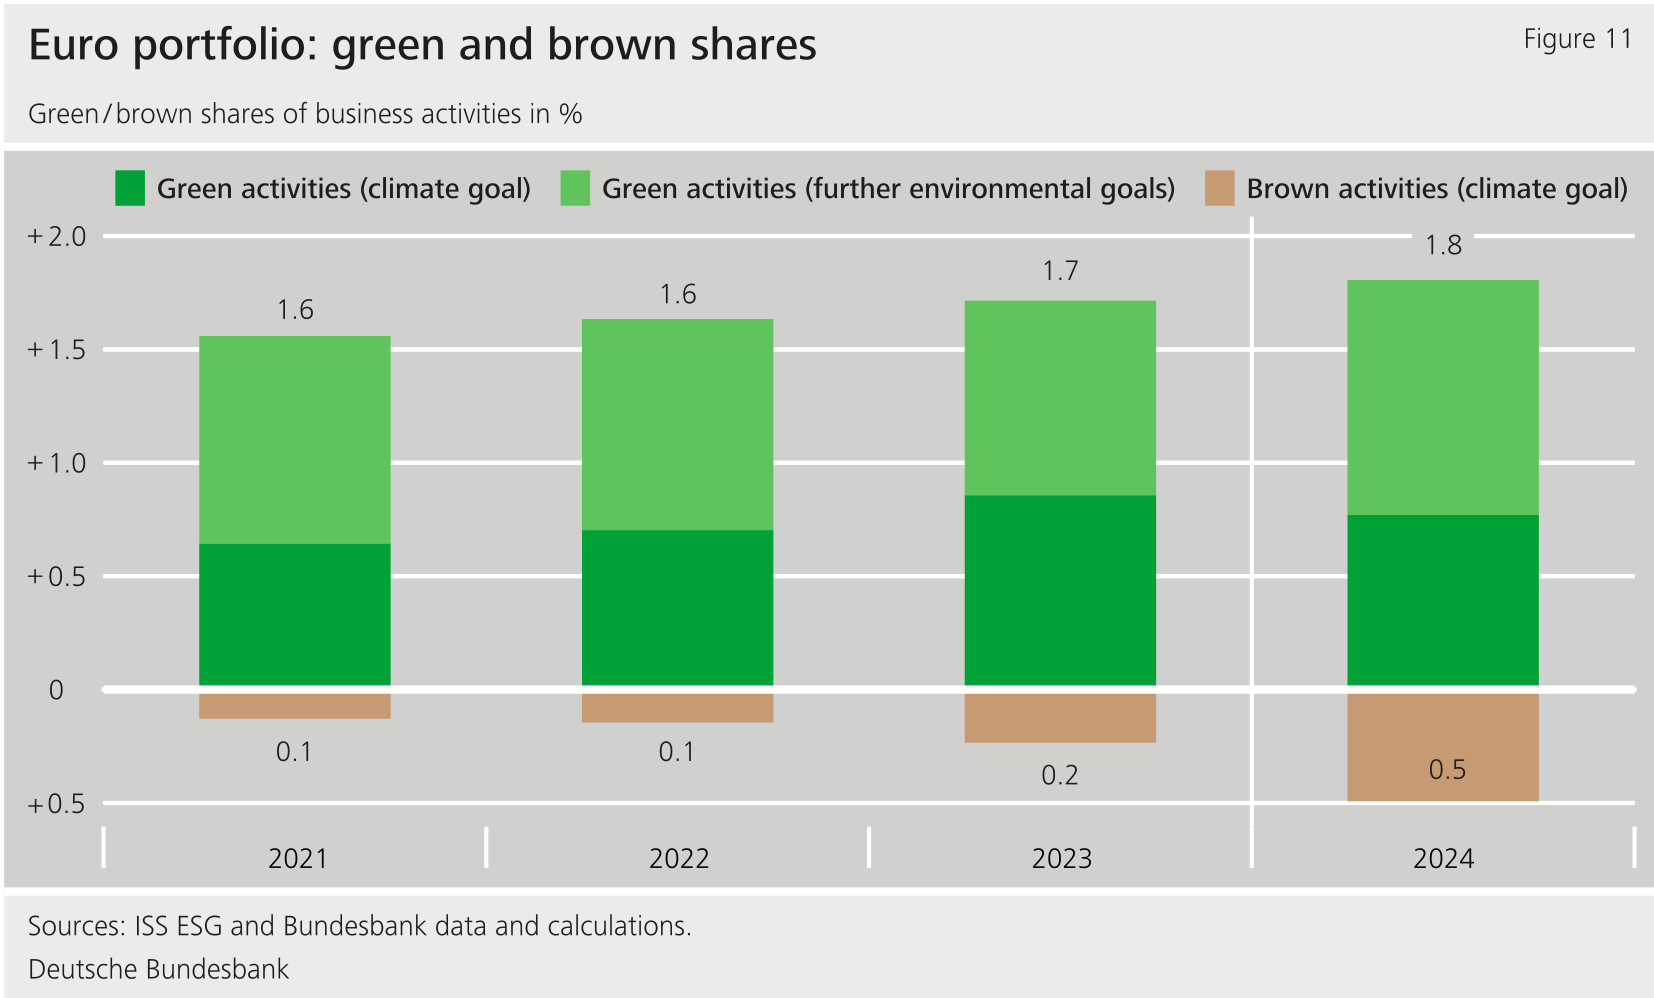**
**The **brown share**of the euro portfolio rose from 0.2 % to 0.5 % on the year, mainly because one of the banks is involved in financing the expansion of an airport. However, the brown share of the euro portfolio continues to be below the average of the STOXX Europe 600 Banks index (1.2 %). The brown share of the latter is largely attributable to financing for purchases of vehicles with internal combustion engines. This is of very little relevance for the business activities of banks whose bonds are held in the euro portfolio.**{#par-ooe1u4}
**does not count the majority of financing as either beneficial or harmful to the environment. However, commercial banks that issue covered bonds have very different levels of transparency when disclosing their financing activities. Potentially broadening their sustainability-related disclosures in future could therefore help to better capture financing activities that have a particular bearing on the climate and the environment.**{#par-o3651u}
### **5.1.3 Compliance with international standards and other sustainability aspects** {#tar-4}
**In accordance with the sustainable investment strategy for the euro portfolio, bond issuers are screened for compliance with minimum standards on an ongoing basis. The negative screening for breaches of international standards is grounded in the norm-based assessment of entities by the data provider . As at 31 December 2024, the euro portfolio did not include any bonds issued by entities for which had detected severe proven breaches of international standards. Nor did identify any involvement in controversial weapons for any of the entities. The euro portfolio thus meets the minimum standards set out in the sustainable investment strategy.**{#par-aueo81}
**The sustainable investment strategy for the euro portfolio does not include any targeted purchases of green bonds or comparable forms of bonds. Accordingly, green bonds accounted for only a small share of the portfolio volume as at 31 December 2024, at 0.7 %. Comparable forms of bonds such as social bonds are not included in the euro portfolio.**{#par-e3o7u2}
**5.2 Reserve assets** {#tar-5}
-------------------------------
**With regard to the Bundesbank's reserve assets, portfolio holdings are determined by currency policy-driven requirements. The reserve assets comprise gold holdings, receivables from the and foreign currency reserves. The latter mainly include investments in sovereigns, of which government bonds account for the largest share. Besides these, bonds issued by national or supranational promotional and development banks are also held in the foreign currency reserves. Assets relating to the Bank for International Settlements () are not incorporated into the calculation of the metrics.**{#par-e1u8ou}
### **5.2.1 Bonds issued by promotional and development banks** {#tar-6}
**The [Annex](https://publikationen.bundesbank.de/content/959492) of the following metrics on portfolio holdings of bonds issued by national or supranational promotional and development banks (see Table 2) follows the same methodology as for the euro portfolio.**{#par-a6a668}
{#par-e46eo1}{#par-eu4uu6}{#par-i9a889}{#par-i5371e}
| Table 2: Reserve assets: holdings of bonds issued by promotional and development banks |||||
| | **At the reporting date:** ||||
|-------------------------------------------------------------|----------------|----------------|----------------|----------------|
| | **31.12.2021** | **31.12.2022** | **31.12.2023** | **31.12.2024** |
| **Portfolio holdings**{#par-i374e3} (by nominal value, €bn) | **2.03** | **2.16** | **2.07** | **2.02** |
{#par-e3e581}
#### **5.2.1.1 metrics**
**Compared with commercial banks, supranational development banks, in particular, only disclose their scope 1 and 2 emissions in isolated cases. It is therefore not currently possible to calculate metrics that cover a significant proportion of the bonds issued by promotional and development banks. For this report, therefore, no such metrics are reported. As is the case for the euro portfolio, the data available on banks' scope 3 emissions are also insufficient.**{#par-eu828i}
#### **5.2.1.2 Green and brown shares of business activities**
**By contrast, extensive findings are available for the business activities of promotional and development banks, including their **green and brown shares** .[\[5\]](#_ftn_root_5) Data availability is improved by promotional and development banks being required by their mandates to exercise a high degree of transparency surrounding their financing activities.**{#par-e8ia1o}
**The **green share** of the business activities of promotional and development banks increased from 17.0 % to 18.7 % between the end of 2023 and the end of 2024 and is thus still at a considerable level (see Figure 12).**{#par-i356e7}
{#par-u18728}
**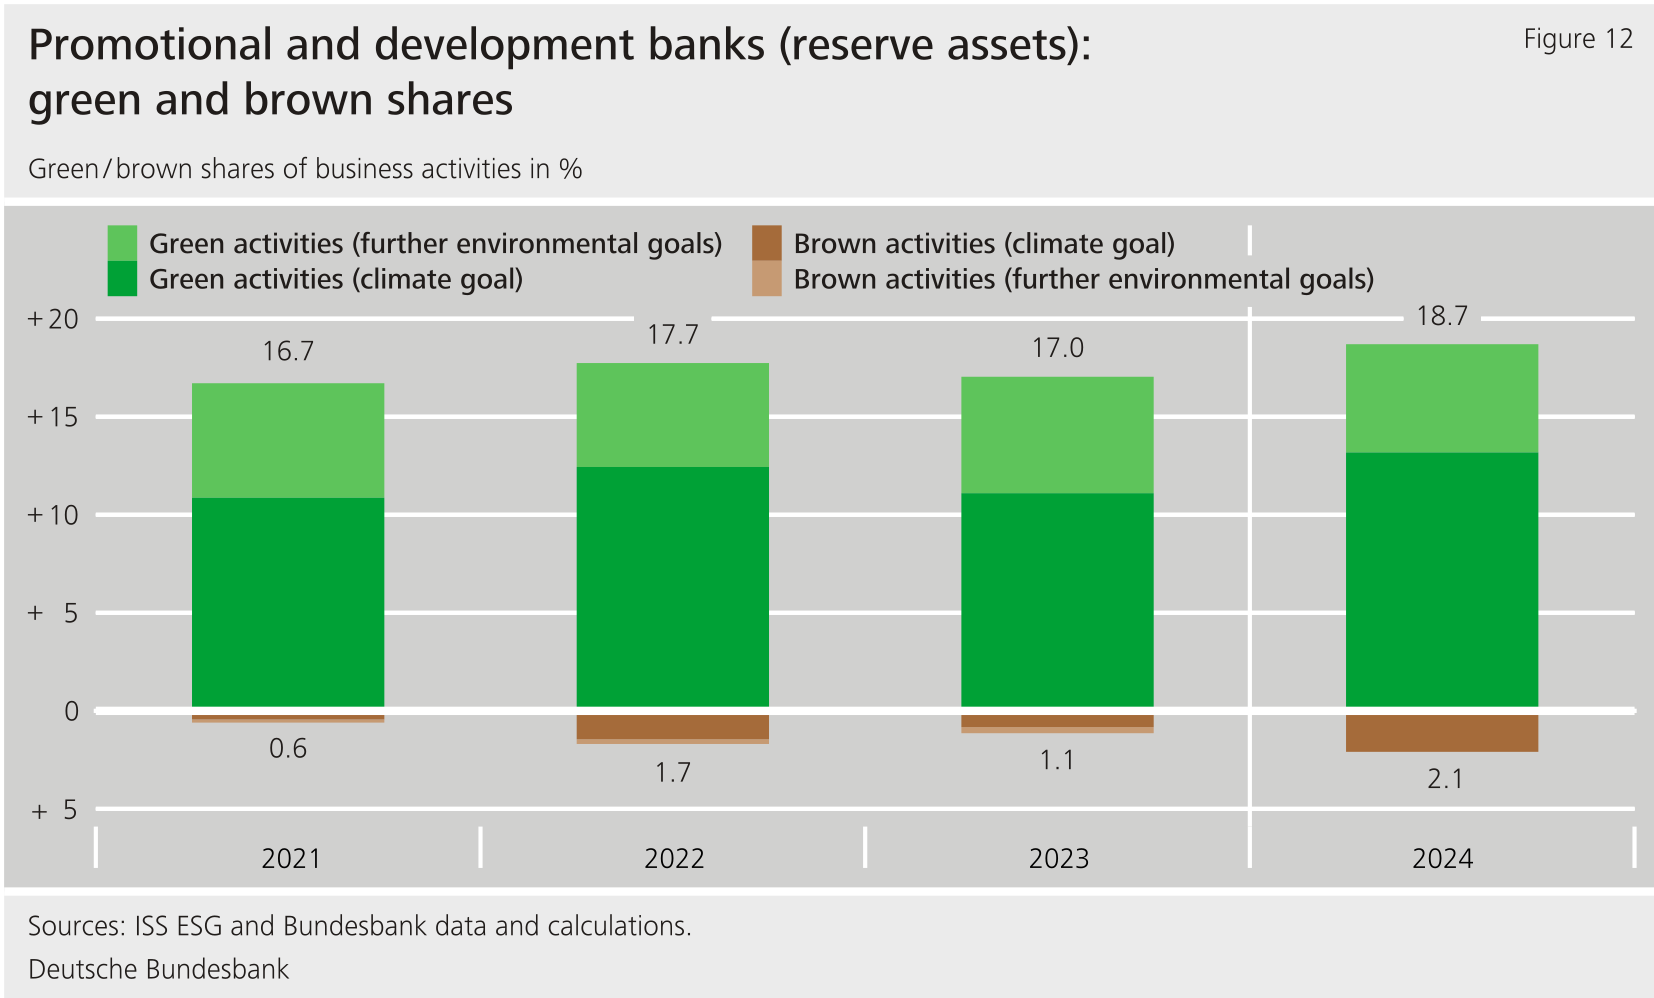**
**The bulk of the green share is made up of financing arrangements aimed primarily at achieving the climate goal within the meaning of the ("mitigating climate change"). In the interests of achieving this goal, promotional and development banks' business activities include, inter alia, the financing of renewable energy, energy efficiency measures and public transport infrastructure.**{#par-i42953}
**The remaining green share mainly belongs to the environmental goal of conserving water. The financing of water treatment facilities in particular accounts for a substantial share of business volumes at promotional and development banks. Smaller shares of financing activities are assigned primarily to biodiversity and nature-related environmental goals, such as projects to protect land and water-based ecosystems.**{#par-o2u485}
**The **brown share** remains at a low level, but has risen slightly on the year (from 1.1 % to 2.1 %). It relates to business activities that are at odds with the goal of mitigating climate change. This increase is primarily attributable to new financing from supranational development banks to expand the aviation sector in emerging market economies.**{#par-o1io14}
#### **5.2.1.3 Compliance with international standards and other sustainability aspects**
**In accordance with the sustainable investment strategy for the foreign currency reserves in the reserve assets, promotional and development banks are screened for compliance with minimum standards on an ongoing basis. The negative screening for breaches of international standards is grounded in norm-based assessment by the data provider . As at the reporting date of 31 December 2024, the reserve assets did not include any bonds issued by promotional and development banks for which had detected severe proven breaches of international standards. Nor did identify any involvement in controversial weapons. The bonds issued by promotional and development banks thus satisfy the minimum standards enshrined in the sustainable investment strategy.**{#par-o145i8}
**The sustainable investment strategy for bonds issued by promotional and development banks as part of the reserve assets does not include any targeted purchases of green bonds or comparable forms of bonds. Accordingly, green bonds accounted for only a small share of the investment volume as at 31 December 2024, at 3.2 %. The portfolio shares of bonds declared by promotional and development banks as social bonds, sustainability bonds and sustainability-linked bonds are higher. However, only in a few cases are they deemed to be in line with International Capital Markets Association () standards and verified by a second-party opinion (see Table 3).**{#par-a913ue}
{#par-e7o2u4}{#par-e76513}{#par-i9o62u}{#par-i677o4}{#par-ei1999}
|------------------------------------------------------|-----------|------------|--------------------|---------------------------|
| Table 3: Reserve assets: shares of green, social, sustainability and sustainability-linked bonds among holdings of bonds issued by promotional and development banks (by nominal value) |||||
| | **Green** | **Social** | **Sustainability** | **Sustainability-linked** |
| **All respective bonds as declared by bond issuers** | **3.2 %** | **7.1 %** | **45.0 %** | **4.8 %** |
| **Of which declared compliant with** **principles** | **3.2 %** | **0.2 %** | **30.3 %** | **0.0 %** |
| **Of which verified by second-party opinion** | **3.2 %** | **0.0 %** | **2.0 %** | **0.0 %** |
{#par-u8519o}
### **5.2.2 Sovereign investments** {#tar-7}
**Sovereign investments in the reserve assets consist mainly of government bonds, which therefore have a large impact on the climate metrics (see Table 4). Furthermore, they include deposits with the central banks of the relevant sovereigns[\[6\]](#_ftn_root_6) and bonds of sub-sovereigns (regions of a country, such as federal states). Since the pound sterling has been added to the Bundesbank's reserve assets in 2024, the investments have also included government bonds of the United Kingdom () and deposits with the Bank of England for the first time.**{#par-a2546u}
{#par-i179i2}{#par-e83778}{#par-ie7i61}{#par-ae8464}{#par-a56481}{#par-io3o7u}{#par-u6a711}{#par-ao1u37}{#par-e6ei8u}{#par-ou1u79}
|---|---|----------------|----------------|----------------|
| Table 4: Reserve assets: holdings of investments in sovereigns and sub-sovereigns |||||
| ||| **At the reporting date:** ||
| ||| **31.12.2023** | **31.12.2024** |
| **Portfolio holdings**{#par-i52o84} (by nominal value, €bn) || **Total** | **25.64** | **25.12** |
| **Portfolio holdings**{#par-i52o84} (by nominal value, €bn) || United States | 21.64 | 19.95 |
| **Portfolio holdings**{#par-i52o84} (by nominal value, €bn) || Canada | 1.55 | 1.49 |
| **Portfolio holdings**{#par-i52o84} (by nominal value, €bn) || Japan | 1.30 | 1.25 |
| **Portfolio holdings**{#par-i52o84} (by nominal value, €bn) || United Kingdom | 0.00 | 1.20 |
| **Portfolio holdings**{#par-i52o84} (by nominal value, €bn) || Australia | 0.88 | 0.94 |
| **Portfolio holdings**{#par-i52o84} (by nominal value, €bn) || China | 0.27 | 0.28 |
{#par-ie1eu8}
**Sub-sovereigns are treated as distinct entities in the calculation of most climate metrics (with the exception of total carbon emissions and carbon footprint). This means that the corresponding regional emissions and production volumes of fossil fuels are taken into account for sub-sovereigns and set in relation to regional adjusted by .**{#par-ui94ua}
**Compared with the investments examined above (euro portfolio; bonds issued by promotional and development banks in the reserve assets), the metrics do overlap to a degree in terms of their designations and purposes. For sovereigns and sub-sovereigns, though, the variables that feed into the [Annex](https://publikationen.bundesbank.de/content/959492) differ in some cases (e.g. adjusted by rather than by revenue). The following results are therefore only comparable with other investments in governments.**{#par-i852oi}
#### **5.2.2.1 metrics**
**Sovereign data have particularly [Annex](https://publikationen.bundesbank.de/content/959492). When this report was prepared, these data were mostly available up until 2022 and, in some cases, for 2023. For 2023 and 2024, the preliminary metrics are therefore largely based on data from previous years. metrics are calculated both with and without the [Annex](https://publikationen.bundesbank.de/content/959492) sector. As at 31 December 2024, the of investments in sovereigns amounted to 215 tonnes of CO~2~e/€mn of -adjusted (see Figure 13).**{#par-u741o9}
{#par-io8946}
**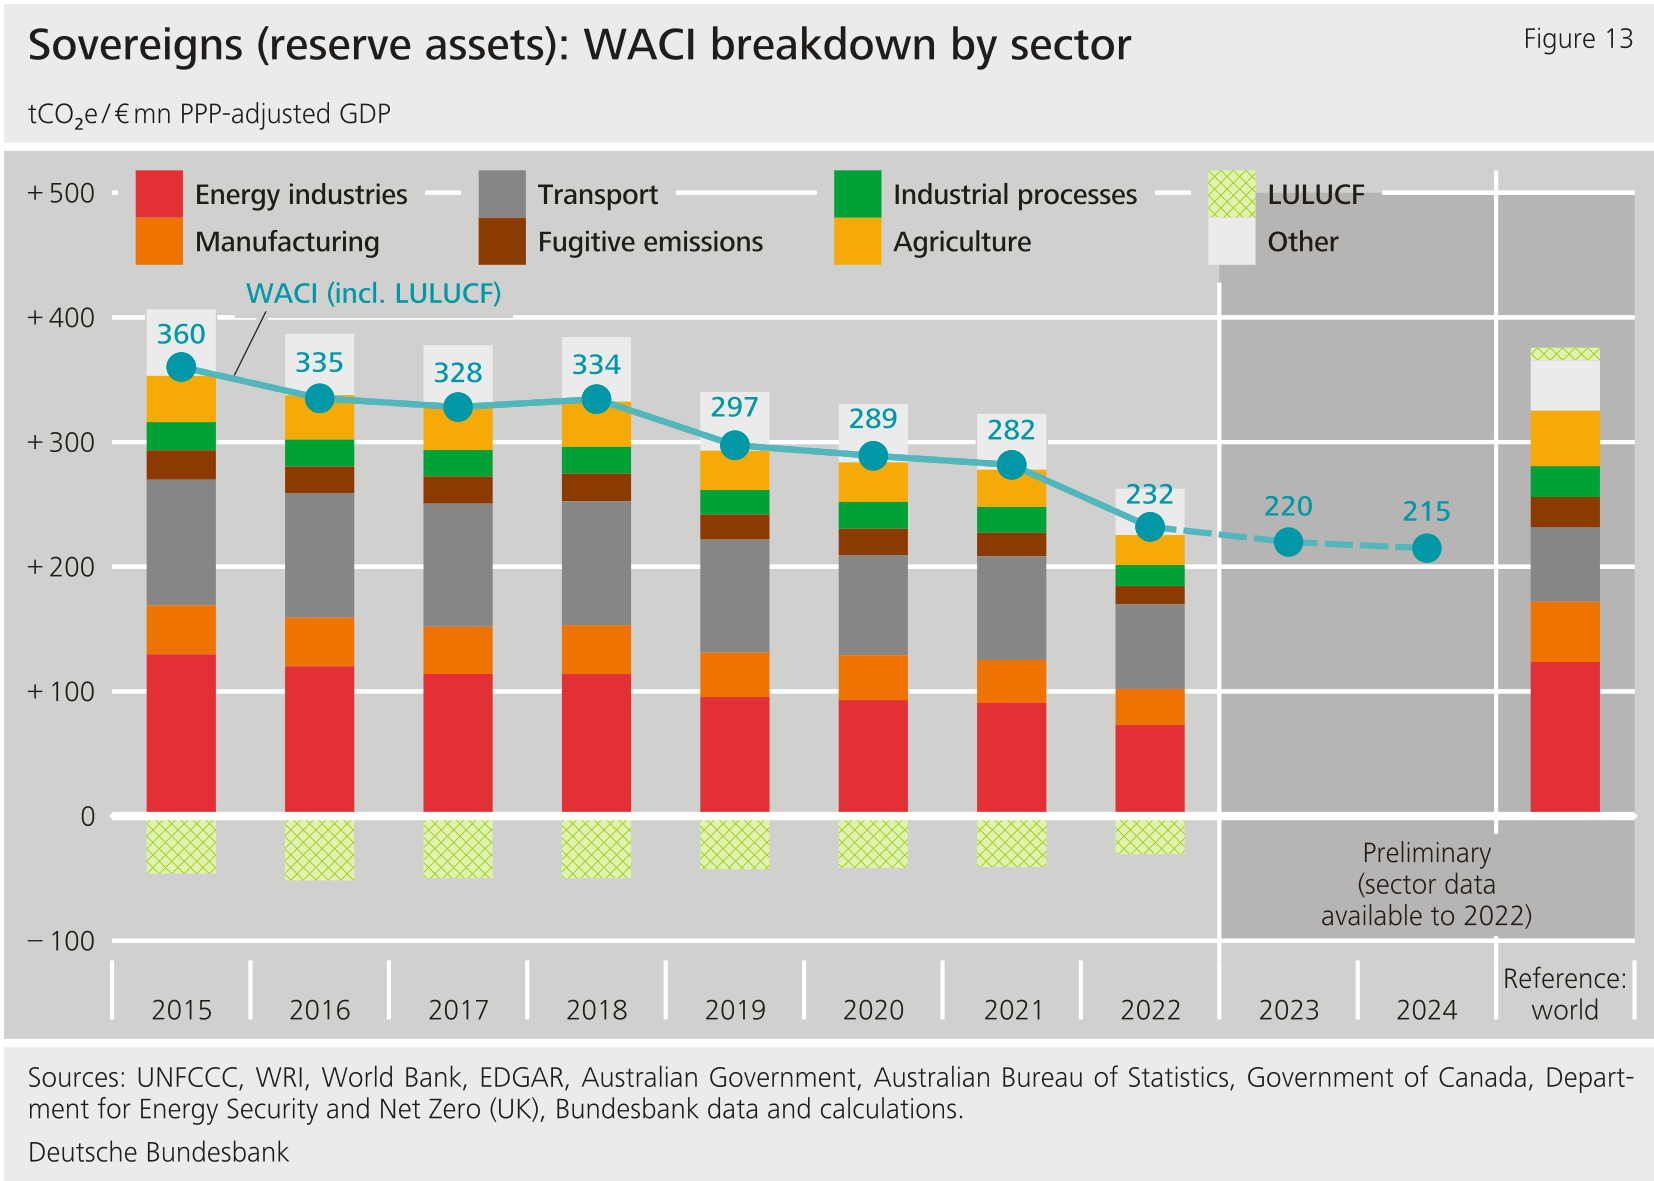**
**The calculations are based on the net sovereign emissions, taking into account . In the sovereigns whose bonds are held as reserve assets, usually capture or prevent larger volumes of than they emit, while the opposite is the case globally.**{#par-o26io2}
**Other reasons for the lower compared with the global intensity (based on data for 2022) are emissions from the energy industries sector (which mainly arise from the generation of electricity and heat) and agriculture. Relative to the size of the sovereigns' economies, these are smaller than the global average. By contrast, relative emissions from the transport sector are higher than the global average.**{#par-ai9u21}
**Since 2015 -- the year of the Paris Climate Summit -- the of the sovereign bond holdings has declined steadily over time. The reductions are particularly evident in the energy industries and transport sectors, although they continue to produce the highest emissions of all sectors. As signatories to the Paris Climate Agreement, Canada, Japan, Australia, China and the United Kingdom have pledged to achieve carbon neutrality in the long term. On 20 January 2025, the United States announced its withdrawal from the Paris Climate Agreement.**{#par-u1oui5}
**When interpreting the reduction in the so far, it should be borne in mind that the -- like other metrics -- may be biased downward by inflation. As a case in point, an inflation-driven increase in would bring about a reduction in the even though the emissions themselves remain unchanged. The distortionary effects examined below also affect other asset classes. With regard to sovereigns, however, they can be identified relatively clearly based on macroeconomic data.**{#par-e22986}
**The method used hitherto to calculate the sovereign uses adjusted by as a financial reference variable. only reflects relative changes in purchasing power between sovereigns, however. Calculating the using real adjusted by as well allows inflation in all the sovereigns under observation to be taken into consideration, too. 2015 is used as the base year for this purpose. If is adjusted for inflation for all subsequent years using this approach, the reduction up to 2024 comes to just 25.3 % in real terms rather than 40.3 % in nominal terms (see Figure 14). Much of the reduction could therefore be explained by inflation. From 2022 onwards, in particular, the sharp rise in inflation rates has led to a stronger divergence in the data.**{#par-u578iu}
{#par-e1425i}
**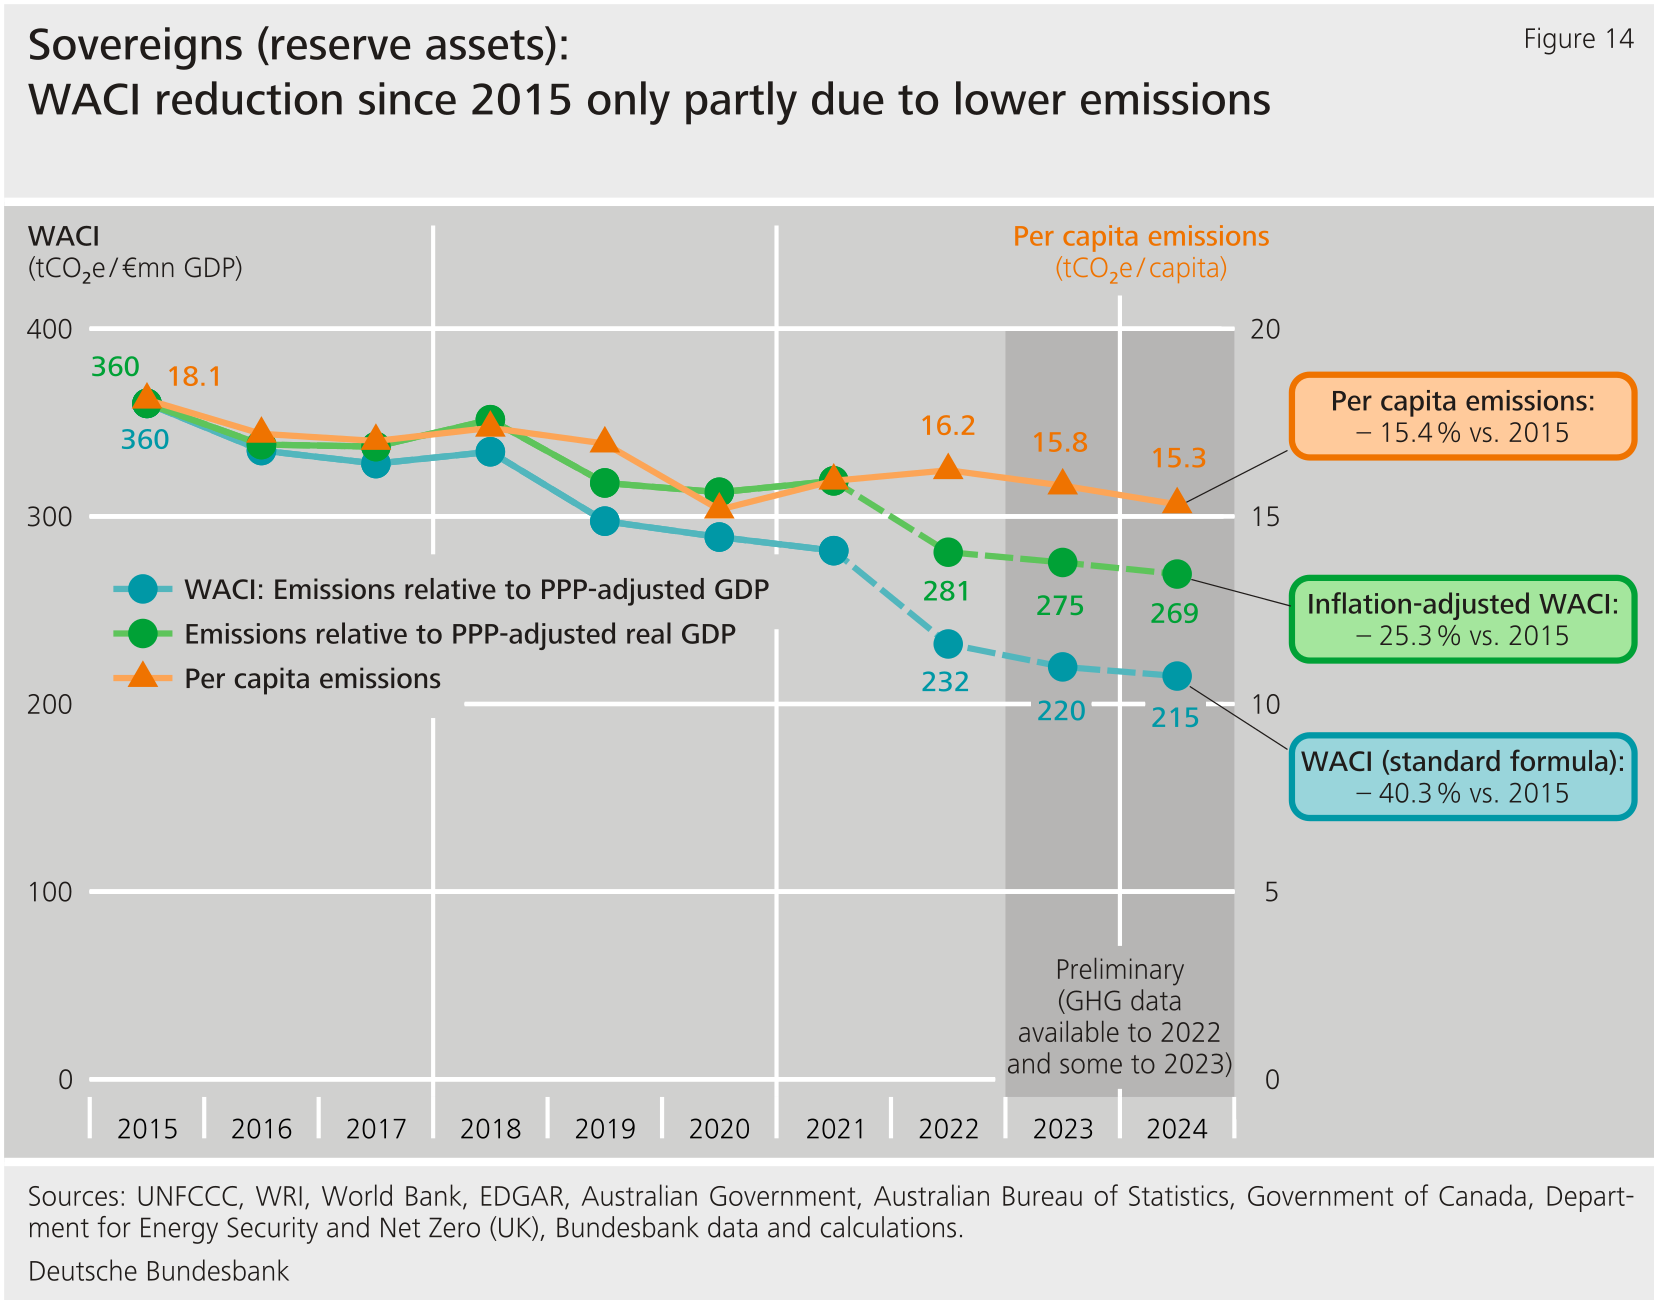**
**Per capita emissions allow emissions to be viewed from another angle. If the size of the population, rather than , is used as the reference variable, the reduction, at 15.4 % between 2015 and 2024, is significantly smaller still. Meanwhile, divergence has increased -- particularly since 2021. Per capita emissions are broadly stable compared with the , which indicates that the reduction in the in recent years is primarily attributable to nominal economic growth, but also to real economic growth. Looking at individual sovereigns, their emissions have indeed been stagnating for the most part since 2021.**{#par-i6uu89}
**By contrast, the declines in the and per capita emissions between 2023 and 2024 are clearly attributable to portfolio changes. With the exception of portfolio holdings, the metrics are still provisionally based on identical data. The small but visible declines in the metrics are mainly due to the inclusion of government bonds in the reserve assets and the reallocation of government bonds for this purpose.**{#par-iu2oo8}
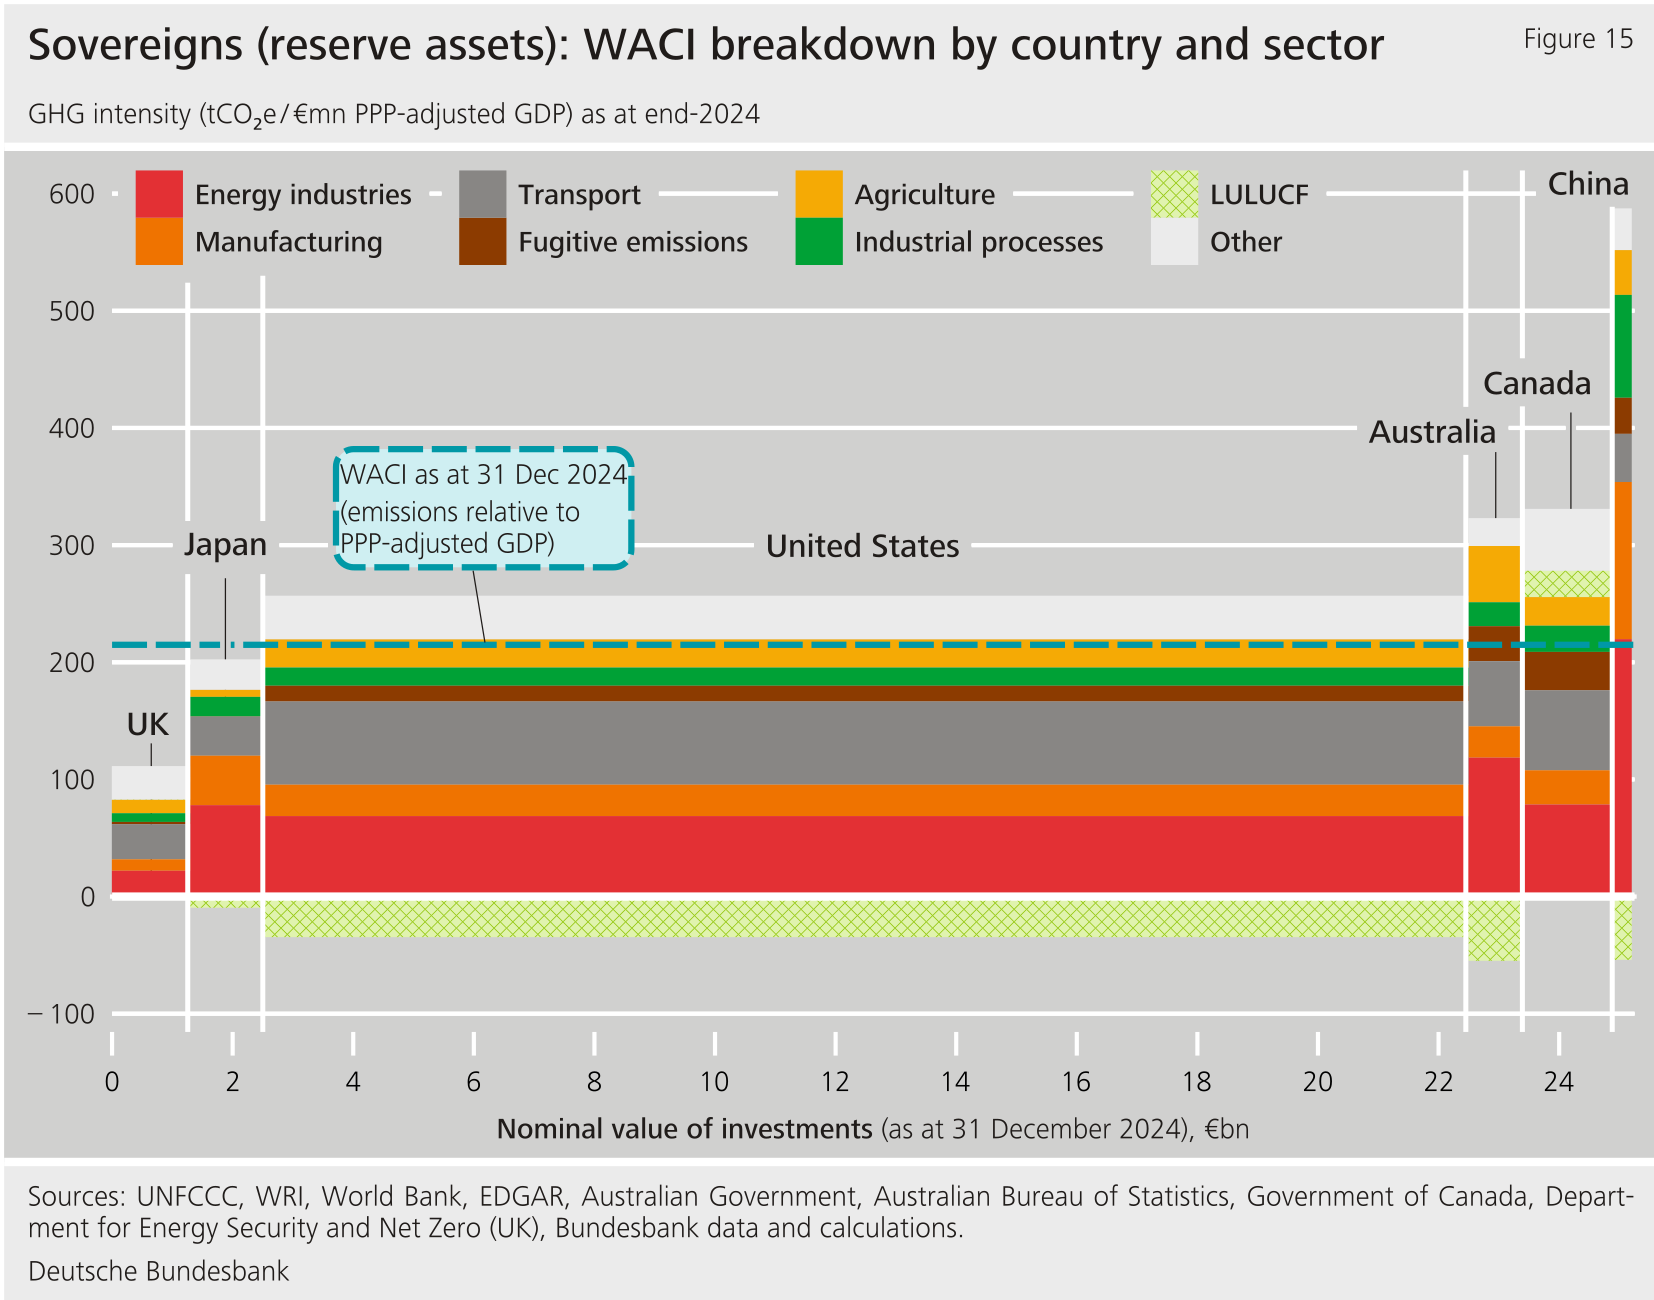
**The breakdown of the by country in Figure 15 shows that the 's intensity is well below the weighted average intensity (or, in other words, the ) of total investment in sovereigns. However, the is still dominated primarily by government bonds, which, with a nominal converted value of just under €20 billion, account for the vast majority of sovereign investments.**{#par-ie855i}
{#par-a879ii}
****
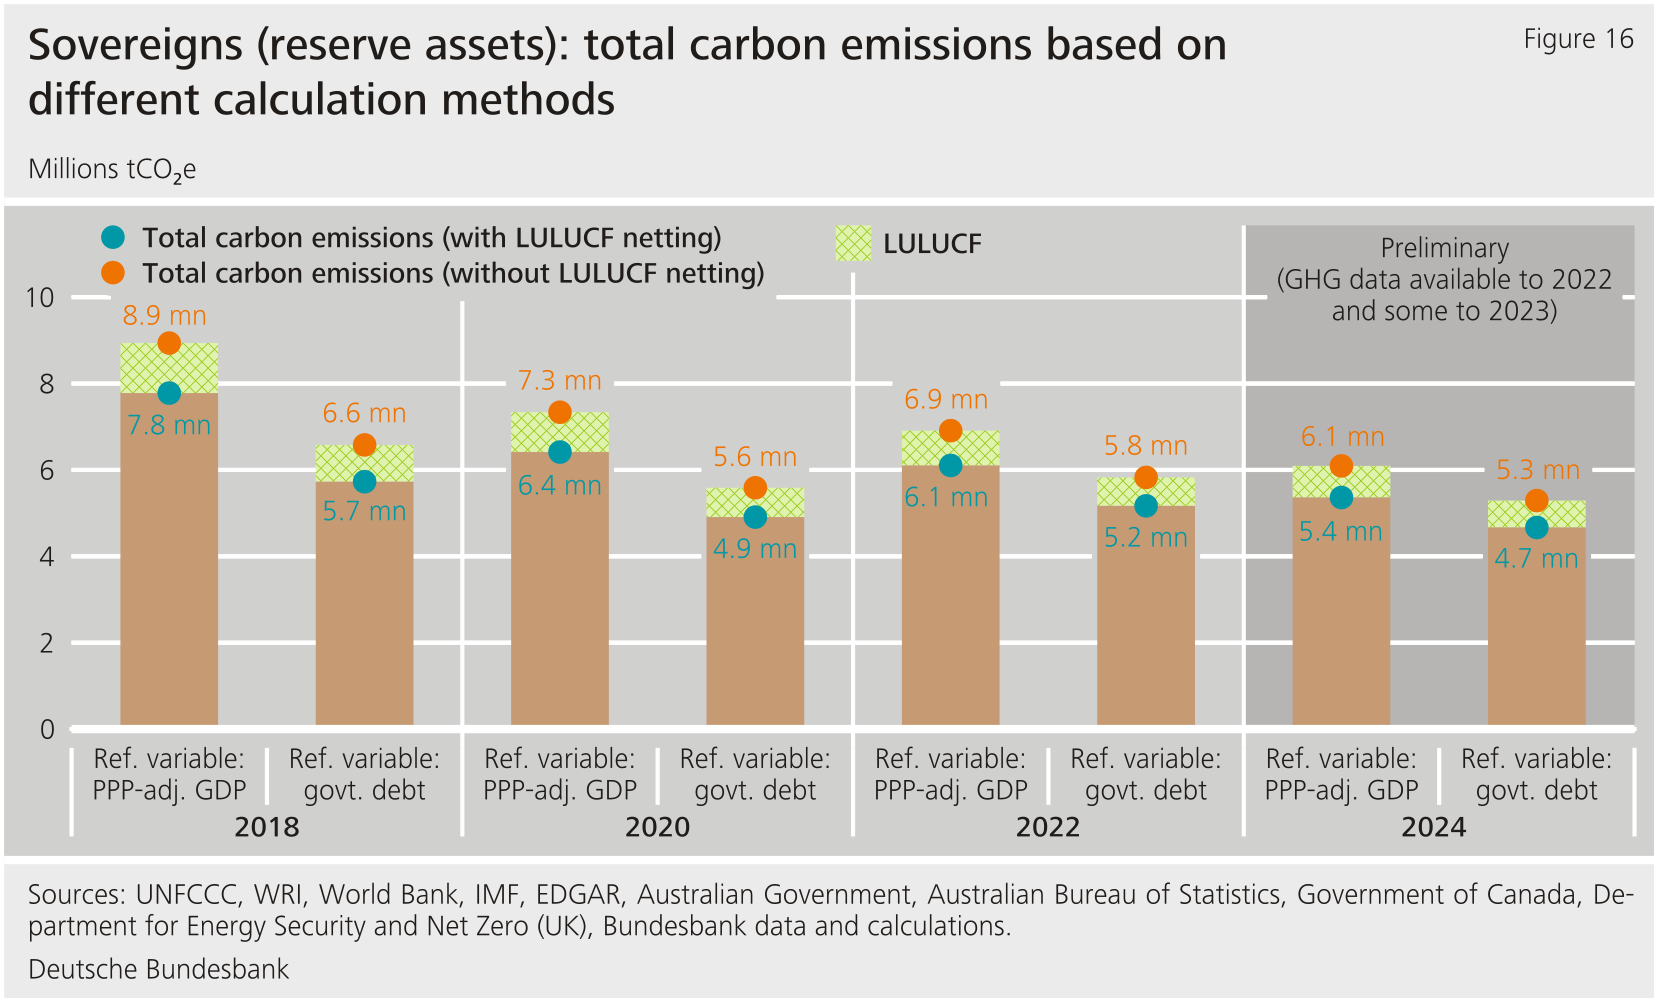
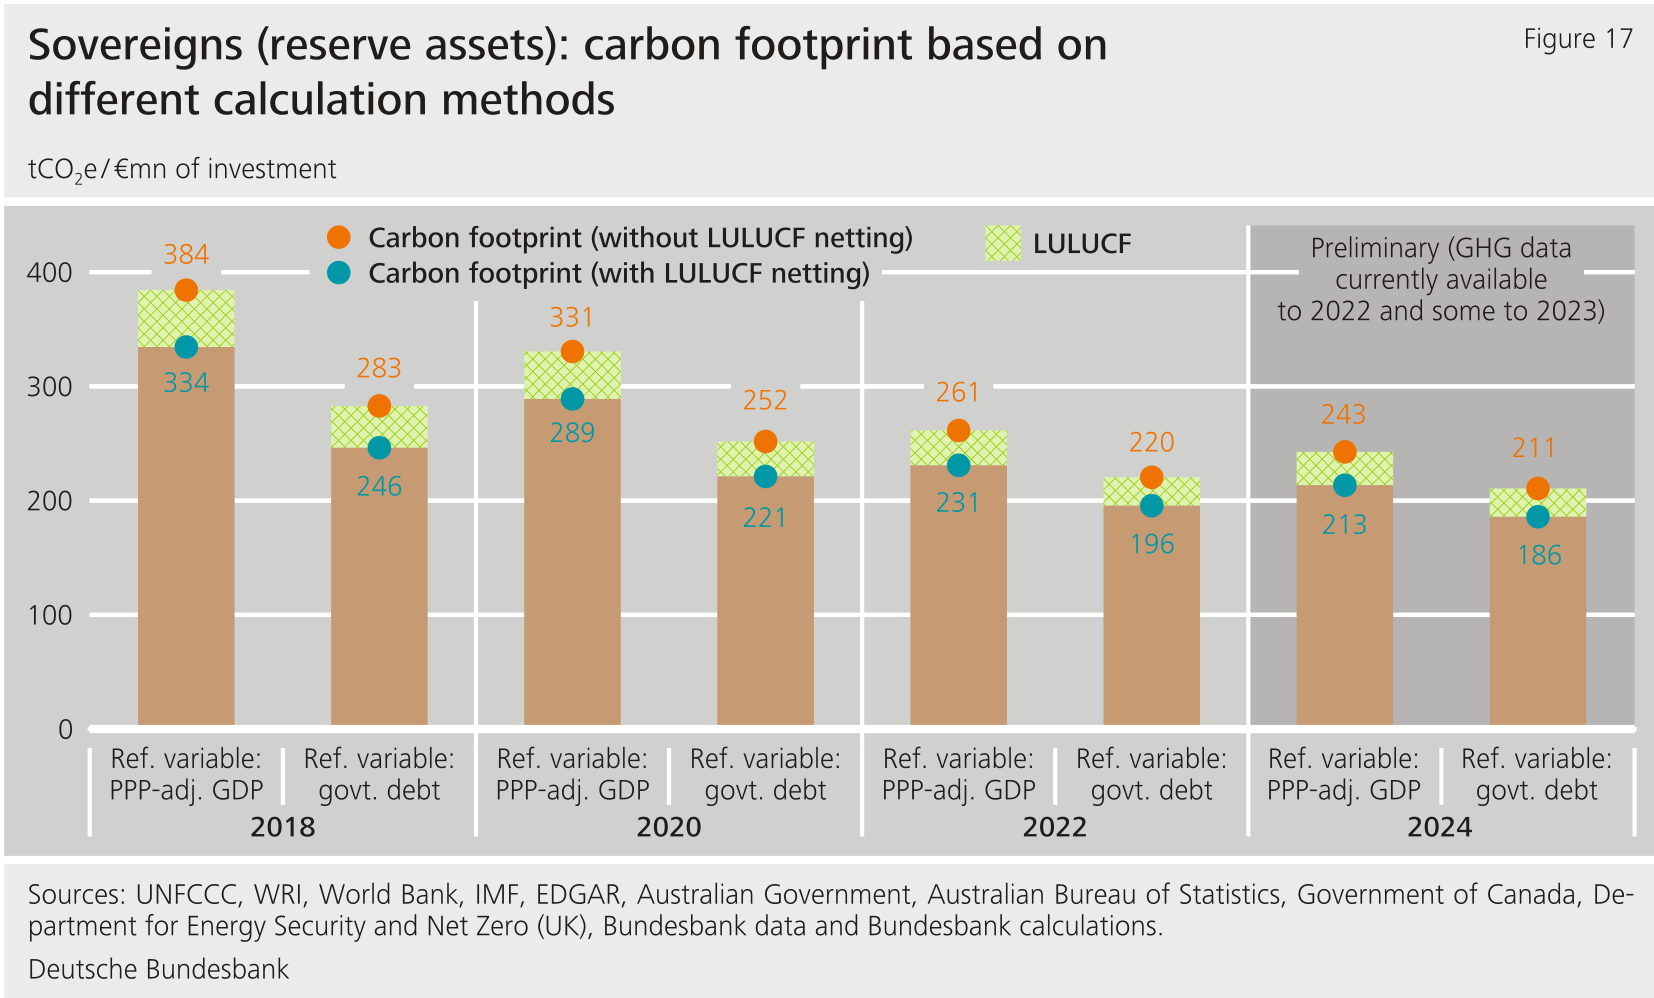
****Total carbon emissions** declined between 2018 and 2024 according to both [Annex](https://publikationen.bundesbank.de/content/959492), i.e. with both adjusted by and government debt being used as the reference variable (see Figure 16). The **carbon footprint** , which sets total carbon emissions in relation to the portfolio volume, looks very similar, given that the portfolio volume remained broadly stable in the 2018‑24 period (see Figure 17). Over the long term, -adjusted and government debt can be seen to converge (relatively speaking), meaning that the deviation between the calculation methods is shrinking in size.**{#par-o62o9o}
{#par-i6oa4i}
****
{#par-o11655}
****
#### **5.2.2.2 Production volumes of fossil fuels**
**By analysing production volumes of fossil fuels, it is possible to obtain additional insights into the climate performance of sovereign investments. For one thing, exports of fossil fuels by these sovereigns involve indirect emissions that are not included in the available data. For another, economic dependencies that coal, crude oil and natural gas-producing countries and regions might have on these economic sectors may give rise to financial risks.**{#par-o1ao89}
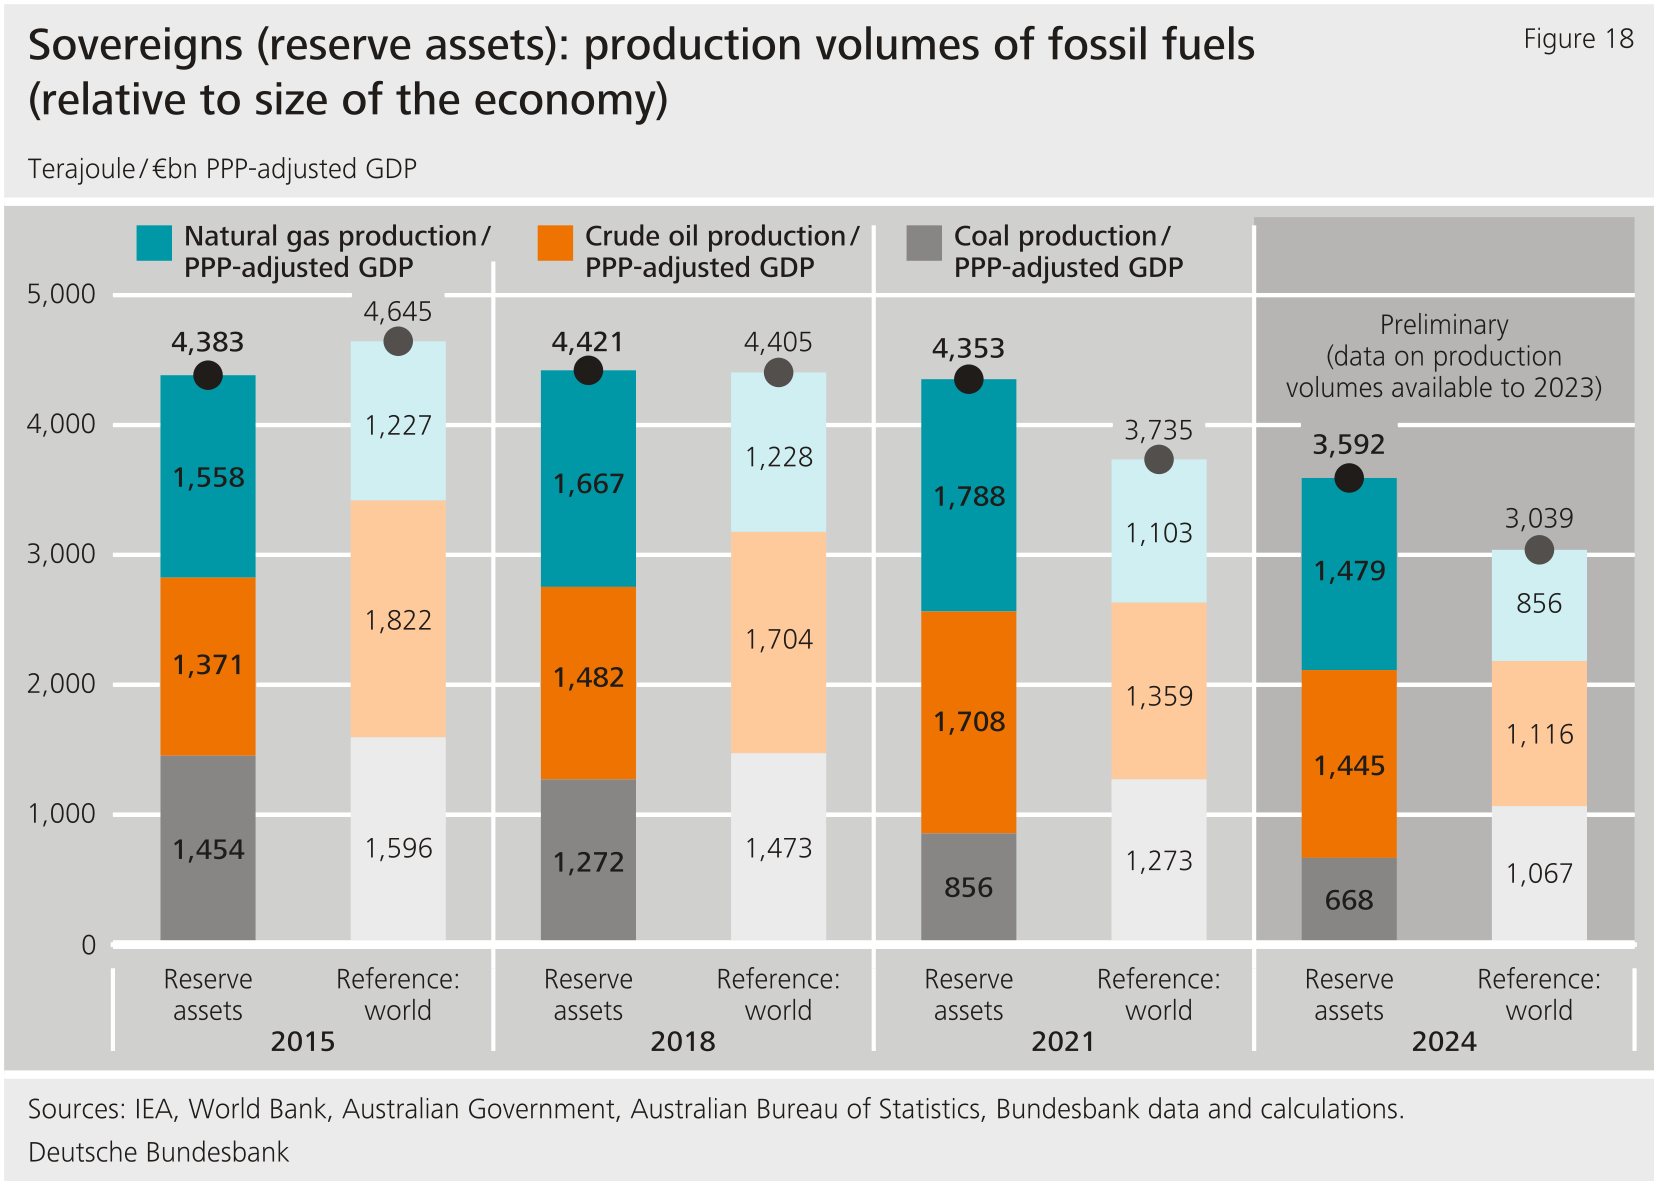
**In terms of sovereign bond holdings as at 31 December 2024, the [Annex](https://publikationen.bundesbank.de/content/959492) is significantly lower than the global average (see Figure 18). By contrast, both the **production volume of crude oil** and the **production volume of natural gas** relative to the size of the economy are higher than the global level. Looking at developments since 2015, the coal production volume has more than halved relative to the size of the economy. Compared with 2021, crude oil and natural gas production relative to the size of the economy has declined slightly, partly owing to the inclusion of government bonds in the reserve assets.**{#par-u7iu32}
{#par-u25a95}
****
#### **5.2.2.3 Further sustainability factors**
**The sustainable investment strategy for (sub-)sovereign investments as part of the reserve assets does not include targeted purchases of green bonds (or comparable forms of bonds). Accordingly, green bonds account for only a very small share of the investment volume as at 31 December 2024: Depending on the definition, they amount to between 0.09 % (compliance with principles verified by second-party opinion) and 0.57 % (bonds declared as green bonds by their issuers). Comparable forms of bonds such as social bonds are not among the (sub-)sovereign bonds held as part of the reserve assets.**{#par-e164i1}
**With regard to physical climate risks, the Bundesbank was in the process of renewing and expanding its data base at the time the report was drawn up. For the results available to date, please see Section 5.2.2.3 of [last year's climate-related disclosures](https://www.bundesbank.de/content/844900) for the time being, which contains the relevant metrics regarding sovereigns. The Bundesbank is planning to expand its analyses for future reports.**{#par-oe1u4a}
### **5.2.3 The Bundesbank's gold holdings** {#tar-8}
**A hypothetical approach is applied to the metrics shown below.[\[7\]](#_ftn_root_7) This assumes an amount of gold that is equal to the Bundesbank's gold holdings and was obtained according to the global mix of today's gold production. This exercise was based on study findings and financial market reports on the performance of gold production from the present day or recent past. In order to reflect the range of findings made in the literature on the profile of gold production, the following metrics are shown in intervals.**{#par-a4u39o}
**As at the reporting date of 31 December 2024, the Bundesbank's gold holdings amounted to 3,352 tonnes. For this amount of gold, the **absolute** **footprint** computed according to the hypothetical approach would amount to between 52.7 and 90.7mn tCO~2~e. Expressed relative to the market value of the gold holdings as at 31 December 2024 (€270.6bn), this would equate to a **carbon footprint** of between 195 and 335 tCO~2~e/€mn of investment. Distributed across the average holding period of the Bundesbank's gold (currently around 62 years), the annual carbon footprint would amount to around 3 to 5 tCO~2~e/€mn of investment.**{#par-u69oo9}
**Compared with the previous year, this "annualised" carbon footprint of gold holdings has declined significantly. This is, in small part, due to the lengthening holding period, but is mainly attributable to the considerable increase in the price of gold: the carbon footprint thus ascribes a higher degree of efficiency to the gold holdings in terms of their value as an asset. By contrast, the (hypothetical) amount of emissions, represented by the absolute footprint, is not influenced by movements in the price of gold.**{#par-ia4259}
**5.3 The Eurosystem's monetary policy holdings of corporate bonds and covered bonds** {#tar-9}
-----------------------------------------------------------------------------------------------
**The Bundesbank is reporting for the first time on the metrics of the Eurosystem's monetary policy holdings of covered bonds and corporate bonds. The income and risks arising from these holdings are shared among Eurosystem national central banks according to their weighted shares[\[8\]](#_ftn_root_8) in the 's capital (based on underlying capital keys). With regard to these holdings, the Eurosystem has therefore agreed that the breakdown of total carbon emissions by national central bank is also based on their capital keys.Relative metrics such as the and carbon footprint are reported independently of portfolio size, and are therefore identical for all Eurosystem central banks. They are calculated centrally by the for the Eurosystem.**{#par-o754ia}
**The following metrics were provided to the Bundesbank by the . They are also published in the [ECB's climate-related financial disclosures of Eurosystem assets held for monetary policy purposes and of the ECB's foreign reserves](https://www.ecb.europa.eu/ecb/climate/climate-related-financial-disclosures/html/index.en.html), along with other metrics on the Eurosystem's monetary policy holdings. The underlying data on scope 1, 2 and 3 emissions are either self-reported by issuers or modelled by the data providers, with self-reported emissions preferred whenever available. With regard to scope 3, the total carbon emissions based on the most recent data are reported in the main text of this report. Scope 3 metrics for previous years are reported in Annex IV as their reliability and comparability over time are affected by data quality issues. These issues include considerable estimation uncertainty, diverging estimates across different data providers and methodological refinements over time. Despite these shortcomings, the Eurosystem decided to start reporting scope 3 total carbon emissions in the main text of the report as of 2025 and notes a steady expansion of issuers' reporting of types of activities, which will enhance comparability over time.**{#par-i1664a}
### **5.3.1 The Eurosystem's monetary policy holdings of covered bonds** {#tar-10}
**The Eurosystem holds covered bonds under the (third covered bond purchase programme) and (pandemic Emergency Purchase Programme) for monetary policy purposes. Measured in terms of nominal value, the Eurosystem's holdings of such bonds peaked in 2022 and have been declining ever since (see Table 5), standing at €258.6 billion at the end of 2024. According to the Bundesbank's capital key, 26.63 % of the emissions associated with these holdings can be attributed to the Bundesbank.**{#par-i7a94e}
{#par-uuu6ae}{#par-u46i41}{#par-eo5798}{#par-u57ai2}{#par-i88741}{#par-e314o8}{#par-e3u1ai}{#par-ueu845}{#par-i2e35u}{#par-aueu16}{#par-iueiu7}
|---|---|------------------|-------------------|-------------------|-------------------|-------------------|-------------------------|
| Table 5: Covered bonds in monetary policy and portfolios ||||||||
| ||| **Portfolio as at:** |||||
| ||| **31.12.2020** | **31.12.2021** | **31.12.2022** | **31.12.2023** | **31.12.2024** |
| **Eurosystem holdings** (by nominal value, €bn) ||| **285.1** | **299.3** | **305.6** | **290.8** | **258.6** |
| **Bundesbank's capital key** ||| **26.36 %** | **26.36 %** | **26.36 %** | **26.15 %** | **26.63 %** |
| **of Bundesbank share** (in tCO~2~e/€mn of gross income) || **Scope 1 \& 2** | **2.6** (86 %) | **2.0** (92 %) | **1.4** (94 %) | **0.9** (93 %) | **0.9** (96 %) |
| **of Bundesbank share** (in tCO~2~e/€mn of gross income) || **Scope 3** | See Annex IV -- Table 7 |||||
| **Total carbon emissions of Bundesbank share** (in tCO~2~e) || **Scope 1 \& 2** | **26,611** (83 %) | **22,129** (88 %) | **17,753** (89 %) | **14,533** (90 %) | **12,324** (93 %) |
| **Total carbon emissions of Bundesbank share** (in tCO~2~e) || **Scope 3** | See Annex IV -- Table 7 |||| **23.7 million** (93 %) |
| **Carbon footprint of Bundesbank share** (in tCO~2~e/€mn of investment) || **Scope 1 \& 2** | **0.4** (83 %) | **0.3** (88 %) | **0.2** (89 %) | **0.2** (90 %) | **0.2** (93 %) |
| **Carbon footprint of Bundesbank share** (in tCO~2~e/€mn of investment) || **Scope 3** | See Annex IV -- Table 7 |||||
{#par-ia338e}
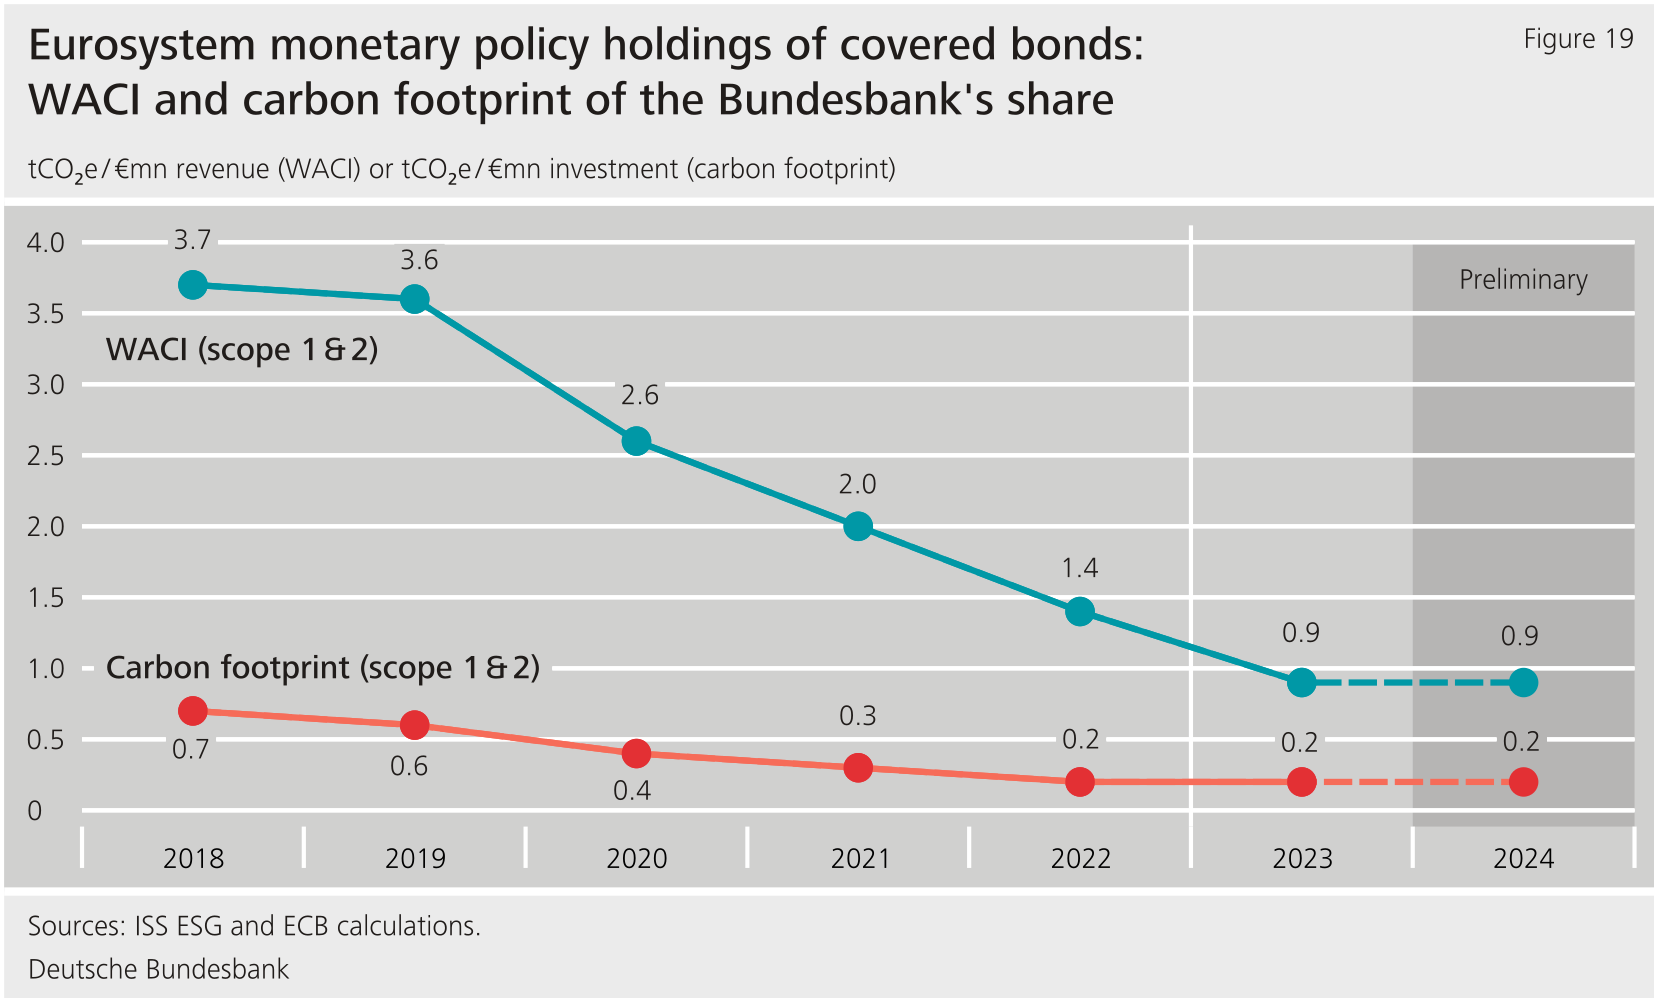
**Figure 19 illustrates that the and the carbon footprint for scopes 1 and 2 trend significantly downwards over the long term. At the same time, the total carbon emissions show that scope 3 represents almost the entirety of emissions of the covered bond holdings in 2024 (see Table 5).**{#par-o18u1o}
{#par-a47i7o}
****
### **5.3.2 The Eurosystem's monetary policy holdings of corporate bonds** {#tar-11}
**Corporate bonds held by the Eurosystem for monetary policy purposes were purchased under the corporate sector purchase programme () and the pandemic emergency purchase programme (). They were generally issued by firms in real economic sectors.**{#par-ueio48}
**As with covered bonds, the Eurosystem's monetary policy holdings of corporate bonds have also declined since 2022 (see Table 6), amounting to €331.4 billion at end-2024. According to the capital key, 26.63 % of this figure is considered to be the Bundesbank's share below. Applied to the total carbon emissions () volume, this means that 8.7 million tCO~2~e of scope 1 and 2 emissions and 65.3 million tCO~2~e of scope 3 emissions can be attributed to the Bundesbank. Therefore, the profile of the corporate bond holdings (and that of the issuing corporations) is largely shaped by scope 3 emissions, albeit to a lesser degree than that of the covered bond holdings.**{#par-e52187}
{#par-o571oa}{#par-e8o894}{#par-a9397o}{#par-a561e9}{#par-o525i4}{#par-e2e3ai}{#par-e4eu1e}{#par-aa62oa}{#par-i55iou}{#par-o8oe2u}{#par-i953eo}
|---|---|------------------|-------------------------|-------------------------|-------------------------|-------------------------|-------------------------|
| Table 6: Corporate bonds in monetary policy and portfolios ||||||||
| ||| **Portfolio as at:** |||||
| ||| **31.12.2020** | **31.12.2021** | **31.12.2022** | **31.12.2023** | **31.12.2024** |
| **Eurosystem holdings** (by nominal value, €bn) ||| **287.5** | **345.5** | **385.2** | **367.2** | **331.4** |
| **Bundesbank's capital key** ||| **26.36 %** | **26.36 %** | **26.36 %** | **26.15 %** | **26.63 %** |
| **of Bundesbank share** (in tCO~2~e/€mn of gross income) || **Scope 1 \& 2** | **289** (96 %) | **266** (96 %) | **184** (96 %) | **167** (96 %) | **165** (93 %) |
| **of Bundesbank share** (in tCO~2~e/€mn of gross income) || **Scope 3** | See Annex IV -- Table 8 |||||
| **Total carbon emissions of Bundesbank share** (in tCO~2~e) || **Scope 1 \& 2** | **12.5 million** (96 %) | **14.6 million** (95 %) | **14.8 million** (96 %) | **10.6 million** (96 %) | **8.7 million** (92 %) |
| **Total carbon emissions of Bundesbank share** (in tCO~2~e) || **Scope 3** | See Annex IV -- Table 8 |||| **65.3 million** (92 %) |
| **Carbon footprint of Bundesbank share** (in tCO~2~e/€mn of investment) || **Scope 1 \& 2** | **172** (96 %) | **168** (95 %) | **152** (96 %) | **116** (96 %) | **108** (92 %) |
| **Carbon footprint of Bundesbank share** (in tCO~2~e/€mn of investment) || **Scope 3** | See Annex IV -- Table 8 |||||
{#par-e4ei3a}
**The most recent available data pertain to 2023. In this year, the relative metrics and carbon footprint, which are identical for all Eurosystem central banks, show a downward trend in terms of scope 1 and 2 emissions (see Figure 20). With regard to , the declines are largely due to reduced intensities at the corporation level, and partly due to portfolio shifts between 2021 and 2024. However, nominal revenue increases caused by inflation could also contribute to the former.[\[9\]](#_ftn_root_9)**{#par-iie313}
{#par-o863o8}
**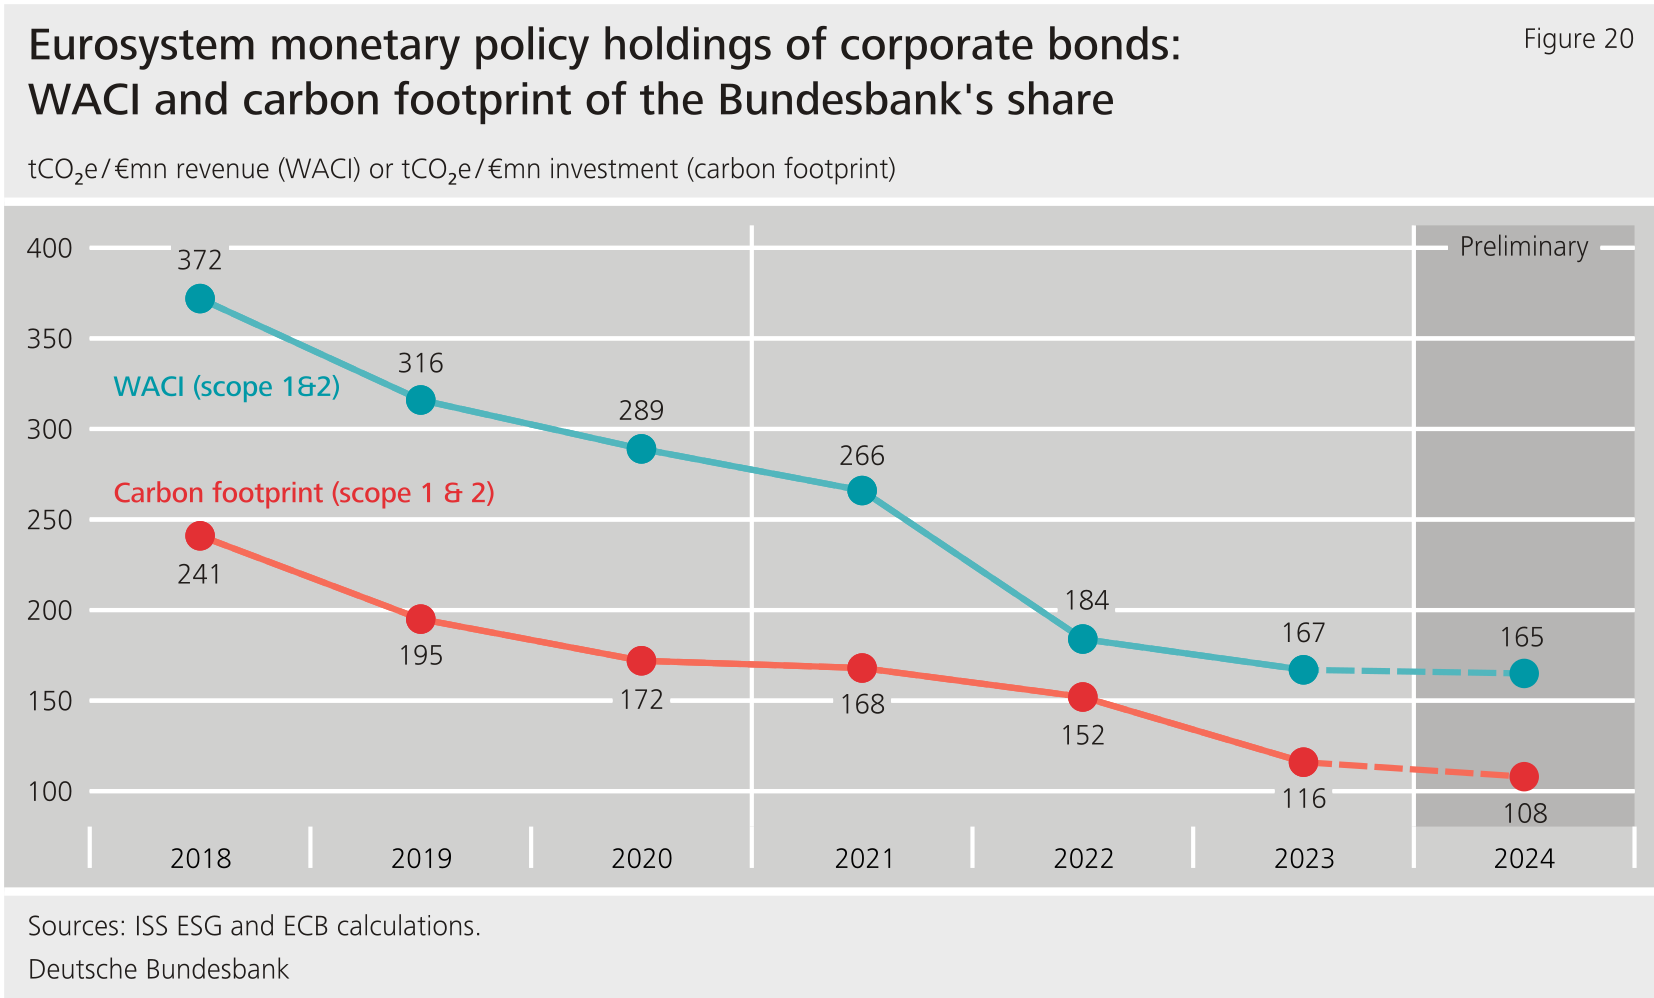
Figure 20**
**These and other findings and metrics on Eurosystem monetary policy holdings are presented in the [ECB's climate-related financial disclosures of Eurosystem assets held for monetary policy purposes and of the ECB's foreign reserves](https://www.ecb.europa.eu/ecb/climate/climate-related-financial-disclosures/html/index.en.html), which provide the source of the metrics listed above.**{#par-aa5717}
1. **{#_ftn_root_1} Bundesbank calculation based on the composition of the STOXX Europe 600 Banks index as at 12 March 2025 and data from .**
2. **{#_ftn_root_2} Nearly all banks disclosing such data put their financed scope 3 emissions at more than 99 % of their total scope 1, 2 and 3 emissions \[see Deutsche Bundesbank (2024b). [Climate-related disclosures by the Deutsche Bundesbank 2024](https://www.bundesbank.de/resource/blob/844900/7d5fc06ce856b79af8fc6176e4edf079/472B63F073F071307366337C94F8C870/2024-klimabericht-data.pdf), box 1 on page 34\].**
3. **{#_ftn_root_3} To avoid multiple counting, the Bundesbank counts business activities that assigns to multiple environmental goals only once for the green or brown share.**
4. **{#_ftn_root_4} Bundesbank calculation based on the composition of the STOXX Europe 600 Banks index as at 12 March 2025 and data from .**
5. **{#_ftn_root_5} See [Section 7.1.2 Green and brown shares of business activities](#7.1.2-Green-and-brown-shares-of-business-activities) for explanations of the calculation methods.**
6. **{#_ftn_root_6} To calculate and climate metrics, deposits with central banks are treated like, and added to, sovereign bonds. As a result, data on sovereigns are applied to both.**
7. **{#_ftn_root_7} See Deutsche Bundesbank (2024a), section 5.2.3, the calculation factors and sources were described in greater detail and a general sustainability assessment of gold as an asset class was carried out.**
8. **{#_ftn_root_8} Shares in the 's capital are distributed among the central banks. Of this, only the Eurosystem central banks are involved in the income and risks from the monetary policy holdings considered in this section whose capital shares are "adjusted" for this purpose.**
9. **{#_ftn_root_9} See Section 5.2.2.1, which examines inflation-related effects on sovereigns' intensities.**
*[IMF]: International Monetary Fund
*[ECB]: European Central Bank
*[GHG]: Greenhouse Gas
*[ISS]: Institutional Shareholder Services
*[TCFD]: Task Force on Climate-Related Financial Disclosures
*[ICMA]: International Capital Market Association
*[BIS]: Bank for International Settlements
*[ESCB]: European System of Central Banks
*[CSPP]: corporate sector purchase programme
*[**WACI**]: Weighted Average Carbon Intensity
*[PEPP]: pandemic emergency purchase programme
*[PPP]: public-private partnership
*[**ICMA**]: International Capital Market Association
*[GDP]: gross domestic product
*[LULUCF]: Land Use, Land-Use Change and Forestry
*[UK]: United Kingdom
*[WACI]: Weighted Average Carbon Intensity
*[ESG]: Environmental, Social and Governance
*[UN]: United Nations
*[SDGs]: Sustainable Development Goals
*[CBPP3]: third covered bond purchase programme
*[PCAF]: Partnership for Carbon Accounting Financials
*[**GHG**]: Greenhouse Gas
*[US]: United States