# Global and European setting
* [*1 Global economy buffeted by tariff storm*](#tar-1 "1 Global economy buffeted by tariff storm")
* *[*The macroeconomic effects of heightened uncertainty*](#tar-2 "The macroeconomic effects of heightened uncertainty")*
* **[*The potential impact of the current trade dispute between the United States and China*](#tar-3 "The potential impact of the current trade dispute between the United States and China")**
* ***[*2 Temporary growth acceleration in the euro area*](#tar-4 "2 Temporary growth acceleration in the euro area")***
* ***[*Use of artificial intelligence -- a European comparison*](#tar-5 "Use of artificial intelligence – a European comparison")***
* ***[*Bibliography*](#tar-6 "Bibliography")***
***1 Global economy buffeted by tariff storm*** {#tar-1}
--------------------------------------------------------
*****The global economy was still in robust shape at the start of 2025.** Front-loading effects resulting from expectations of further tariffs appeared to have temporarily stimulated global trade and industrial production. A number of European economies also increased their exports to the United States quite substantially. This likely contributed to the noticeable increase in economic output in the euro area in the last quarter. In China, the growth rate remained solid for the time being. In the United States, while real gross domestic product () did decrease slightly against a backdrop of a sharp upturn in imports, other indicators do not yet point to any significant deterioration of the economy in the first quarter of the year.***{#par-e4i4e8}
{#par-i8oi7o}
***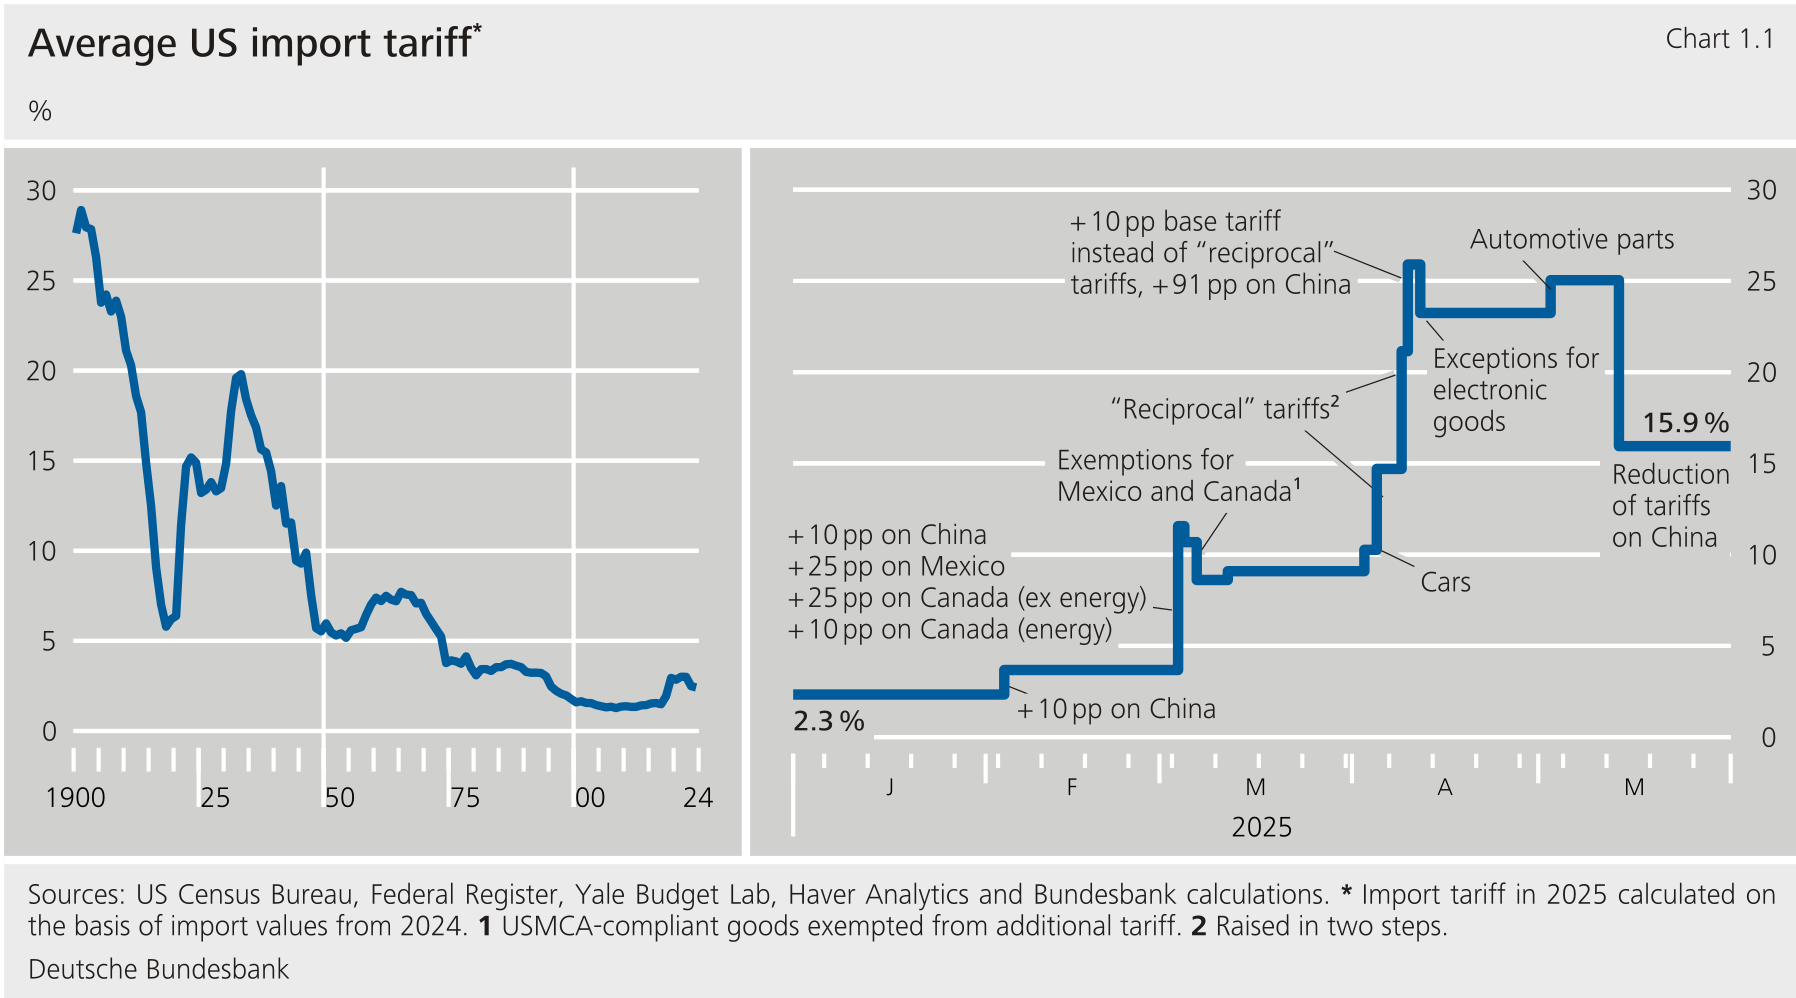***
*****From the first quarter onwards, the protectionist nature of** **trade policy is likely to weigh increasingly on the global economy.** Uncertainty over trade policy had already risen significantly in the aftermath of the election of the new president. At the start of 2025, the new administration then began to impose the first additional tariffs on imports from various countries. Further tariff increases followed. Ever since April, the United States has imposed an additional tariff of at least 10 % on virtually all its trade partners. Even higher tariffs apply to specific sectors -- such as for imports of steel and aluminium, as well as cars and automotive parts. Trade partners resorted to retaliatory measures in some cases. Some of the tariff increases were then scaled back. In trade between the United States and China, reciprocal tariff rates temporarily shot up to prohibitive levels after multiple rounds of escalation, before both countries then agreed on a temporary "ceasefire". As things stand, the average effective tariff rate of the United States for all trade partners is more than 13 percentage points higher than at the start of the year, which puts it at its highest level since the 1930s. Many trade partners of the United States might face further tariff increases from July onwards if negotiations on a reshaping of bilateral trade relations fail.[\[1\]](#_ftn_root_1) It is already apparent that the new tariffs and the ongoing trade policy uncertainty are proving an increasing drag on the global economy (see the supplementary information entitled "[The macroeconomic effects of heightened uncertainty](#The-macroeconomic-effects-of-heightened-uncertainty)"). According to company surveys, business expectations in the manufacturing sector have deteriorated noticeably over the last few months, whereas the appraisal of the current situation remains solid. One fear is that exports in particular could suffer from weaker demand going forward. In the services sector too, sentiment has clearly deteriorated.***{#par-i1878u}
{#par-eouoi8}
**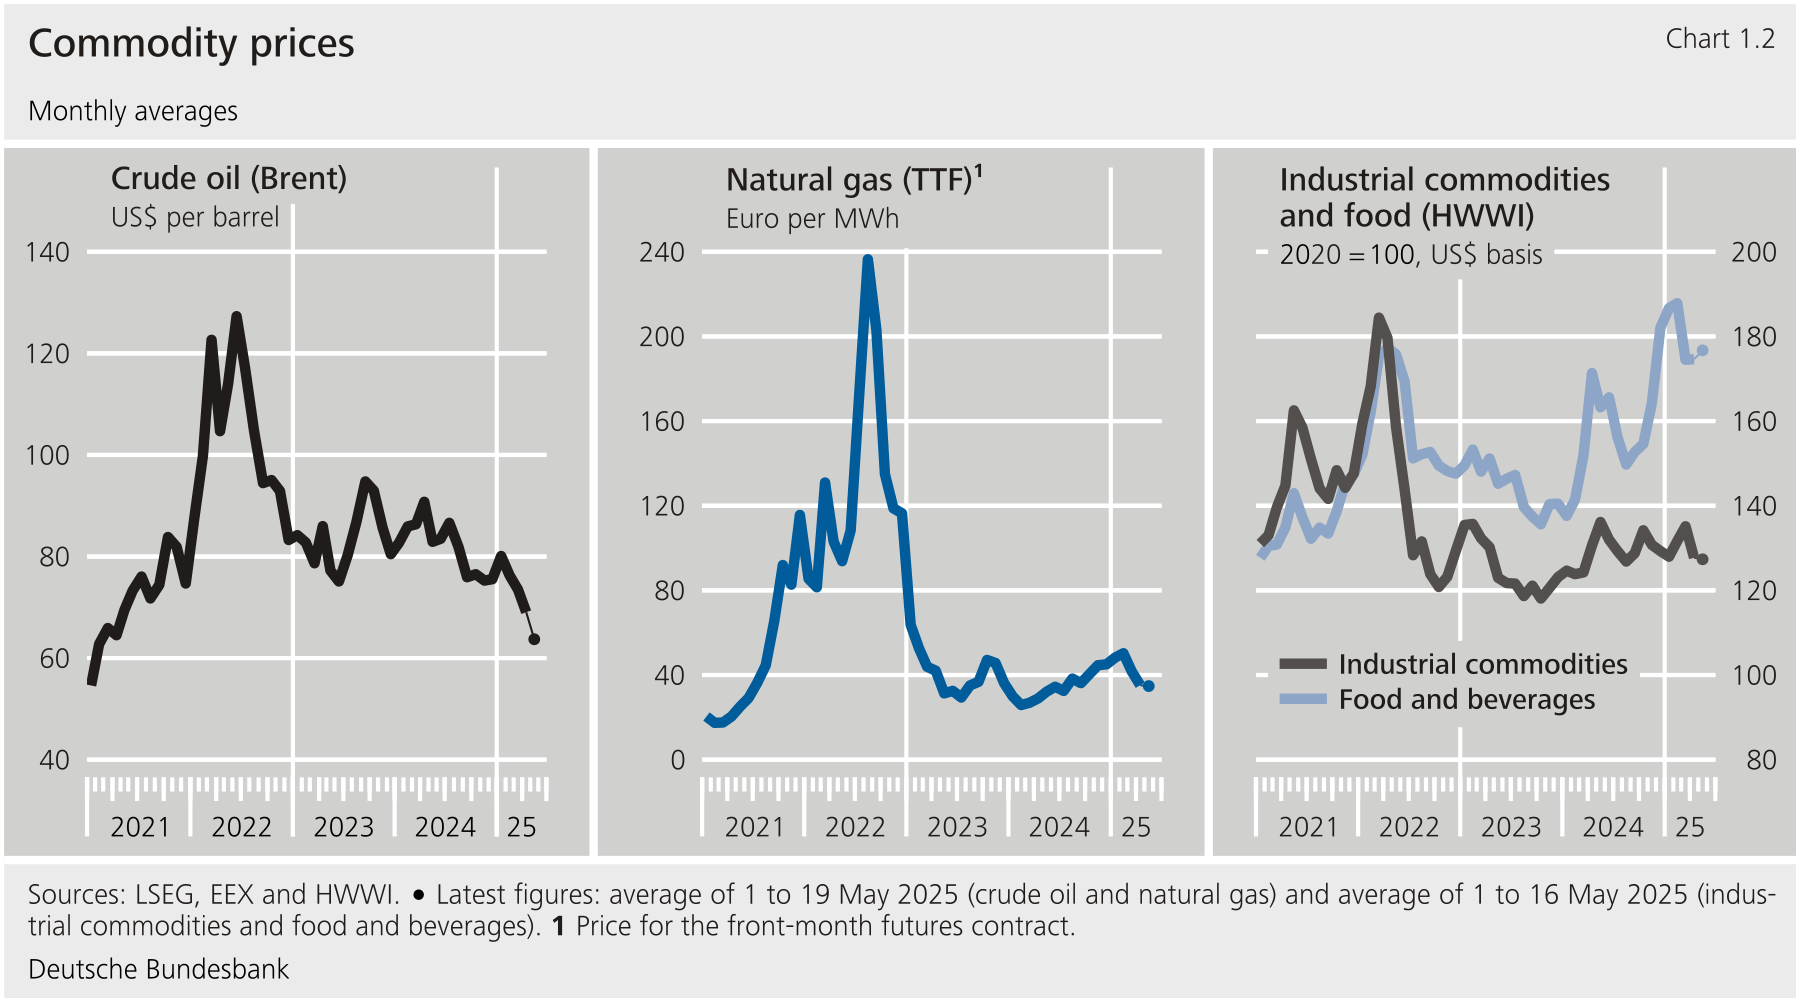**
****With the outlook for demand deteriorating, commodity prices recorded a broad-based decline** . This was particularly true of energy commodity prices: At the time of publication, a barrel of Brent crude was trading at $66, some 20 % lower than as recently as February. In addition to the gloomier global economic outlook, this was also driven by the decision of some states to ramp up oil production significantly. Even before the announcement of this expansion of production, the International Energy Agency had predicted that the global oil market would be clearly oversupplied in 2025 and 2026.[\[2\]](#_ftn_root_2) European gas prices likewise fell sharply and, at €35 per megawatt hour, are now back below the level they were at just a year ago. Recent weakness in Chinese demand for liquefied natural gas and the 's plans to loosen gas storage requirements also increased the downward pressure on energy prices.[\[3\]](#_ftn_root_3) The prices of industrial and food commodities likewise weakened slightly.**{#par-ie7981}
{#par-ooaeiu}
**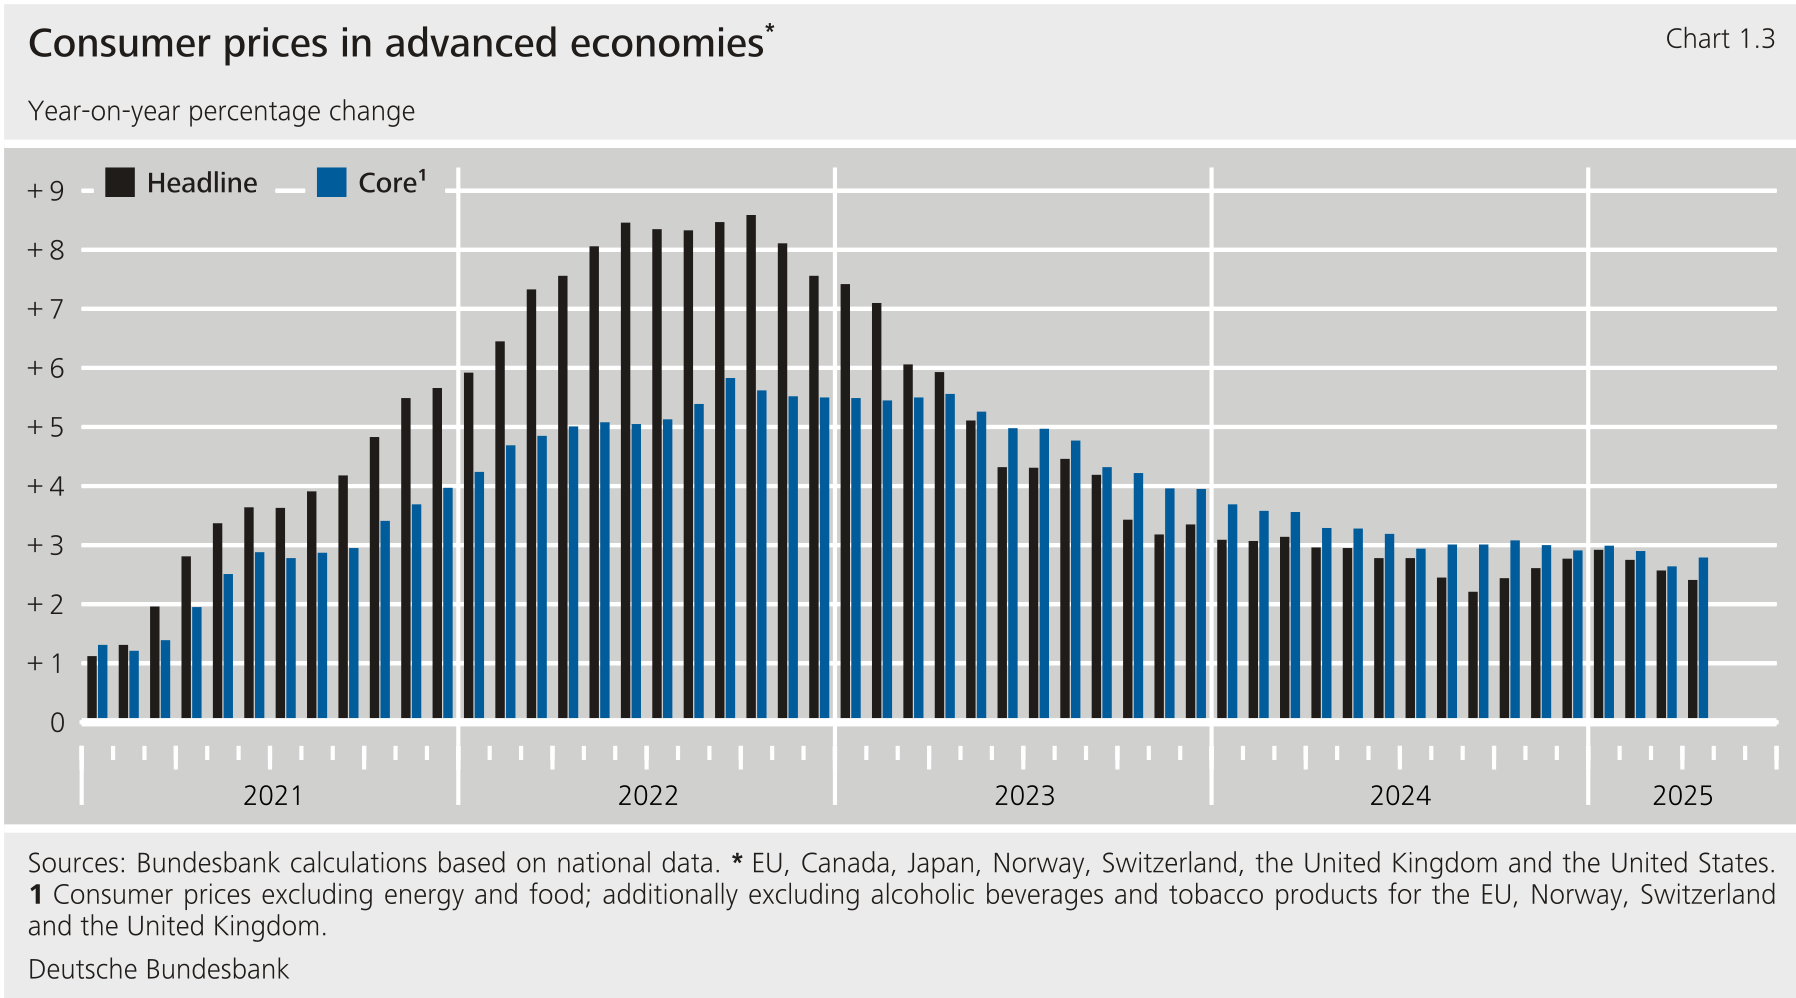**
****The global disinflationary process continues to unfold, but tariff hikes in the United States are likely to impede the downward trajectory.** The rise in consumer prices in the industrialised nations has slowed somewhat recently in the face of lower energy prices. In April, the rate of inflation for the overall basket of consumer goods amounted to 2.4 % on a year-on-year basis, compared to 2.9 % in January. The core rate of inflation, which excludes energy and food, fell slightly to 2.8 % over the same timeframe. Looking forward, the huge tariff increases imposed by the United States can be expected to push up consumer prices there. In Canada, too, which has already responded to higher tariffs with reciprocal tariffs of its own, the upward pressure on consumer prices is likely to persist. In other industrialised nations, lower commodity prices and the appreciation of local currencies against the dollar should generally support the ongoing process of disinflation over the coming months.**{#par-u4o4ie}
****As a result of the escalating tariffs of the United States, the International Monetary Fund** ()**cut its global growth forecast sharply.** In view of the rapidly changing situation in international trade policy, the staff drew up a number of scenarios in the World Economic Outlook published in April. The reference scenario factored in tariff announcements up until 4 April 2025. Based on these tariff assumptions, the expects global growth to decline from 3.3 % in 2024 to 2.8 % in 2025, before rising back to 3.0 % in 2026. These projections are well below the forecasts published in January. The downward revisions extend to almost all countries. In particular, the global trade in goods is suffering from restrictive trade measures. The effects of the interim tariff escalation between the United States and China, as well as the temporary suspension of other country-specific "reciprocal" tariffs, were analysed in a further scenario. Here the declines in in the United States and China are much more pronounced than they are in the reference scenario, whereas the global economy overall would be affected to a similar degree. In addition, the warned of the growth risks that could arise in connection with trade wars and the accompanying financial market turbulence.[\[4\]](#_ftn_root_4)**{#par-o4o26o}
**The macroeconomic effects of heightened uncertainty** {#tar-2}
----------------------------------------------------------------
****The discussion on the effects of heightened uncertainty on macroeconomic developments has recently returned to the forefront of economic policy debate.** The trade tensions triggered by the new administration's tariff announcements and increases were one major reason for this. It is feared that, in addition to the direct negative impact of tariff increases themselves, rising uncertainty among firms and consumers could further strain the already weak economic activity in the euro area.[\[1\]](#_ftn_4e778007_1)**{#par-e8iau9}
****Uncertainty can affect macroeconomic activity through various channels.** This includes, in particular, hesitant investment behaviour. As investments are often difficult or impossible to reverse, firms may delay investment decisions in times of heightened uncertainty and then make up the deferred investment once more information is available. Households may behave similarly when purchasing durable consumer goods. Elevated uncertainty can also trigger financial market reactions such as rising risk premia and tighter lending policies, thus also constraining aggregate economic growth.[\[2\]](#_ftn_4e778007_2)**{#par-aa294o}
****The absence of an exact measure of macroeconomic uncertainty poses challenges for quantitative impact analyses.** Although uncertainty can be distinguished from related concepts such as risk and surprise,[\[3\]](#_ftn_4e778007_3) this does not yield a clear measurement guideline. There are consequently a number of approaches to capturing uncertainty. The indicators derived from these approaches vary, in some cases considerably, in terms of both the calculation method and the data inputs.**{#par-o87e19}
{#par-o85o51}
**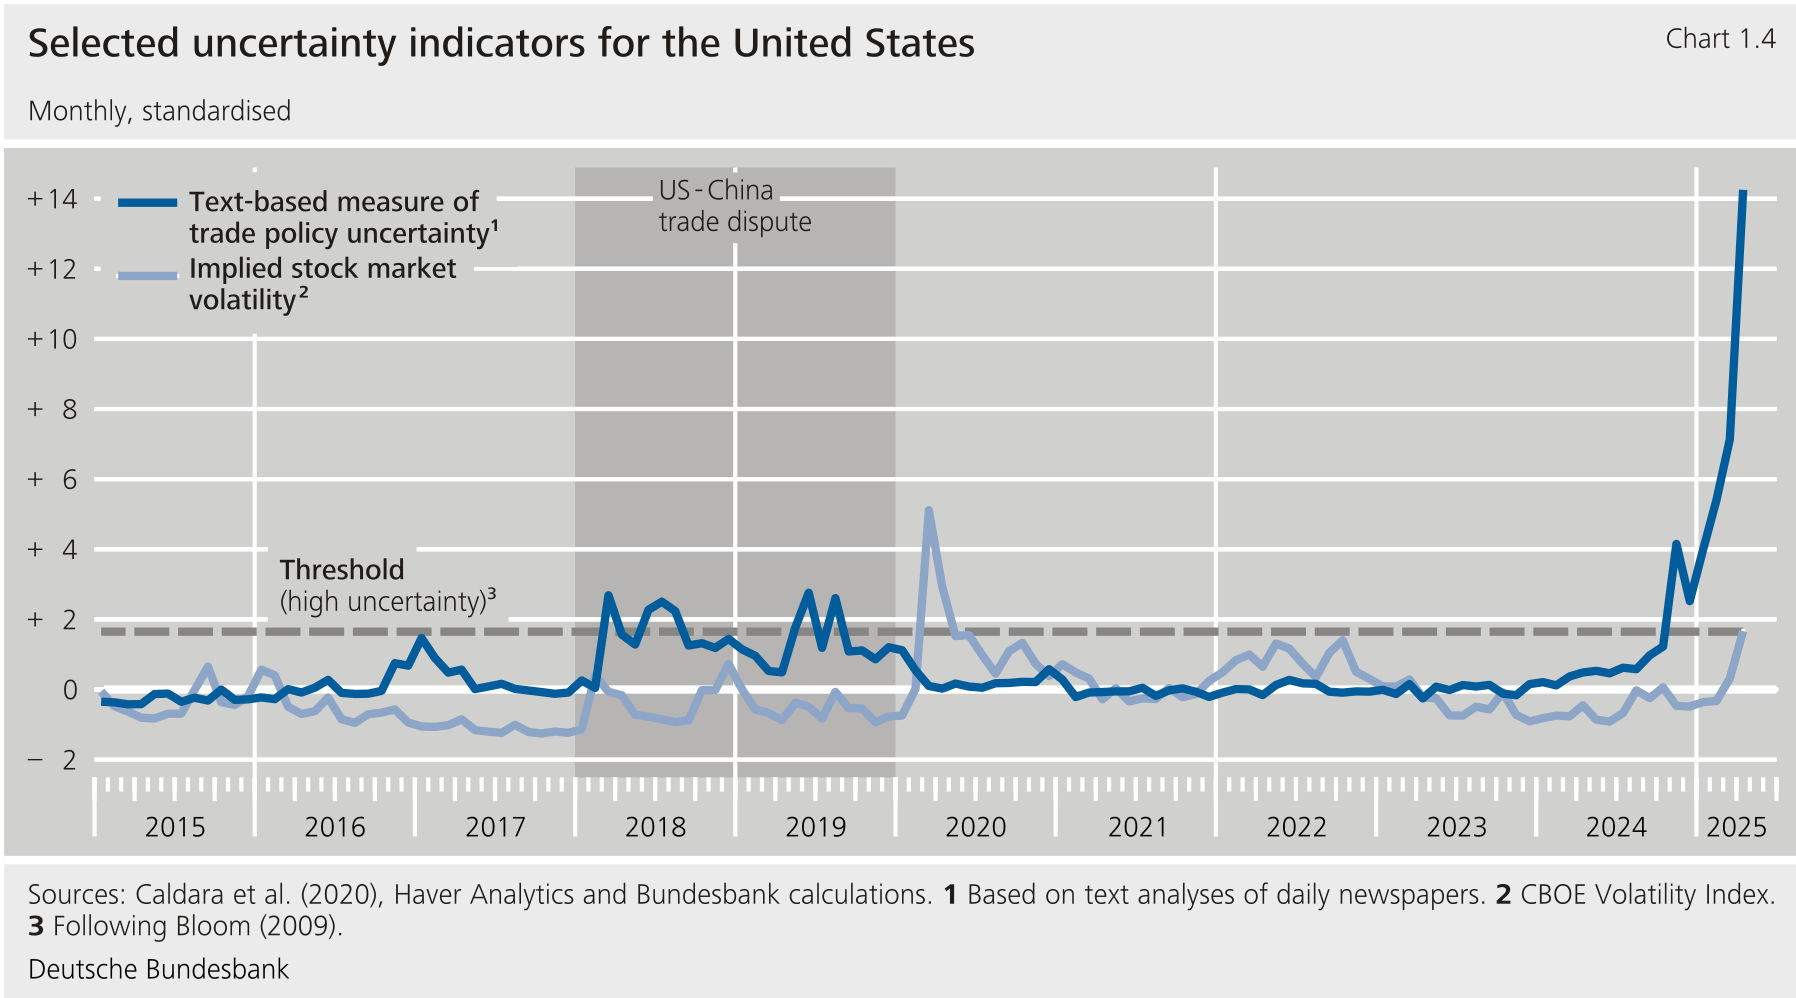**
****In the wake of the recent trade disputes, uncertainty indicators based on analysis of newspaper articles have attracted increased attention.** One popular measure, for example, tallies the frequency of reports on trade policy uncertainty in a number of national, mostly , daily newspapers.[\[4\]](#_ftn_4e778007_4) The degree of uncertainty is then derived from the intensity of reporting.**{#par-e4354u}
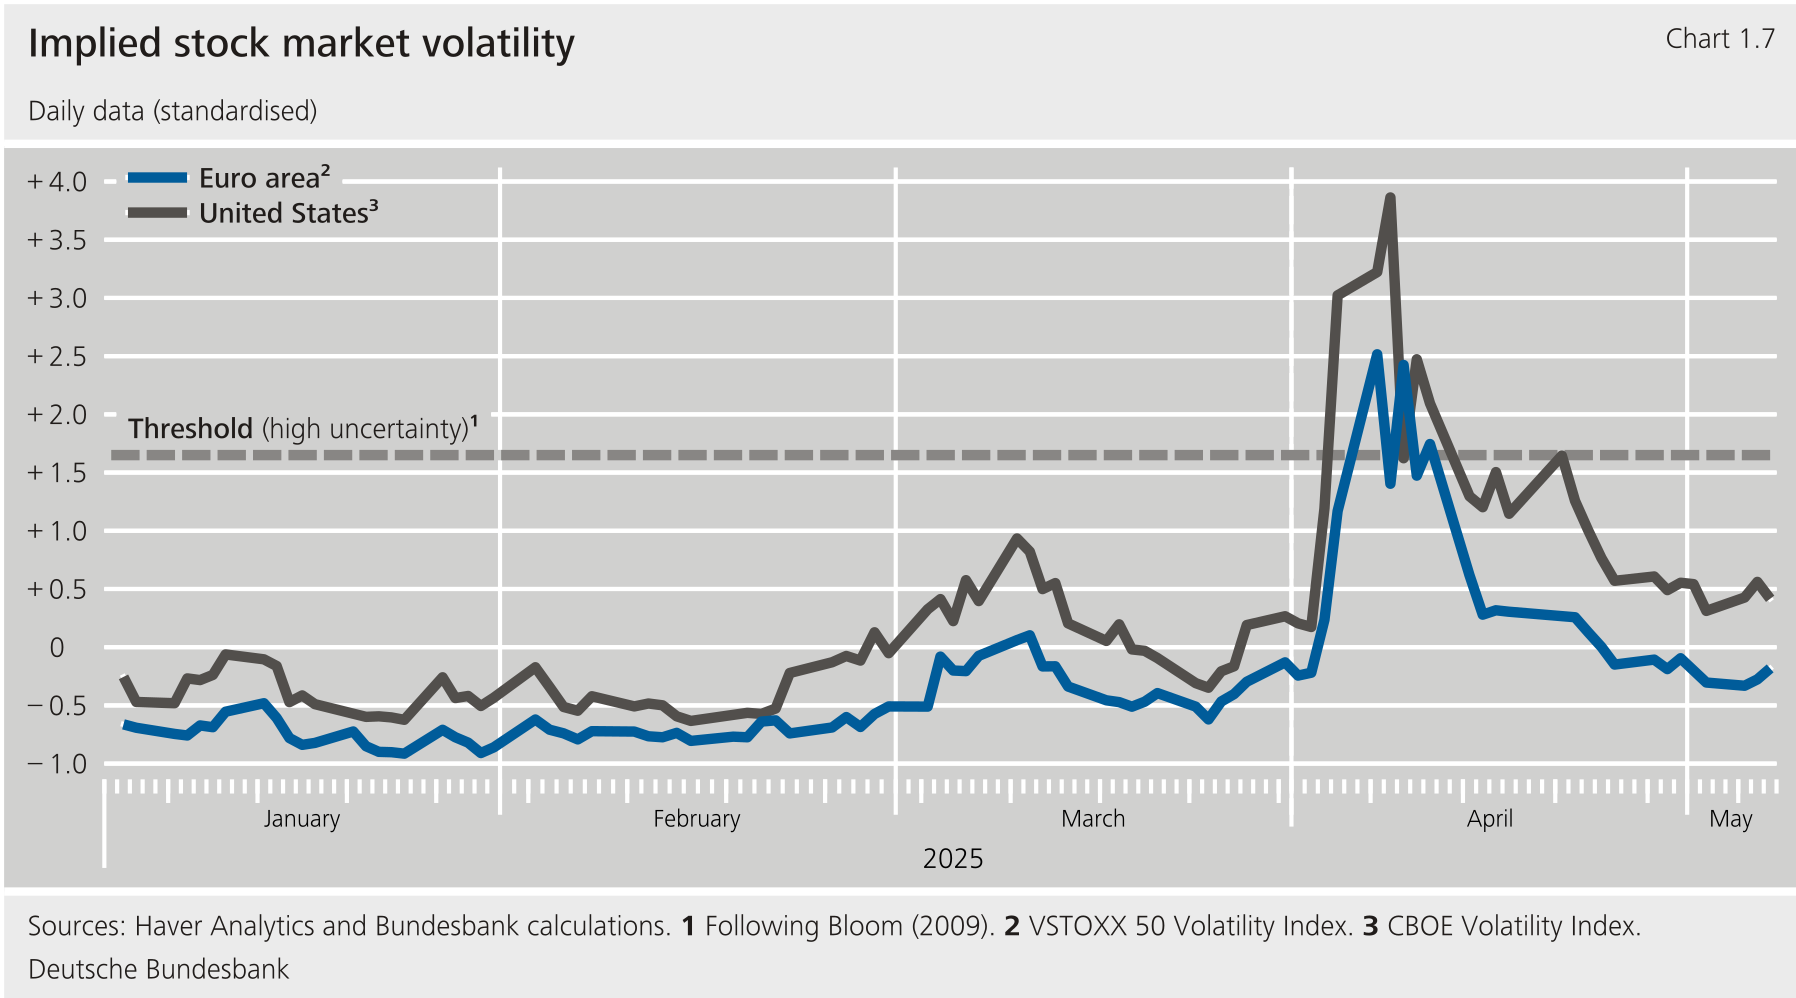
****This measure of trade policy uncertainty, derived from text analysis, has surged extraordinarily in recent months.** For instance, the indicator increased sharply following Donald Trump's election victory in November 2024. At the same time, other common measures of uncertainty, such as the implied stock market volatility derived from option prices, showed no comparable development, despite trade policy tensions typically being reflected in the financial markets.[\[5\]](#_ftn_4e778007_5)**{#par-o9u288}
****The question therefore arises as to what the text-based measures of trade policy uncertainty actually measure.** The term "uncertainty" is not always used consistently in newspaper articles. Sometimes even events that have already materialised are mentioned in the same context as uncertainty, or mainly unfavourable news is associated with uncertainty.[\[6\]](#_ftn_4e778007_6) Not infrequently, the terms uncertainty, risk and surprises are commingled. In addition, the selection of keyword combinations, as well as the newspapers evaluated, can shape the outcome of the text analysis.[\[7\]](#_ftn_4e778007_7) The latter also raises the question of how informative text-based measures based on an evaluation of predominantly newspapers are for other countries and regions.**{#par-u4a4o5}
{#par-iu27i1}
**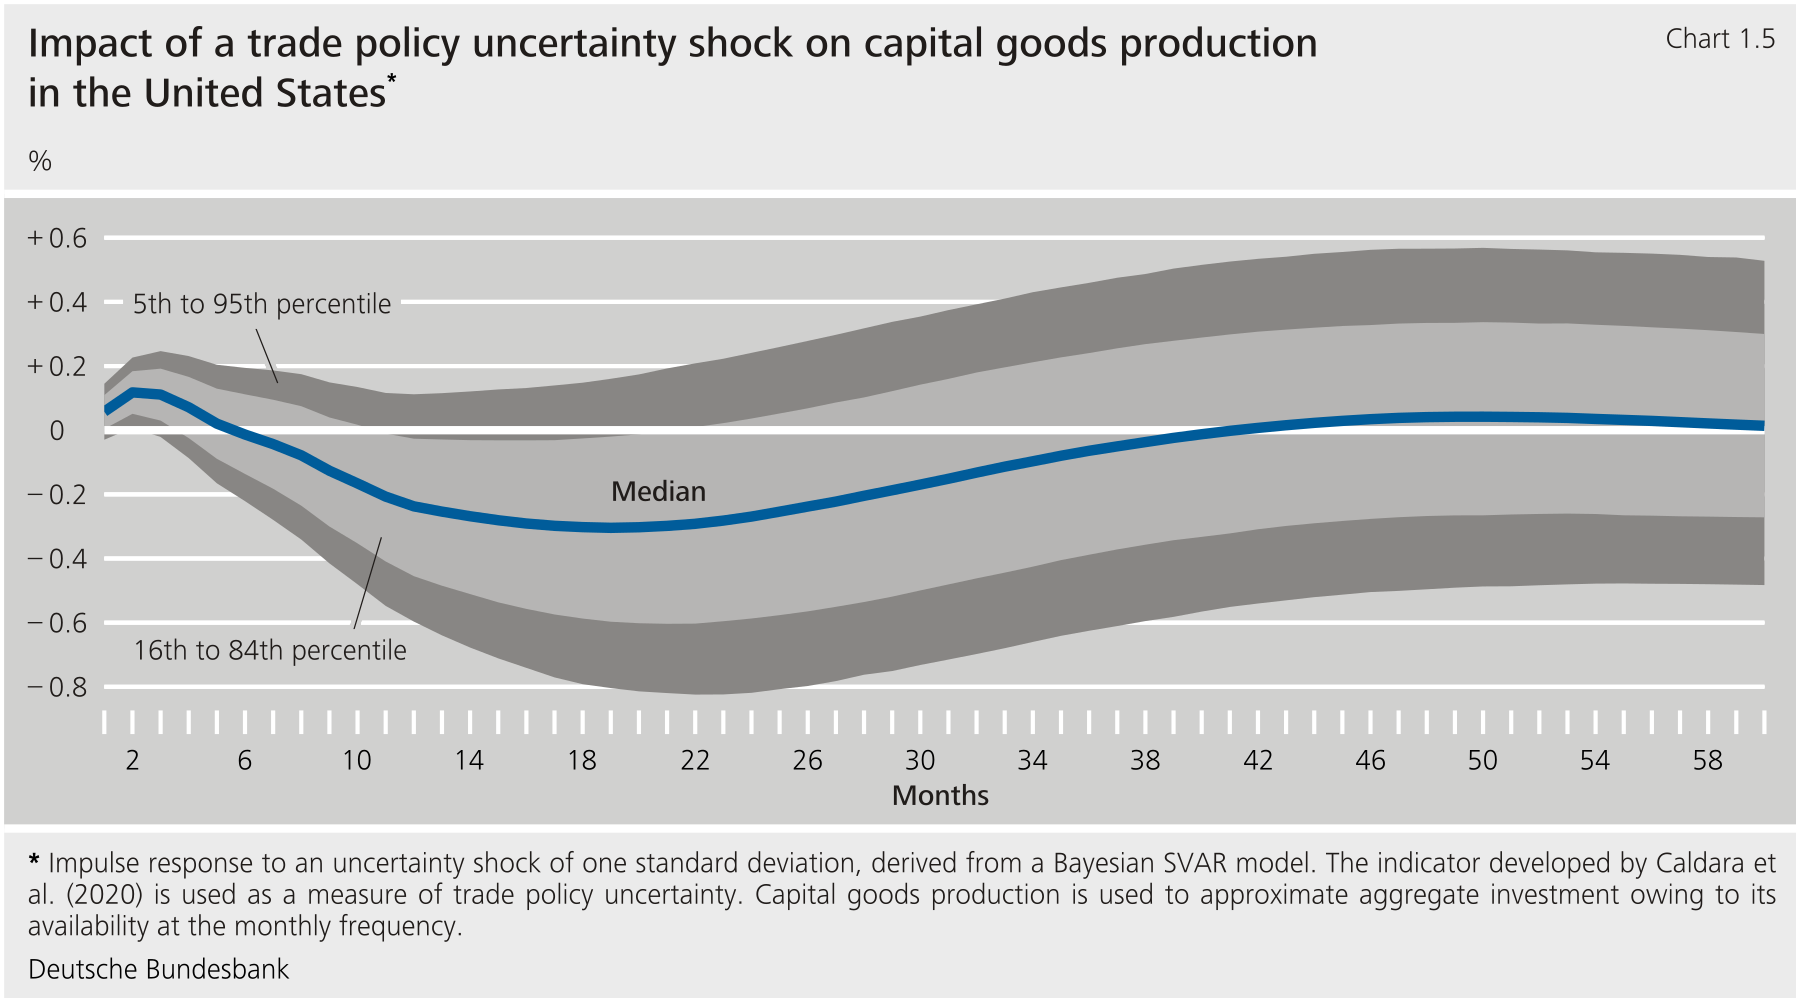**
****Analyses and forecasts based on text-based measures of uncertainty should therefore be interpreted with caution.** Individual weaknesses in text-based measures can be addressed, but only to a certain extent.[\[8\]](#_ftn_4e778007_8) Furthermore, the relationship between text-based measures of trade policy uncertainty and the real economy is not particularly close, according to empirical estimates. For example, even investments that typically respond considerably to uncertainty do not show any significant effect in our analyses.[\[9\]](#_ftn_4e778007_9) This raises the question of alternatives.**{#par-a9e718}
{#par-e34o73}
**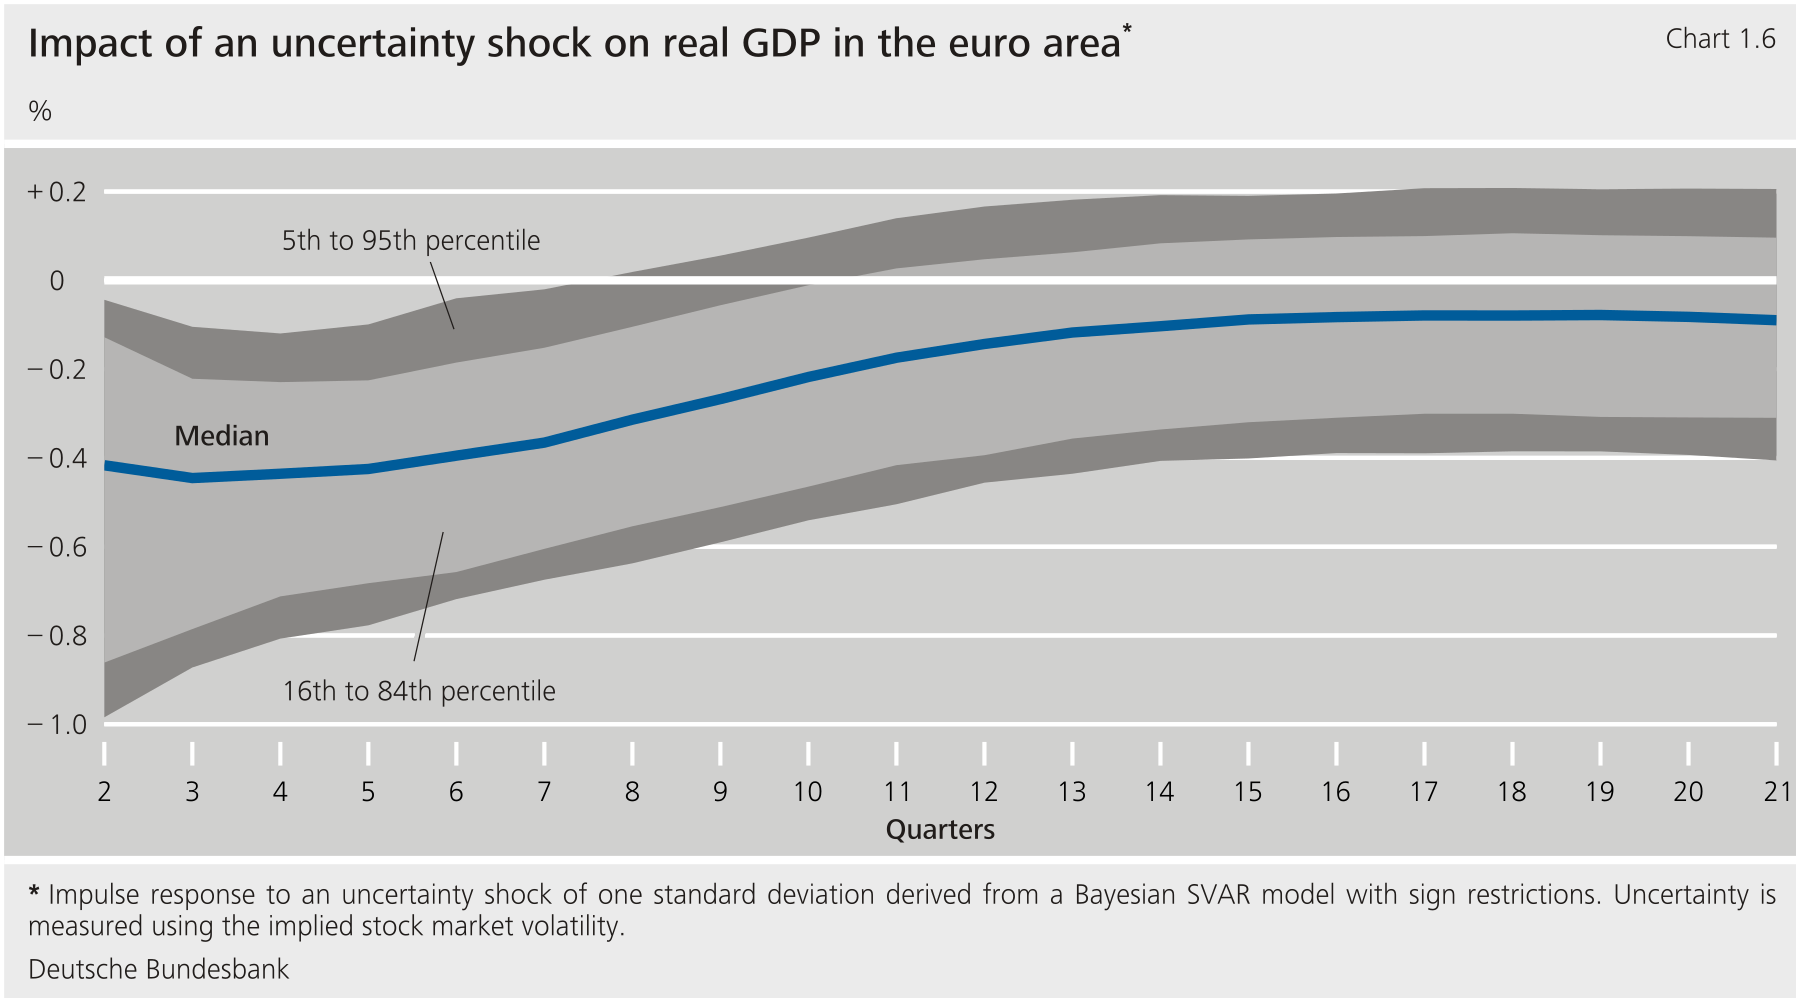**
****Indicators that reflect uncertainty in the financial markets can be used as a measure of macroeconomic uncertainty.** In April, implied stock market volatility in the United States responded to trade tensions, in some cases quite strongly. Nevertheless, the fluctuations were considerably smaller than for text-based measures. Uncertainty rose in euro area financial markets, too. Empirical estimates suggest that, in the past, periods of heightened stock market volatility were associated, on average, with significant negative real effects.[\[10\]](#_ftn_4e778007_10) These experiences can be used to derive expectations for current developments. The duration of the uncertainty is important here. Although the EURO STOXX 50 Volatility Index showed, in some cases, strong swings in April, on a monthly average it remained markedly below the usual benchmark for high uncertainty, unlike its counterpart. Therefore, if uncertainty in the financial markets does not flare up again significantly, the macroeconomic effects for the euro area are likely to be significantly smaller than the impulse responses calculated for a quarterly shock would suggest.**{#par-a5481i}
{#par-ei5841}
****
1. **{#_ftn_4e778007_1} See Deutsche Bundesbank (2024a).**
2. **{#_ftn_4e778007_2} See also Deutsche Bundesbank (2018a).**
3. **{#_ftn_4e778007_3} See Deutsche Bundesbank (2018a).**
4. **{#_ftn_4e778007_4} Text searches are run on articles from the "Boston Globe", "Chicago Tribune" "Guardian", "Los Angeles Times", "New York Times", "Wall Street Journal" and "Washington Post" for keywords or combinations of keywords related to trade policy uncertainty at fixed time intervals. See Caldara et al. (2020).**
5. **{#_ftn_4e778007_5} Ludvigson et al. (2021) present an alternative measure of financial market uncertainty, which is based on the conditional volatility of forecast errors of a comprehensive set of financial market data (see Deutsche Bundesbank (2018a), (2020)). However, due to publication delays, this indicator does not extend to the current end.**
6. **{#_ftn_4e778007_6} See Handley and Limão (2022).**
7. **{#_ftn_4e778007_7} See, inter alia, Ghirelli et al. (2019).**
8. **{#_ftn_4e778007_8} See Handley and Li (2020).**
9. **{#_ftn_4e778007_9} Even in small models, in which uncertainty is allowed to have a comparatively large impact due to the absence of alternative explanatory factors, the relationship often remains statistically insignificant. See Deutsche Bundesbank (2020). The recursively identified structural vector autoregression () model for the United States used here was estimated for the January 1985 to December 2024 period using Bayesian methods. The model variables include not only the indicator of trade policy uncertainty but also an indicator of macroeconomic uncertainty (see Jurado et al. (2015)), the 500 stock price index, a shadow short rate (see Krippner (2013)), the consumer price index, the effective import tariff rate, the unemployment rate, capital goods production and industrial production net of capital goods production. The lag order of the model is 12.**
10. **{#_ftn_4e778007_10} The impulse response functions were derived from a Bayesian model for the euro area. The estimations are based on the period from the first quarter of 1999 to the fourth quarter of 2024. Inputs in the model are the EURO STOXX 50 Volatility Index, real , the Harmonised Index of Consumer Prices, a shadow rate (see Krippner (2013)), a bank credit spread and a stress indicator for the financial system (). Structural shocks are identified using contemporaneous sign restrictions. The lag order of the model is 5. See Deutsche Bundesbank (2018a) and Meinen and Röhe (2018).**
### **Chinese economy robust so far this year despite tariff conflict with the United States**
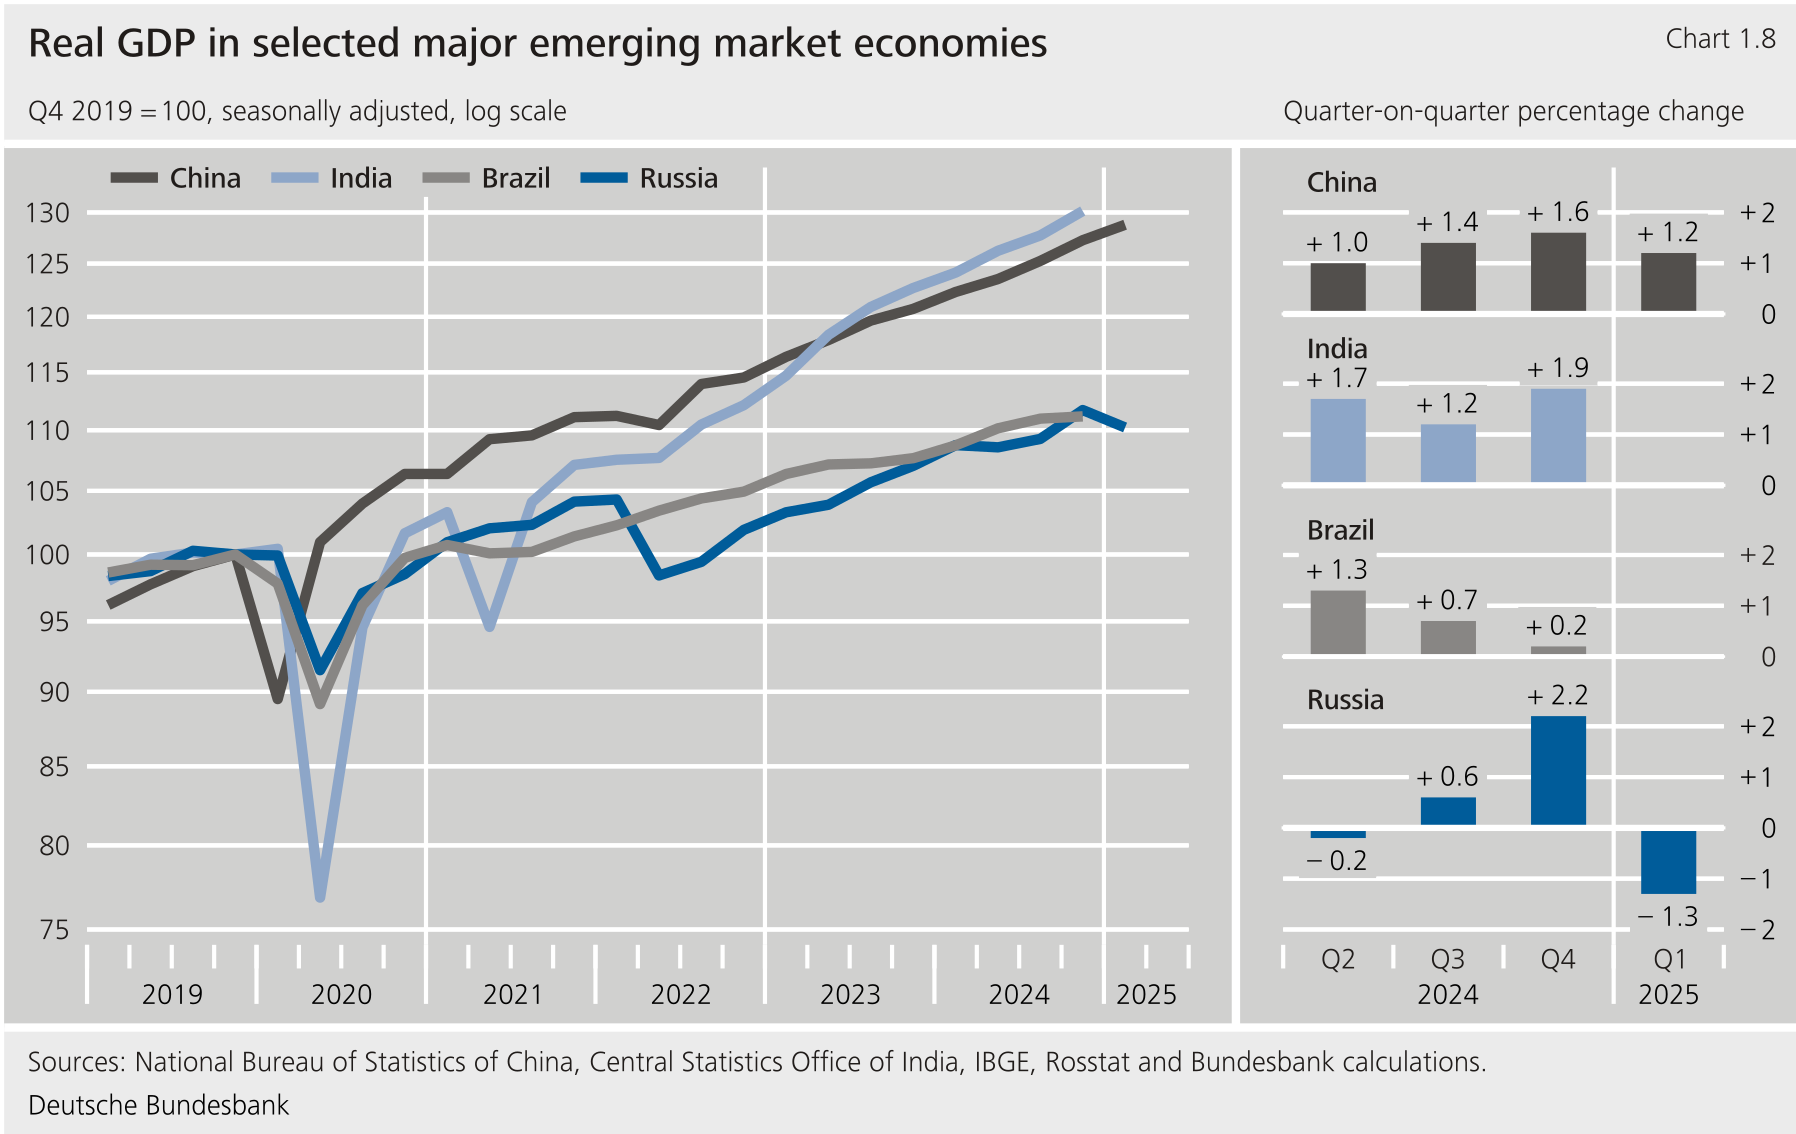
****In China, economic growth remained robust in the first quarter of 2025.** According to official estimates, real grew by 5.4 % over the last year, matching the figure reported in the final quarter of 2024. Seasonally adjusted economic output increased by 1.2 % on the quarter. The economy enjoyed support from government-backed purchase incentives, which clearly boosted private consumption. Moreover, goods exports increased once again from an already high level. Even exports to the United States developed solidly up until March 2025, despite the introduction of the first new additional tariffs on Chinese products.**{#par-auaea3}
****The tariff conflict with the United States is likely to weigh noticeably on the Chinese economy over the next few months.** The announcement of reciprocal tariffs by the administration at the start of April was the catalyst for a chain of tariffs and counter-tariffs between the United States and China within the space of just a few days. Extremely high tariffs on bilateral trade were in force for a period of several weeks, but the two countries then agreed to a temporary suspension of most additional tariffs in the middle of May. A virtually full decoupling of trade and the associated losses were thereby averted for the time being at least (see the supplementary information entitled "[The potential impact of the current trade dispute between the United States and China](#The-potential-impact-of-the-current-trade-dispute-between-the-United-States-and-China)"). In April, consumer prices were 0.1 % below the level recorded a year previously. Excluding food and energy, a small rise of 0.5 % was recorded. At the beginning of May, the Chinese central bank cut its key interest rate as well as the minimum reserve threshold for credit institutions.**{#par-io377e}
### **1.2 Diverging trends in other major emerging market economies**
****In India, economic growth is likely to have remained strong in the first quarter of 2025.** The last available official data, which relate to the final quarter of 2024, revealed that economic output was up 6.2 % in a year-on-year comparison. The economy appears to have continued to develop impressively at the start of 2025, buoyed by a vibrant services sector in particular. The outlook for manufacturing remains uncertain, however. As part of the "reciprocal" tariffs imposed by the United States, India's goods exports to the are to be hit with an additional levy of 26 %. The Indian government is attempting to ward these off by reaching a trade agreement with the United States.[\[5\]](#_ftn_root_5) Due to lower food prices in particular, the consumer price inflation rate has fallen back significantly since the fourth quarter of 2024 and stood at 3.2 % in April. The central bank cut its key interest rate by 25 basis points in both February and April, bringing it down to 6 %.**{#par-o5i8ea}
****Brazil has experienced an interim economic growth spurt.** The economic upturn in Brazil lost significant momentum in the final quarter of 2024. On a seasonally adjusted basis, real rose by just 0.2 % compared to the prior quarter. Although a resurgence in growth seems evident in the first quarter of 2025, this is likely to be driven not least by extraordinarily ample harvests and is therefore not expected to last. The braking effects of monetary policy, which has been clearly restrictive for quite some time now, are set to exert a stronger impact over the next few months. High inflation, the depreciation of the real, and signs of an overheating economy had prompted the central bank to increase key interest rates sharply at the end of 2024, contrary to the global trend. Despite this backdrop, the rise in consumer prices accelerated further in recent months, and at 5.5 % in April, inflation was still above the central bank's target corridor. Since the beginning of 2025, the central bank has increased its key rate further in two steps to 14.75 %.**{#par-uo5u36}
****In Russia, economic growth slowed noticeably.** According to the flash estimate of the national statistics office, the real growth rate experienced a sharp year-on-year fall to 1.4 % in the first quarter of 2025, following on from 4.5 % in the final quarter of 2024. Economic output is also likely to have recorded a marked quarter-on-quarter decline on a seasonally adjusted basis.[\[6\]](#_ftn_root_6) A major driver of this development has been the decline in corporate investment against a backdrop of persistently restrictive monetary policy. In addition, there has been a further decline in private consumption. Despite this evidence of economic slowdown, the unemployment rate remained at a very low level, most recently coming in at 2.3 %. At 10.2 % in April, the rise in consumer prices remained high. The central bank chose to leave its key rate unchanged at 21 %. Meanwhile, public finances suffered a major deterioration. Government spending increased strongly throughout the reporting period in connection with the war against Ukraine. In addition, the latest decline in oil prices and a broadly stable rouble against other currencies reduced government income.**{#par-a2618u}
{#par-i4896i}
****
{#par-a363i4}
**The potential impact of the current trade dispute between the United States and China** {#tar-3}
--------------------------------------------------------------------------------------------------
****Although the trade conflict between the United States and China has recently been dialled down markedly, tariffs remain high.** Only days after taking office, the new administration toughened its trade policy towards China. In two steps, it imposed additional tariffs totalling 20 % on imports of all Chinese goods. China responded by taking moderate retaliatory measures. As part of the announcement of "reciprocal" tariffs on all trading partners at the beginning of April, the United States then imposed additional tariffs of 34 % on China. China's response of levying similar-sized tariffs on all imports triggered a spiral of retaliatory tariffs. For a brief period, a large part of trade between the United States and China was subject to tariffs of well over 100 %. Although a large portion of these reciprocal additional tariffs were suspended in mid-May following bilateral negotiations, there is a risk of a return to prohibitively high tariff barriers by as early as August. In addition, the average effective tariffs on Chinese goods are currently still just over 30 percentage points higher than at the beginning of the year, while Chinese tariffs on products are more than 10 percentage points higher.**{#par-iu8272}
****Even though the trade dispute between the United States and China has been going on for several years, bilateral goods trade has been very important for both countries.** The and China already engaged in a trade war during the first Trump administration, with a large portion of each country's imports from the other country being slapped with additional tariffs of up to 25 %. As a result, deliveries of the goods concerned dropped off significantly.[\[1\]](#_ftn_4c75a376_1) Nonetheless, particularly the flow of goods from China to the United States has remained very extensive. In 2024, China's deliveries of goods to the totalled $525 billion. This equated to around 15 % of total Chinese goods exports, or around 2 % of global exports.[\[2\]](#_ftn_4c75a376_2) By contrast, exports to China were significantly smaller.**{#par-oia842}
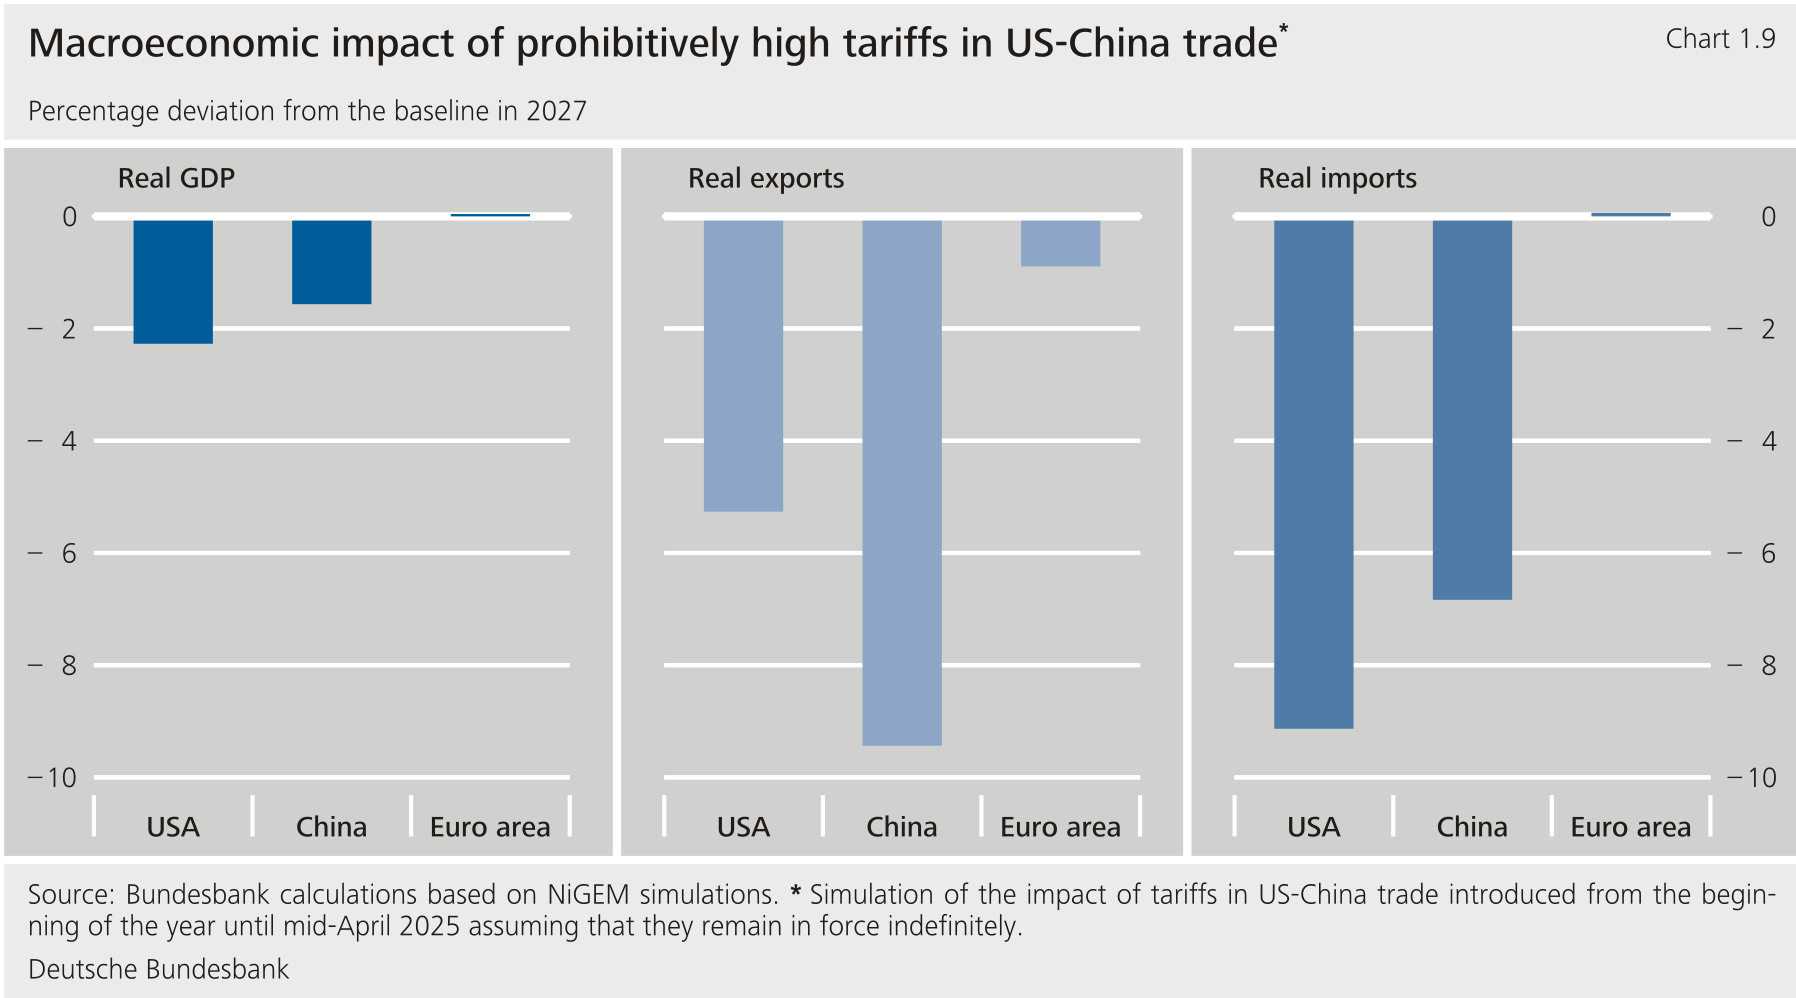
****Simulations show that prohibitively high tariffs would result in considerable macroeconomic losses in the United States and China.** The NiGEM global economic model can be used to simulate the medium-term impact of the very high tariffs in -China trade in force between mid-April and mid-May.[\[3\]](#_ftn_4c75a376_3) The model calculations suggest that such high tariffs would be a tremendous drag on Chinese and exports in the long term.[\[4\]](#_ftn_4c75a376_4) Compared with a reference scenario without additional tariffs, China's total exports were down by almost 10 %, while exports were down by just over 5 %. Translated to trade between the United States and China, this would wipe out roughly two-thirds of bilateral goods trade. China's would fall by 1.5 % by 2027 compared with the reference scenario and output would fall by 2.3 %. Another important point besides the fall in exports is that imports of intermediate inputs and final products would become considerably more expensive for both countries. That is also the reason why the United States, despite running a high deficit in goods trade with China, would have reason to fear bigger losses.**{#par-e57a4o}
****The spillover effects of a trade war between the United States and China on the euro area are likely to be limited.** According to the NiGEM simulations, euro area would hardly be affected in the medium term. Although weaker economic growth, especially in China and the United States, would be a drag on European exports, this would be largely outweighed by gains in global market share. In the model calculations, euro area imports rise only marginally. This appears to dispel fears that Chinese exporters could sell goods originally destined for the United States in Europe at far lower prices. However, model calculations based on aggregate trade flows can only approximate such diversion effects in international trade.**{#par-ou6424}
{#par-ai31i8}
****
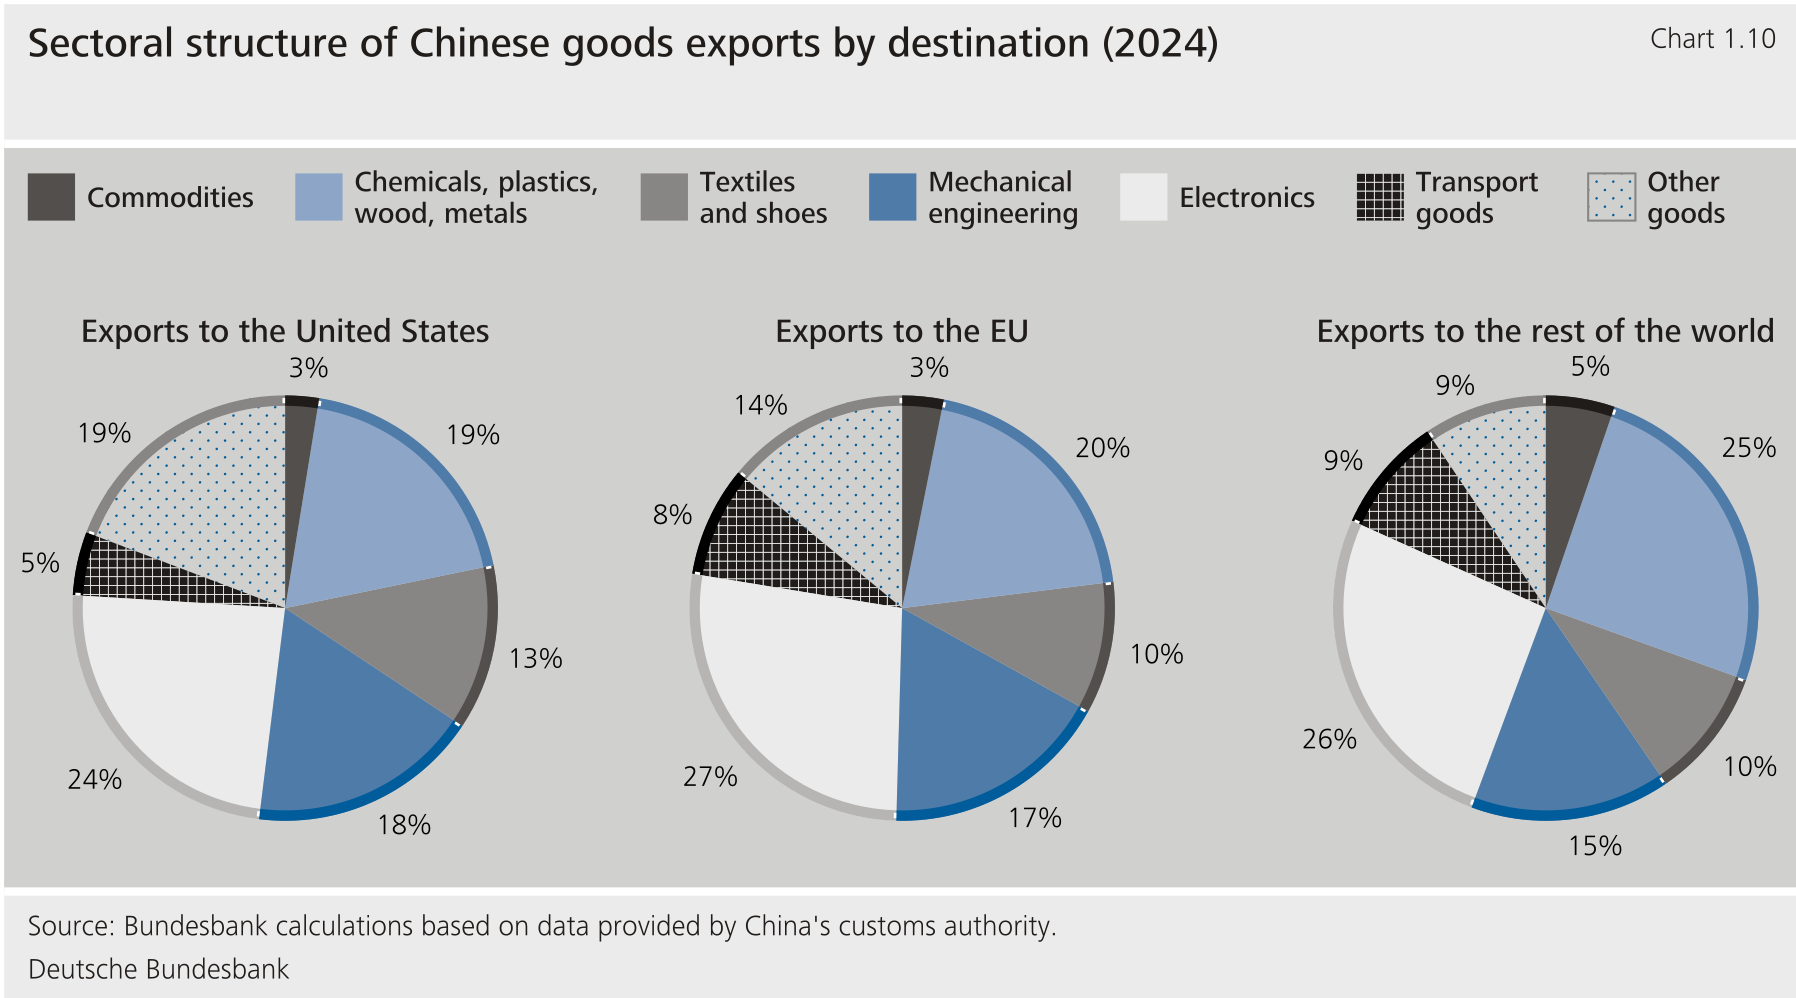
****Alternative calculations do not suggest a flood of Chinese imports in Europe, either.** On the whole, the product mix of Chinese exports to the United States is not very different from Chinese exports to the or other regions. This suggests that exports previously destined for the United States would be redistributed more or less evenly across China's other trading partners.[\[5\]](#_ftn_4c75a376_5) Assuming that Chinese exports to the United States to decline by two-thirds, Chinese exports to the could rise by around 11 %. This would be equivalent to an increase of only 2½ % in the total extra imports of the . In reality, the increase would likely be much smaller. Some of the goods no longer purchased by the United States would probably be absorbed by Chinese domestic demand. It also stands to reason that many Chinese goods would still make their way to the United States via third countries.[\[6\]](#_ftn_4c75a376_6) Finally, in line with the simulation results described above, production losses in China would be expected.[\[7\]](#_ftn_4c75a376_7)**{#par-au21o6}
{#par-u3ia43}
****
****The prospect of significant economic losses in both economies is likely to have played a key role in the recent easing of** -**China trade relations.** This is also indicated by the fact that, for now, the provisional agreement does not address the United States' high bilateral trade deficits, a key concern of the administration. With that in mind, further negotiations could be challenging. However, a further reduction of tariff barriers would benefit both economies. Even under the additional tariffs introduced since the beginning of the year and still in force, NiGEM simulations show that Chinese and economic output would both be ½ % lower in the medium term than in the reference scenario excluding these tariffs.**{#par-iou895}
1. **{#_ftn_4c75a376_1} See Deutsche Bundesbank (2020).**
2. **{#_ftn_4c75a376_2} The goods value given here is based on Chinese data. The foreign trade statistics show significantly lower imports from China, which is likely to be due to, amongst other factors, potential underinvoicing of customs documents to evade tariffs and small imports below the de minimis tariff exemption threshold not being statistically recorded. See Clark (2025).**
3. **{#_ftn_4c75a376_3} NiGEM is a semi-structural model designed by the National Institute of Economic and Social Research that models the economies of most countries and major emerging market economies. For more, see Hantzsche et al. (2018) and Bernard et al. (2024).**
4. **{#_ftn_4c75a376_4} The simulations do not include tariff hikes against other trading partners, other policy initiatives by the new administration, the increase in macroeconomic uncertainty and recent fluctuations in the financial and forex markets. For a broader analyses of previous administration policy proposals and their implications for the German economy, see Deutsche Bundesbank (2024a).**
5. **{#_ftn_4c75a376_5} This is also suggested by experience gained from the -China trade conflict up until now. staff analyses find that import restrictions between 2012 and 2023 led to an increase in Chinese exports to the euro area but also to other regions of the world. See European Central Bank (2025).**
6. **{#_ftn_4c75a376_6} For example, it is conceivable that while China continues to produce key components of a product, final production will be relocated to countries which can serve the market at lower tariffs. Since the trade dispute between the United States and China broke out in 2018, there has been increasing evidence of such restructuring of value chains. See Freund et al. (2024).**
7. **{#_ftn_4c75a376_7} Model-based simulations by the Kiel Institute for the World Economy and the World Trade Organization () also show limited diversion effects for Europe. In the Kiel Institute's trade model, a nearly 50 % decline in imports from China due to tariff increases leads to a 3 % increase in imports from China. According to the study, a decline in imports from China of nearly 80 % would be associated with an increase in European imports from China of 6 %. See Hinz et al. (2025) and World Trade Organization (2025).**
### **1.3 Economic developments in the United States increasingly influenced by tariff increases**
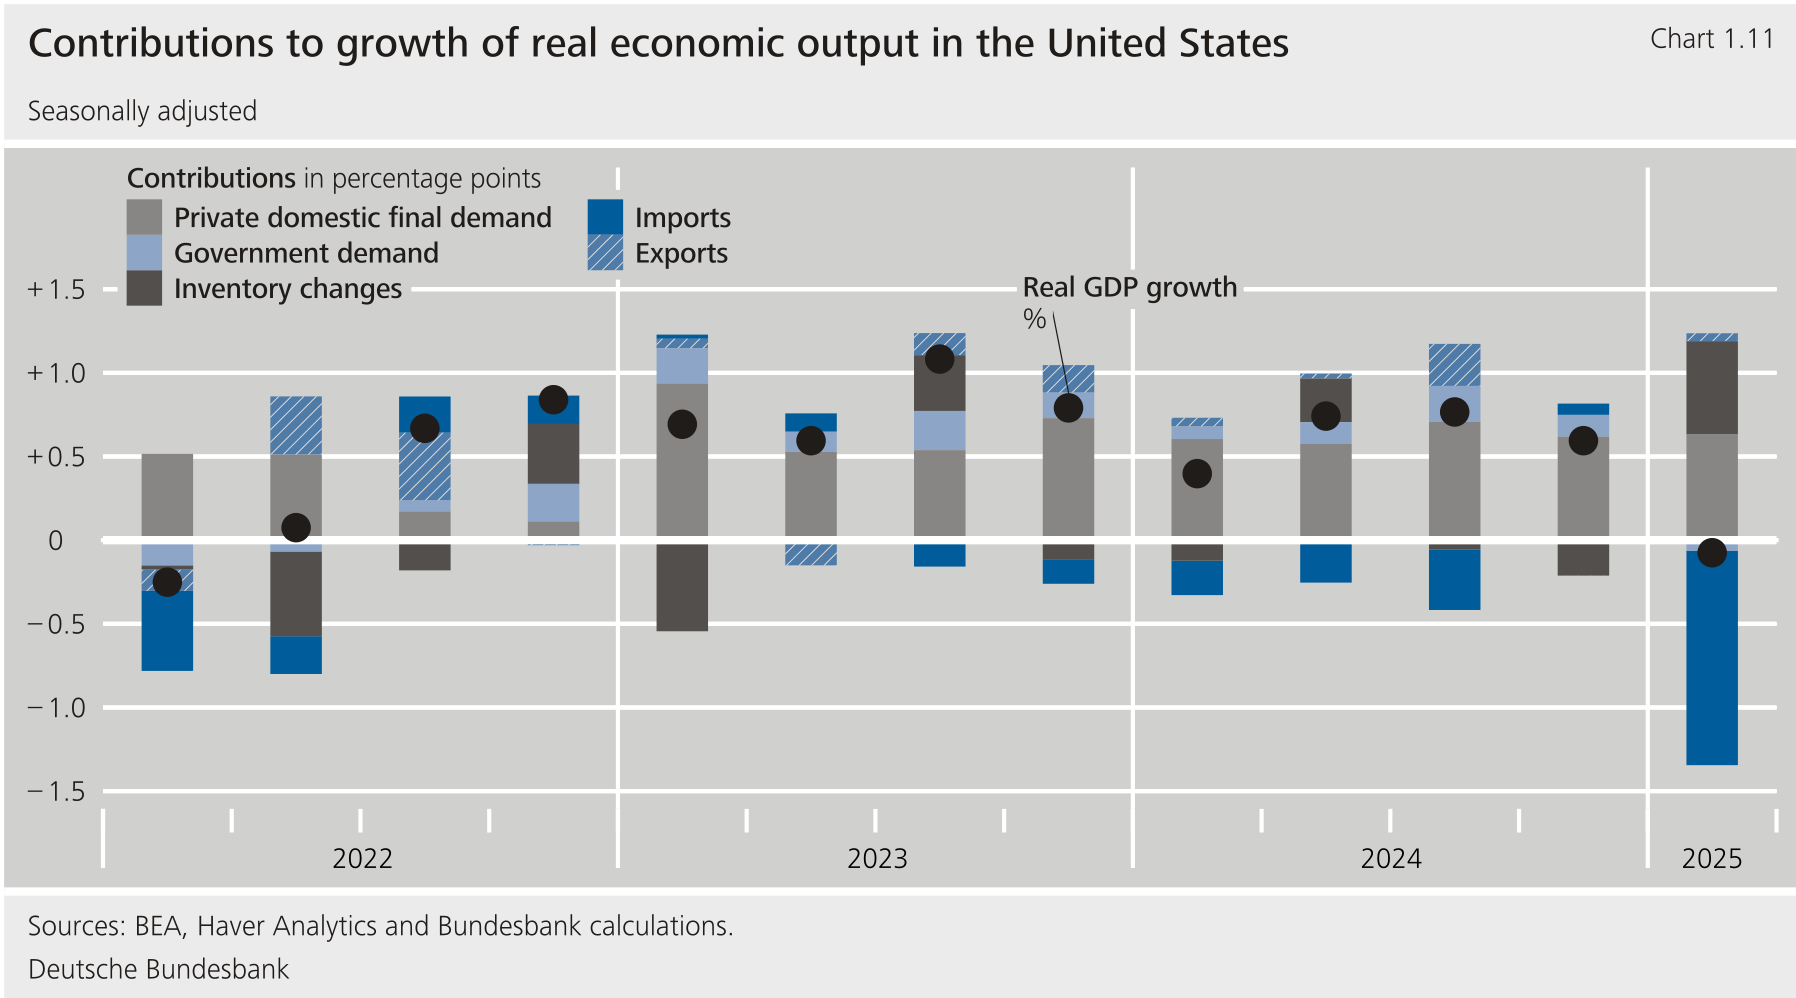
****In the United States, a previously buoyant economy showed evidence of slowing at the start of the year.** According to an initial estimate, real recorded a quarter-on-quarter decline of 0.1 % in the first three months of the year after seasonal adjustment. It was clear that the new direction of trade policy has left its mark on the national accounts. Although the first tariff rates had already applied with effect from February, imports rose sharply in anticipation of further tariff increases. This was particularly true of imports of pharmaceutical products and hardware. Mirroring this development, the corresponding investment in inventory and equipment recorded a powerful surge, albeit not quite to the same degree. This discrepancy alone suggests that the weak result overstates the extent of the economic slowdown.[\[7\]](#_ftn_root_7) As further evidence of this, companies in the United States also expanded their investment significantly in other areas. In addition, exports also recorded an increase in the first quarter. Last but not least, consumers increased their expenditure markedly, despite a weak start to the year for weather-related reasons. Once again, a persistently strong labour market propped up consumption. Although government demand recorded a slight quarter-on-quarter decline for the first time in almost three years, this was attributable to the new administration's campaign to save money as well as a normalisation of military expenditure.**{#par-e3ii9e}
{#par-u4u873}
****
****Going forward, tariff increases can be expected to increasingly weigh on the** **economy.** As things stand, the average effective tariff rate of the United States as a result of the various executive orders is more than 13 percentage points higher than it was at the start of the year. At the same time, the erratic nature of trade policy has contributed to the uncertainty. Companies in all major branches of the economy have downgraded their business expectations against this turbulent backdrop. Consumer sentiment has also deteriorated, as many consumers are anticipating a surge in inflation. Findings from the last -China trade dispute actually suggest that domestic companies and consumers ultimately bear the brunt of higher tariffs.[\[8\]](#_ftn_root_8) In the current situation, the first indicators of the corresponding effects are being provided by company surveys, which point to widespread increases in procurement prices. These are only likely to feed through into official price statistics gradually due to long supply routes and gradual cost pass-through.[\[9\]](#_ftn_root_9) In the short term, tariff effects will also be mitigated by the effects of lower commodity prices. In April, consumer prices were up by 2.3 % on the year, a distinctly lower rate than three months previously. Core inflation declined to a still high level of 2.8 %. Against this backdrop, and in view of the opposing risks to its employment and price stability mandate, the Federal Reserve left key interest rates unchanged at its most recent meeting.**{#par-a87u5u}
{#par-u21988}
****
### **1.4 decline in Japan**
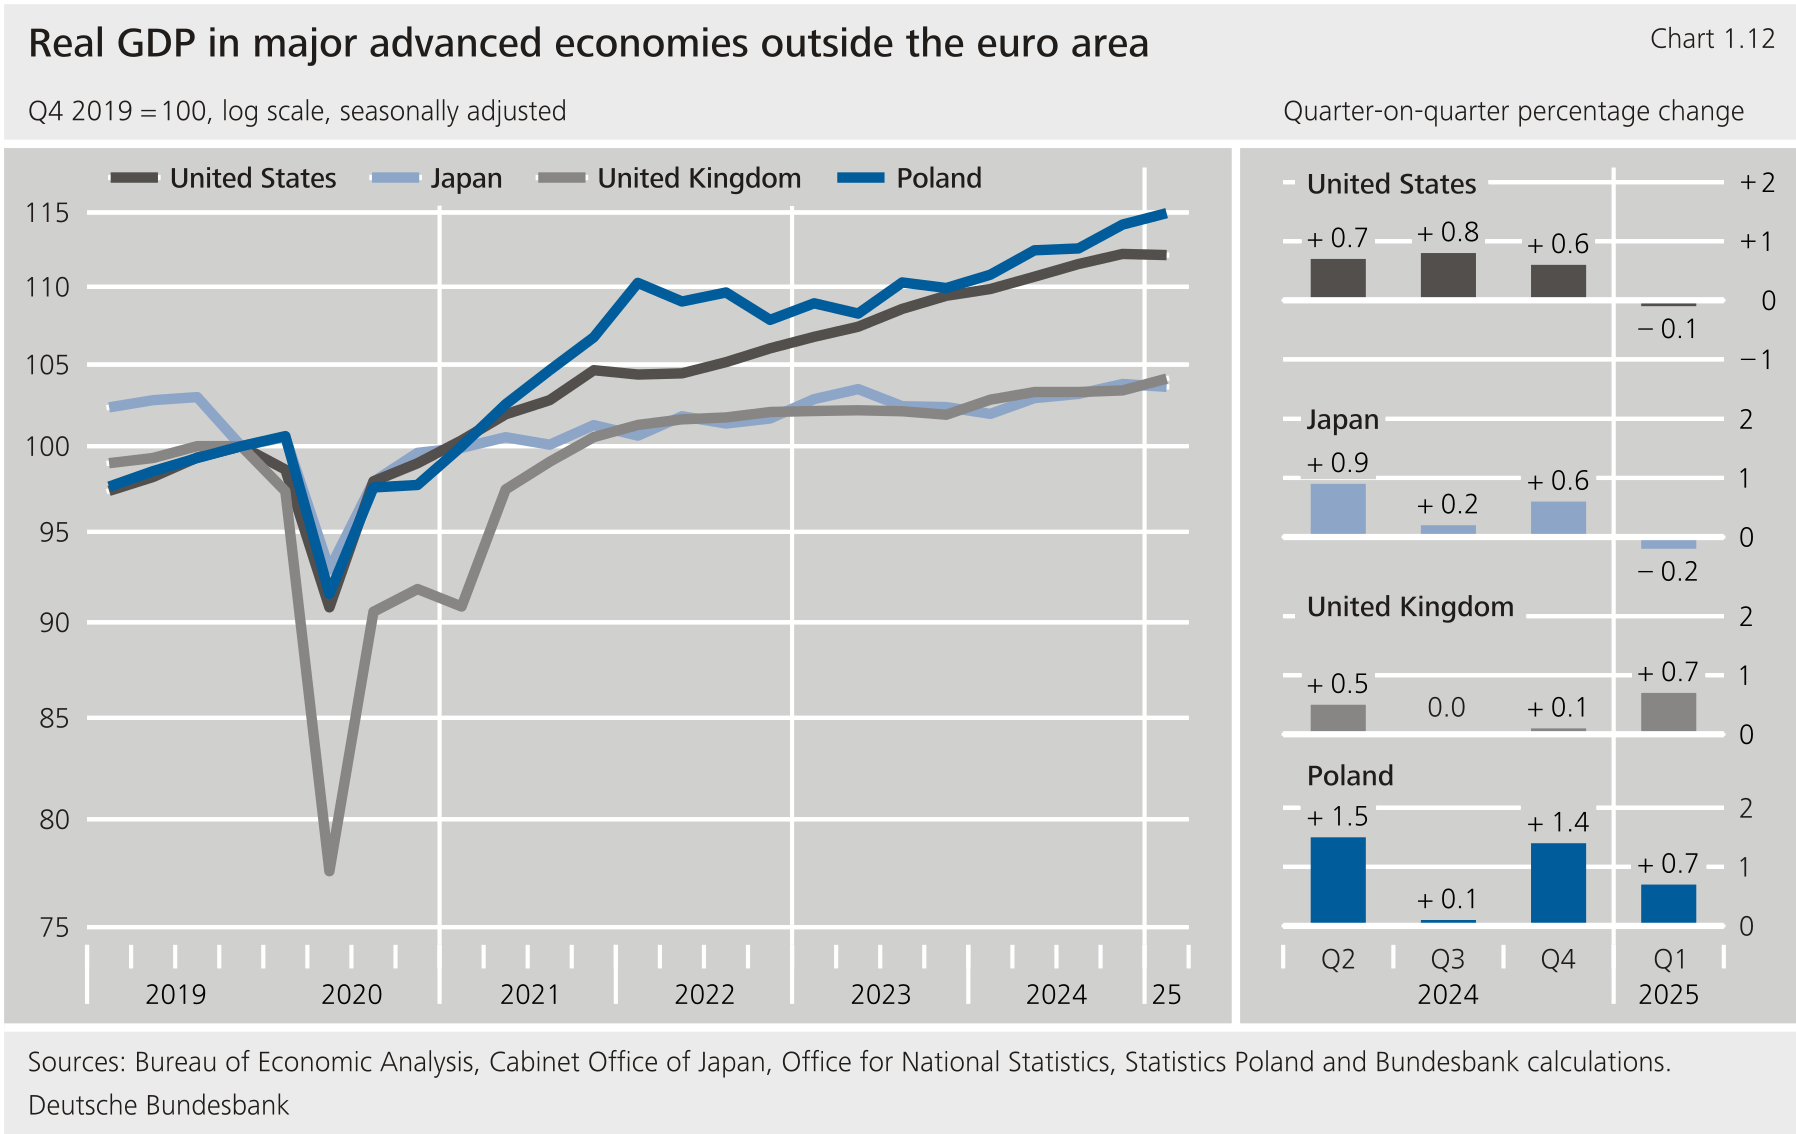
****The Japanese economy got off to a weak start in 2025.** According to the initial estimate, recorded a quarter-on-quarter decline of 0.2 % in the first three months of the year on a price-adjusted and seasonally-adjusted basis, following an increase of 0.6 % in the prior quarter. Private consumption stagnated, not least because the strong rise in consumer prices eroded the purchasing power of Japanese households. By contrast, Japanese companies increased investment spending and restocked inventories markedly. As a result, imports rose sharply. Exports declined slightly. Despite the fall in economic output, the labour market situation remained persistently favourable, with the unemployment rate remaining low in March at 2.5 %. Wage growth can be expected to be strong once again this year. According to the preliminary results of this year's spring wage round, negotiated wages were up by 3.8 %.[\[10\]](#_ftn_root_10) Given this development, the rise in consumer price inflation is likely to prove enduring. In March, consumer prices recorded a year-on-year rise of 3.6 %. Food prices increased in particular. The rate of inflation excluding energy and food amounted to 1.6 %. In view of the uncertainty over tariff policy, the Japanese central bank left its key rate unchanged at 0.5 % in May, despite strong rises in prices.**{#par-oi85e3}
### **1.5 economy is vibrant**
****The** **economy expanded strongly in the first three months of 2025.** recorded a quarter-on-quarter rise of 0.7 %. A particularly strong contributor to this development was the services sector, which reported strong activity. In addition, production picked up noticeably in manufacturing, with anticipatory effects in expectation of higher tariffs making a clear contribution. Construction activity stagnated. Despite strong growth in the first quarter, corporate surveys pointed to a distinct deterioration in sentiment by April. In addition to uncertainty over trade policy, increases in non-wage labour costs and the minimum wage probably had an impact too.[\[11\]](#_ftn_root_11) The trade agreement with the United States announced at the start of May may have strengthened corporate confidence somewhat recently, as at least the threat of further escalation in this bilateral trading relationship appears to have been warded off.[\[12\]](#_ftn_root_12) The labour market situation deteriorated somewhat. Although wage growth receded to some extent, it most recently stood at 5.5 % in a year-on-year comparison. The process of disinflation has also progressed since the start of the year. The recorded a further year-on-year decline to 2.6 % in March. The core rate of inflation (excluding energy and food) declined to 3.4 %. The Bank of England anticipated a continuation of the disinflationary trend and cut its key interest rate by 25 points to 4.25 % at the beginning of May.**{#par-u6o4i9}
### **1.6 Polish economy loses momentum**
****In Poland, economic growth slowed at the start of the year.** According to preliminary data, real recorded a quarter-on-quarter rise of 0.7 % on a seasonally adjusted basis, following a rise of twice this magnitude in the fourth quarter of 2024. Whilst activities in the services sector continued to expand strongly, the production of industrial goods declined. Only the production of capital goods recorded a rise following a prolonged phase of weakness. Activity stagnated in the construction sector. Private consumption appears to have increased only modestly. Indeed, retail sales actually declined on a price-adjusted basis. The labour market continues to be characterised by shortages. The unemployment rate remained at the low level of 2.7 %, while gross wages in the corporate sector recorded a year-on-year rise of around 8 %. The rate of inflation fell to 4.3 % year-on-year in April from 4.9 % in March. In response, the Polish central bank cut its key interest rate in May by 0.5 percentage points to 5.25 %, its first interest rate adjustment since October 2023.**{#par-e4e961}
**2 Temporary growth acceleration in the euro area** {#tar-4}
-------------------------------------------------------------
****In the euro area, economic output increased markedly in the first quarter of 2025.** According to Eurostat's flash estimate, recorded a price-adjusted and seasonally-adjusted rise of 0.3 % compared to the prior quarter. Excluding Ireland, the rise works out at 0.2 %.[\[13\]](#_ftn_root_13) In the prior quarter, euro area rose more modestly. In the latest growth acceleration, anticipatory effects based on expectations of higher tariffs on imports are likely to have played a role.[\[14\]](#_ftn_root_14) The slightly positive underlying economic trend in the euro area did not change overall. There was evidence of an improvement in the situation in manufacturing, whereas momentum slowed in the services sector. The economic outlook is subdued, not least in view of greater protectionist tendencies in the United States and high economic policy uncertainty generally. Production expectations in manufacturing and the services sector deteriorated recently. On the other hand, more favourable financing terms and lower commodity prices are likely to have a supporting effect. Tangible growth stimuli from the announced fiscal support programmes should not be expected until later in the year.**{#par-uu1575}
****Private consumption remained on an upward trajectory but has probably slowed.** New vehicle registrations increased less strongly in January and February than in the prior quarter, when they experienced a very strong rise due to one-off effects. A slowdown in retail sales growth was also evident. Higher wages combined with more moderate rates of inflation are likely to have continued to improve the income situation of private households. At the same time, consumer confidence experienced a clear decline over the course of the first quarter. In particular, expectations regarding the future general economic situation as well as personal economic circumstances deteriorated noticeably. As a consequence, the proportion of households currently wanting to make major purchases declined.**{#par-a4o6uo}
****Investment activity increased modestly at best at the start of the year** .[\[15\]](#_ftn_root_15) Construction production picked up in January and February, in all likelihood benefiting from infrastructure measures. Residential construction appears to have stabilised. The volume of construction approvals increased markedly up to the end of the previous year. By contrast, investment in equipment and machinery is likely to have declined. Following the sharp rise in the purchase of transport goods prior to the end of the year, a countermovement appears to have set in here. In addition, capital goods producers' domestic sales rose only slightly on a price-adjusted basis in January and February. Expenditure on information and communication technologies, as well as on intellectual property products, can be expected to have increased further on the back of the digitalisation trend. The increasing use of artificial intelligence is likely to have played a role here (see the supplementary information entitled "Use of artificial intelligence -- a European comparison").**{#par-u273u9}
**Use of artificial intelligence -- a European comparison** {#tar-5}
--------------------------------------------------------------------
****The rapid advances in artificial intelligence** ()**are raising hopes of aggregate labour productivity growth being stimulated.** This holds particularly true for the euro area, where productivity gains have been weak for some time now.[\[1\]](#_ftn_497fb4e9_1) Noticeable productivity effects would require widespread use in the corporate sector.**{#par-u3e4i9}
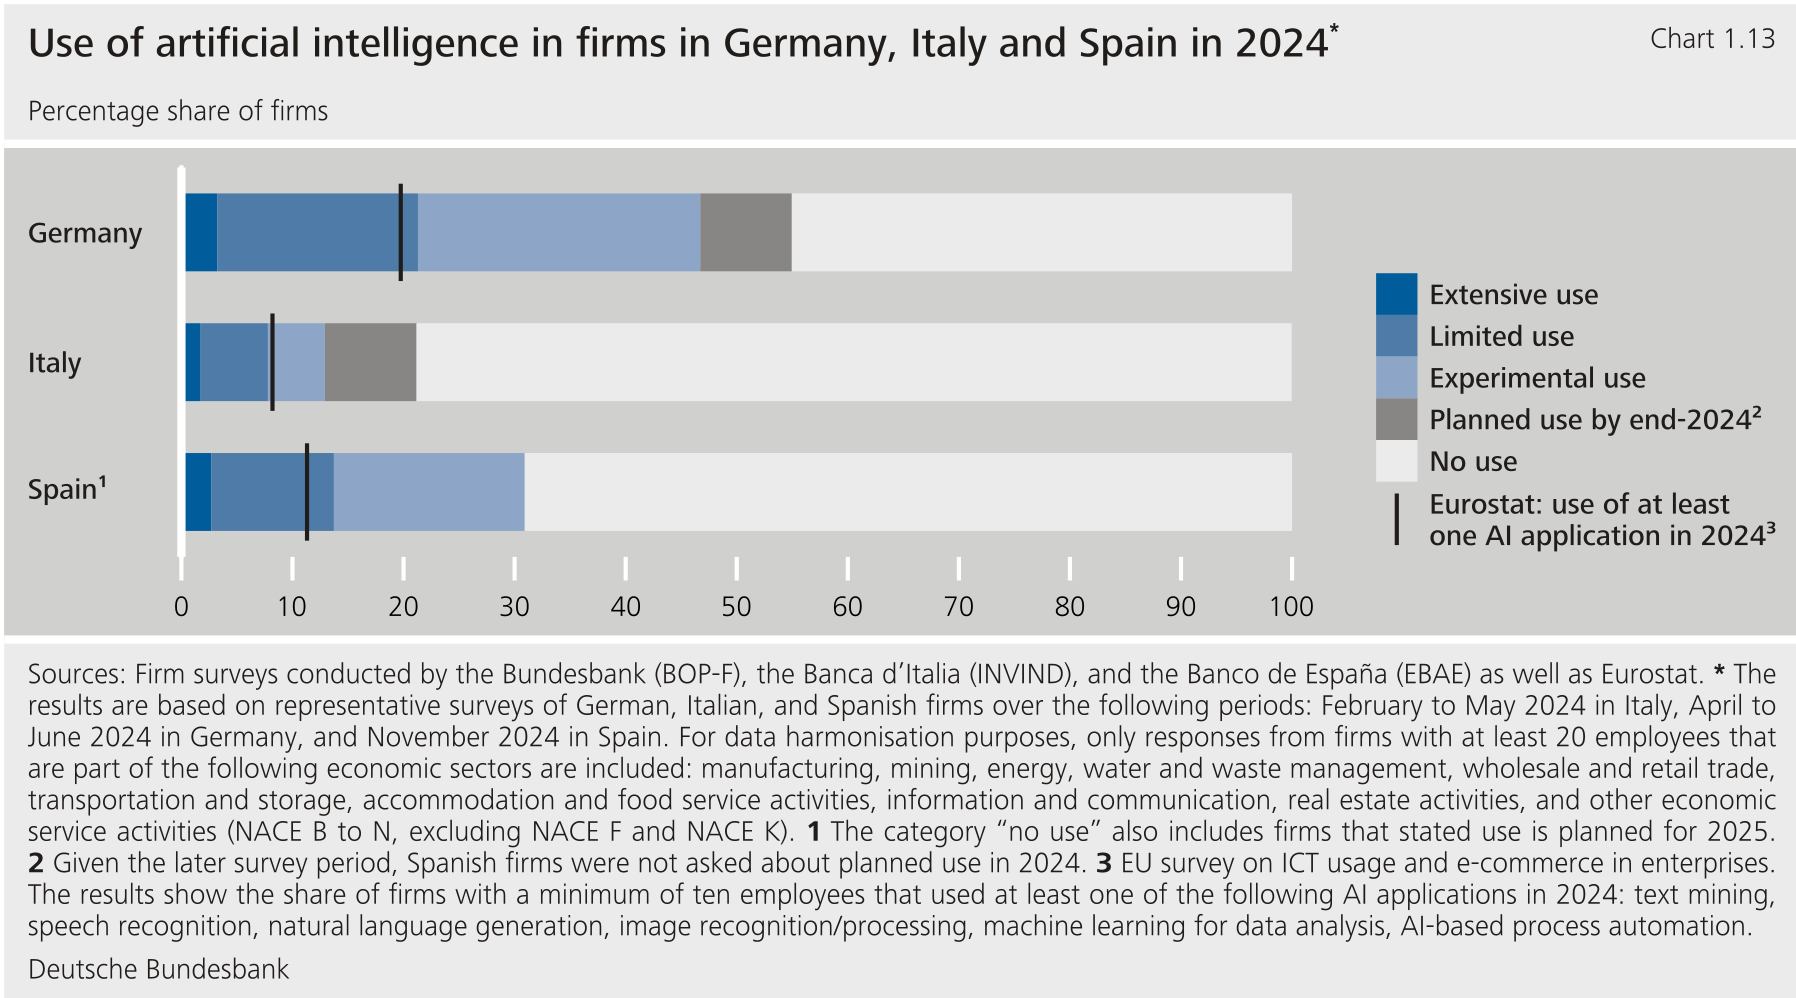
****A survey on the use of** **in German, Spanish and Italian firms provides insights into the extent of** **use in three large euro area countries.** This cross-country comparison is made possible by cooperation between the Bundesbank, the Banca d'Italia and the Banco de España. In 2024, these institutions asked harmonised questions on the use of as part of their representative firm surveys.[\[2\]](#_ftn_497fb4e9_2) The surveys also capture the intensity of use, which distinguishes them significantly from other surveys.[\[3\]](#_ftn_497fb4e9_3)**{#par-e7e3ii}
****According to the surveys, the use of** **was significantly more pronounced in German firms in 2024 than in Spain and Italy.** Overall, 47 % of German firms reported using extensively, to a limited extent or experimentally. Total use was considerably lower in Spain and Italy, at 31 % and 13 %, respectively. All three countries recorded a similarly low level of extensive use of the technology. Differences between the countries are mainly seen in terms of limited and experimental use of . In 2024, significantly more firms used to a limited extent in Germany and Spain (18 % and 11 %, respectively) than in Italy (6 %). A similar pattern is evident for experimental use, which was the dominant type of use in Germany (25 %) and Spain (17 %), whereas it was significantly less prevalent in Italy (5 %). However, it should be noted that the survey periods differ. While Italian and German firms were surveyed in the first half of 2024 (in Italy from February to May, in Germany from April to June), the survey of Spanish firms did not take place until November 2024. This may distort the cross-country comparison, as adoption is likely to have increased further over the course of 2024. For instance, in Germany and Italy, a further 8 % of firms also reported that they did not yet use , but were planning to do so by the end of 2024.**{#par-a65773}
{#par-e68eia}
****
****Further survey results for a broader group of countries support the finding that** **use is significantly more widespread in Germany than in Spain or Italy.** The statistical offices of the Member States record the share of firms that use at least one technology.[\[4\]](#_ftn_497fb4e9_4) This figure largely corresponds to the sum of limited and extensive use for the three euro area countries considered above. The statistical offices' results confirm that German firms use to a significantly greater degree compared with those in Spain and Italy. Nevertheless, Germany is not among the frontrunners in the . Germany ranks 9th across all countries, with firms in Scandinavian countries, in particular, using much more frequently.**{#par-u925u2}
{#par-ao7u2e}
**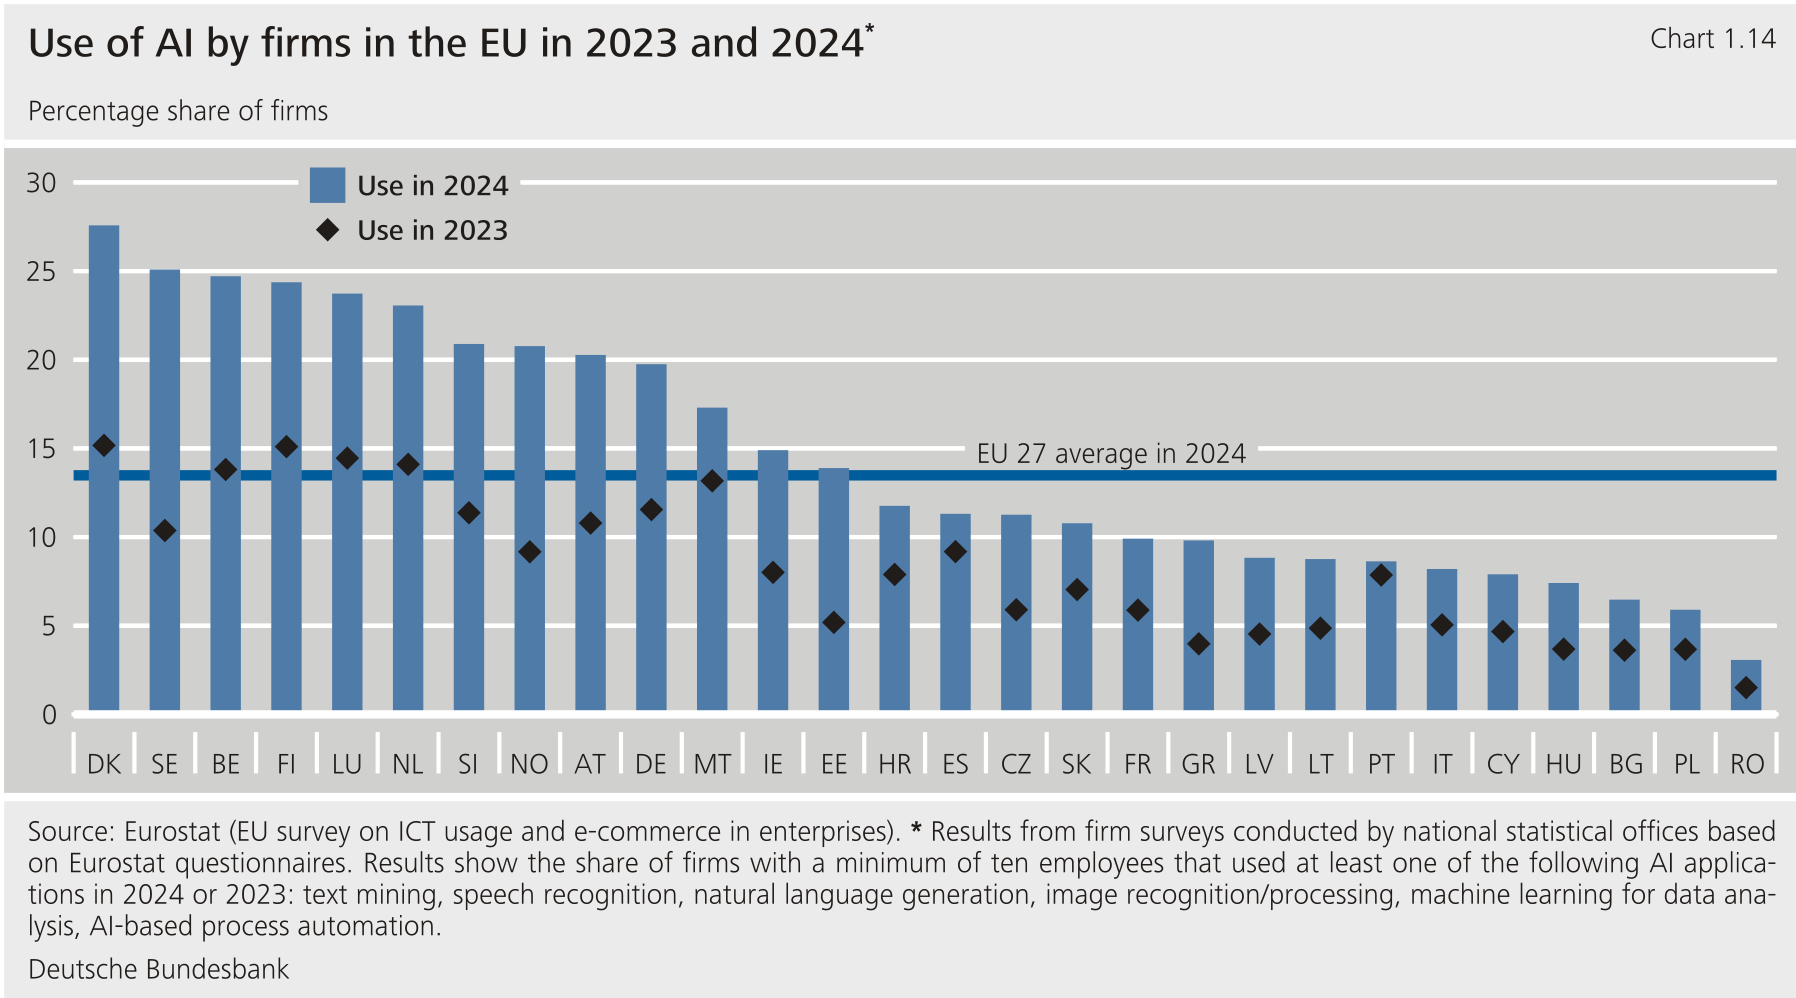**
****Overall, the survey data for 2024 show that** **use is increasing perceptibly among firms.** Compared with 2023, the use of has increased in all countries and in some cases considerably. Nevertheless, there is potential for further use in many countries. Given the novelty of the technology, it is not surprising that it is still being used relatively sparingly. However, this also means that significant productivity gains at the macroeconomic level resulting from the spread of are, at least in the short term, unlikely to materialise.**{#par-iu8483}
1. **{#_ftn_497fb4e9_1} See Deutsche Bundesbank (2021).**
2. **{#_ftn_497fb4e9_2} See Deutsche Bundesbank (2024b), Banca d'Italia (2024) and Banco de España (2025). For ease of comparison, the samples in all three countries were limited to firms with at least 20 employees from the following sectors: manufacturing, energy, water and waste management, mining, wholesale and retail trade, transportation and storage, accommodation and food service activities, information and communication, real estate activities, and further economic service activities (Statistical classification of economic activities in the European Community B to N, excluding F and K). The full sample in Germany also includes enterprises with fewer than 20 employees and other sectors, meaning there are some differences between the results presented here and those of the full sample; see Deutsche Bundesbank (2024b).**
3. **{#_ftn_497fb4e9_3} This applies in particular to data from the " survey on usage and e-commerce in enterprises", which are based on surveys conducted by the respective national statistical offices and only record whether firms use at least one application.**
4. **{#_ftn_497fb4e9_4} The data published by are part of the survey on usage and e-commerce in enterprises.**
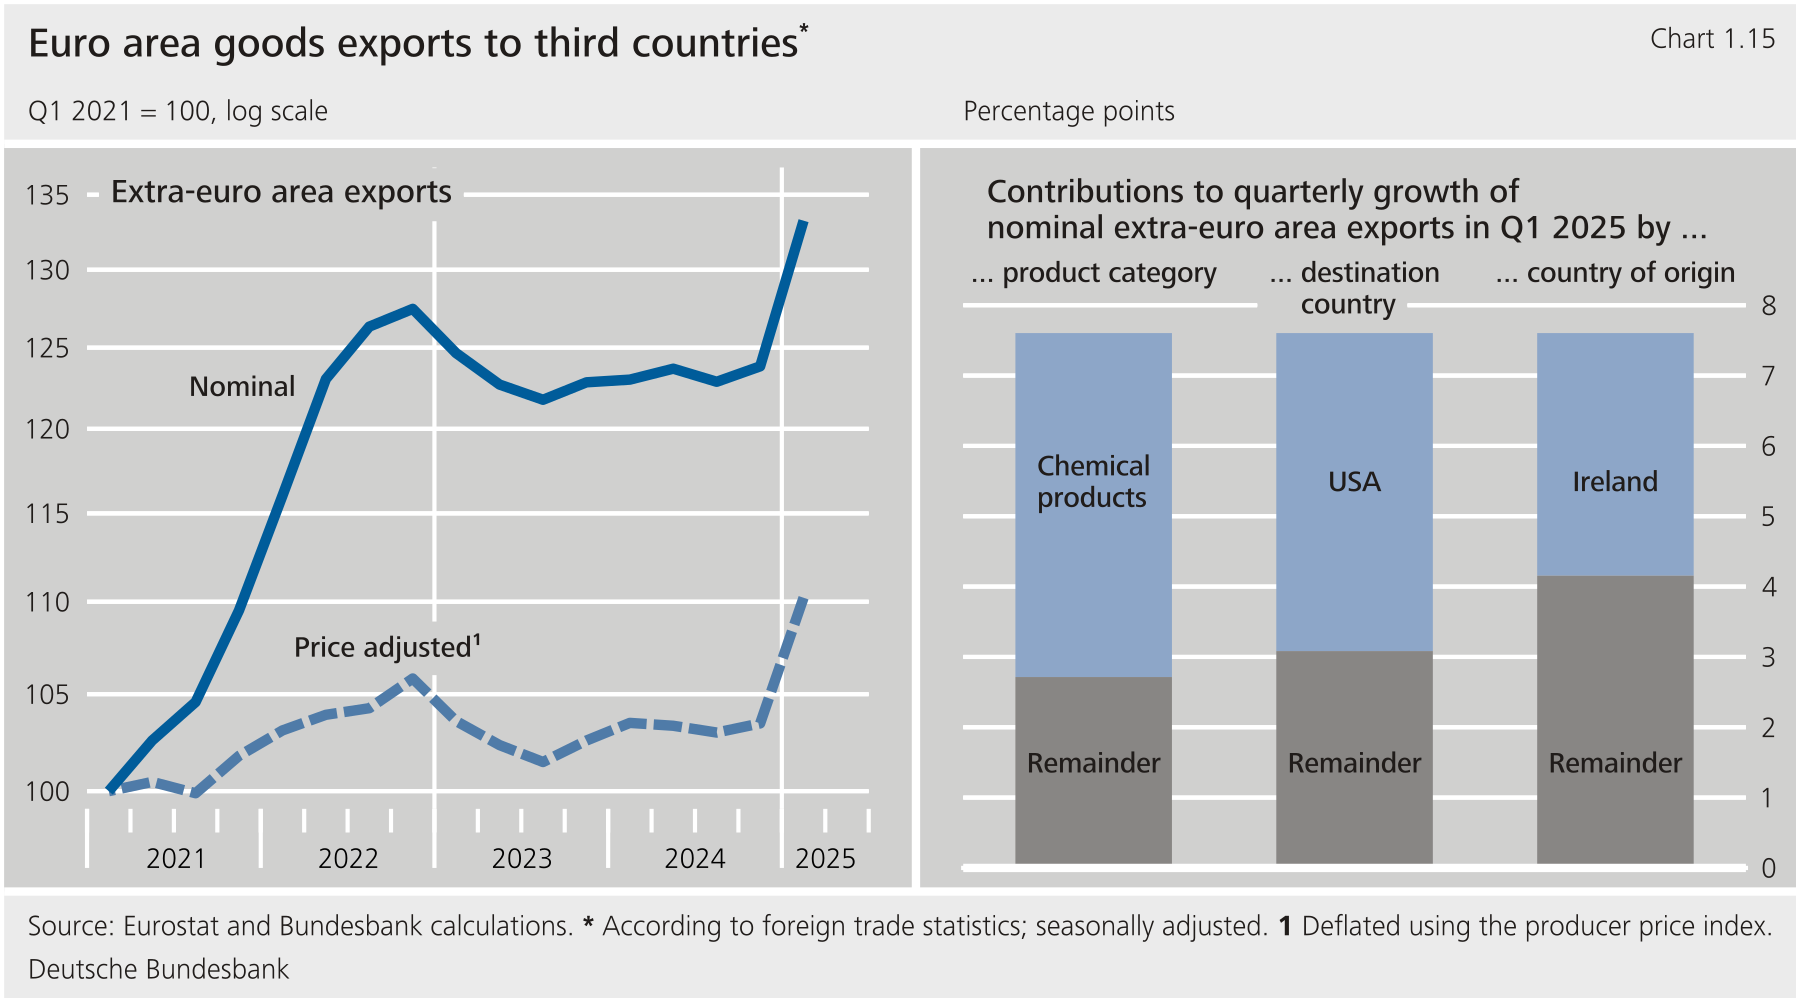
****Goods exports to third countries rose strongly according to trade statistics.** The rise was probably particularly pronounced in the area of intermediate goods. Exports of consumer goods appear to have also increased strongly. By contrast, exports of capital goods are set to have risen only slightly. Looking at the breakdown by country, exports to the United States increased in particular. Exports to Switzerland likewise rose sharply, whereas the increase in exports to China and the was less pronounced.[\[16\]](#_ftn_root_16) The buoyancy evident in exports to the United States is likely to be attributable to anticipatory effects due to the tariff announcements of the administration. This was particularly true of pharmaceutical products, particularly from Ireland. However, these transactions probably did not feed through fully into domestic value creation, for example if they went hand in hand with a destocking of inventories. Balance of payments data shows that euro area services exports rose strongly in the first two months of the year. Goods imports from third countries once again increased sharply on a price-adjusted basis. The increases were broad-based and probably extended to most goods categories.**{#par-ee992o}
{#par-u26uo3}
****
****The situation in the manufacturing industry improved somewhat.** In particular, the production of consumer goods rose significantly in the first quarter of the year; the production of intermediate and capital goods, too, rose markedly. The production of pharmaceutical goods increased strongly, presumably due to anticipatory effects in trade with the United States. Industrial capacity utilisation increased slightly but remained below its long-term average. According to surveys conducted by the European Commission, the assessment of new orders is once again approaching its long-term average, particularly in the case of capital goods. Price pressure at producer level increased once again. Producer and import prices rose markedly in a year-on-year comparison, above all because energy prices were much higher in the first quarter of 2025 than in the first quarter of the previous year.**{#par-o5ia74}
{#par-e31366}
**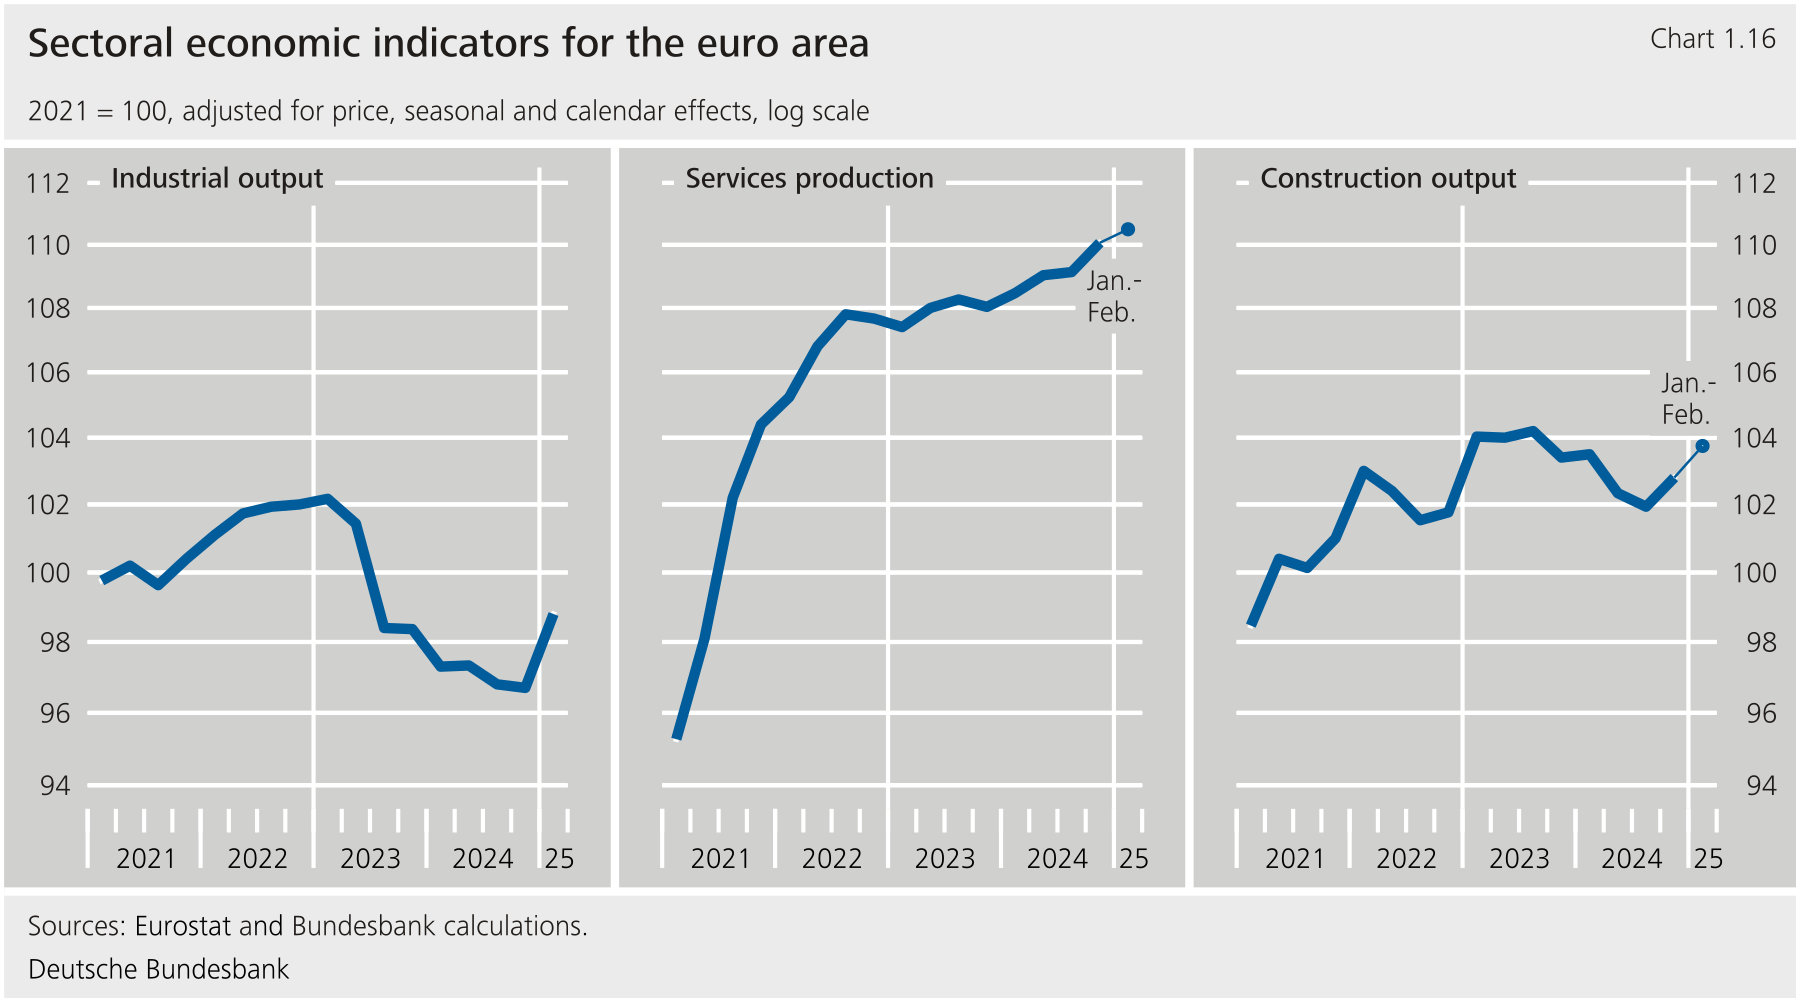**
****Momentum slackened somewhat in most branches of the services sector at the start of the year.** While there was evidence of continued expansion in the industry, as well as in transport and logistics, tourism appeared to have weakened. Business activity in the accommodation and food services sector has weakened at any rate. According to surveys conducted by the European Commission, a shortage of labour weighed on the services industry generally. However, companies have also recently complained about weak demand.**{#par-u48e14}
****Economic output picked up in most Member States in the first quarter of the year, but in some cases only moderately.** Anticipatory effects involving greater export activity to the United States were only significant in a few countries of the euro area, most notably Ireland. More important aspects are likely to have been the stabilisation of the manufacturing sector -- a trend that has been evident for some time now -- and a strengthening of construction activity in a number of countries. The deterioration in the accommodation and food services industry held back expansion in southern countries of the euro area.**{#par-u968e7}
****The French economy remained weak at the start of the year.** According to the initial estimate, real increased by a minuscule 0.1 % here. Private consumption continued to weaken, failing to surpass the figure recorded in the prior quarter. Corporate investment declined once again, particular in the areas of construction and equipment/machinery. Exports likewise declined whereas imports rose. According to the preliminary data available, the only significant positive growth contribution came from inventory restocking. On the output side, the decline in value creation in the construction industry continued. In manufacturing, by contrast, positive development was evident for the first time since the end of 2023. Business activity in the services sector picked up slightly.**{#par-o8a2u6}
{#par-o65ooi}
**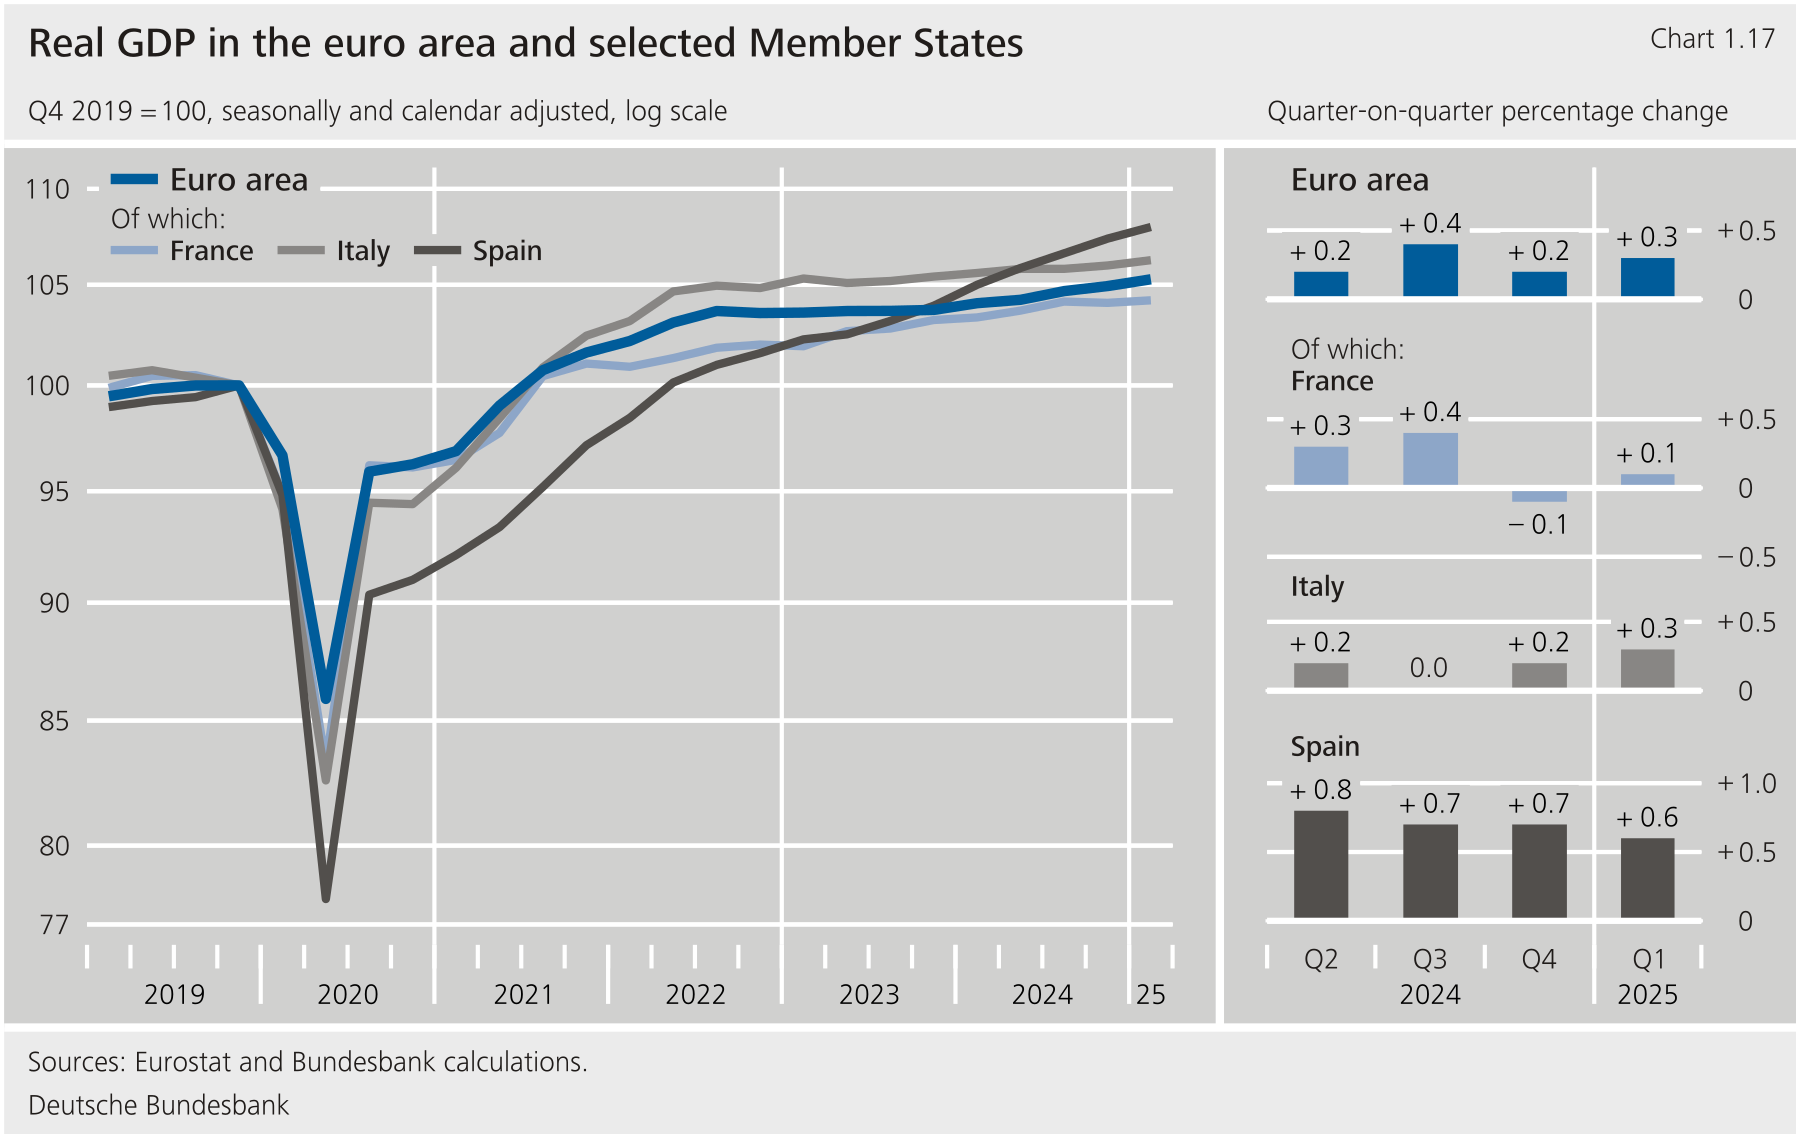**
****In Italy, economic output increased noticeably in the first quarter.** According to preliminary data, real rose by 0.3 %. Stimuli are likely to have come from goods exports, which benefited from greater foreign demand as well as tariff-related anticipatory effects. There was also evidence of a recovery in domestic demand. Private consumption can be expected to have risen thanks to higher real disposable income. In addition, corporate investment activity is likely to have strengthened, particularly in the construction area. Industrial production also recorded a rise. By contrast, services activity stagnated.**{#par-i2e11o}
****The upward trend in Spain persisted.** According to the initial estimate, real recorded a rise of 0.6 % in the first quarter of 2025. Growth remained broad-based. Private and government consumption both increased, as did corporate investment activity. As a result, imports picked up markedly, but there was also an increase in exports, particularly of services. On the output side, production was buoyant in the manufacturing sector in particular. Activity increased in services and the construction economy too, but growth rates were down on those of the prior quarter.**{#par-oe5819}
****The picture for the remaining Member States was mixed.** In Belgium, Lithuania and Cyprus, economic output increased distinctly. Growth continued to weaken in the Netherlands. Austria, Finland, Slovakia and Estonia all recorded slight increases. Real declined in Portugal following a particularly strong rise in the prior quarter. Economic activity likewise fell in Slovenia.**{#par-u19935}
****Overall, the labour market situation remained positive at the start of the year, but clouds are increasingly appearing.**The number of employed persons rose again in the first quarter, and the unemployment rate remained at a low of 6.2 %. However, the number of unemployed rose to some extent, above all in the larger countries of the euro area. Sentiment in the labour market continued to deteriorate. The employment expectations of companies have been worsening for several months now, while consumer surveys point to a rise in unemployment expectations. Wage growth can be expected to have weakened further in the first quarter of 2025, coming in at less than 4 % compared to the prior-year quarter.**{#par-uo2327}
****Consumer prices in the euro area picked up rather strongly in the first quarter of 2025.** The Harmonised Index of Consumer Prices () recorded a quarter-on-quarter rise of 0.8 % on a seasonally-adjusted basis, which was somewhat stronger than in the three previous quarters. Energy prices in particular went up distinctly for the first time in a while following a prolonged downward trend. Services inflation remained strong, even more so than in the fourth quarter. Regarding food, upward price pressure declined somewhat but remained moderate. For industrial products excluding energy, inflation remained at a low level.**{#par-ie5494}
****In a year-on-year comparison, the rate of inflation rose slightly to 2.3 %.** This was above all attributable to energy prices, which, in contrast to the two previous quarters, no longer made a negative contribution to headline inflation. In other areas, by contrast, price inflation either weakened slightly (services, food) or remained moderate (industrial goods excluding energy). As far as goods excluding energy are concerned, the disinflationary process appears to be largely complete. By contrast, services inflation proved high at 3.7 %. As a result, core inflation (excluding energy and food) stood at 2.6 %, which is well above the average of the last 25 years, despite having fallen for the second time in succession.**{#par-eu2i14}
{#par-i7e294}
**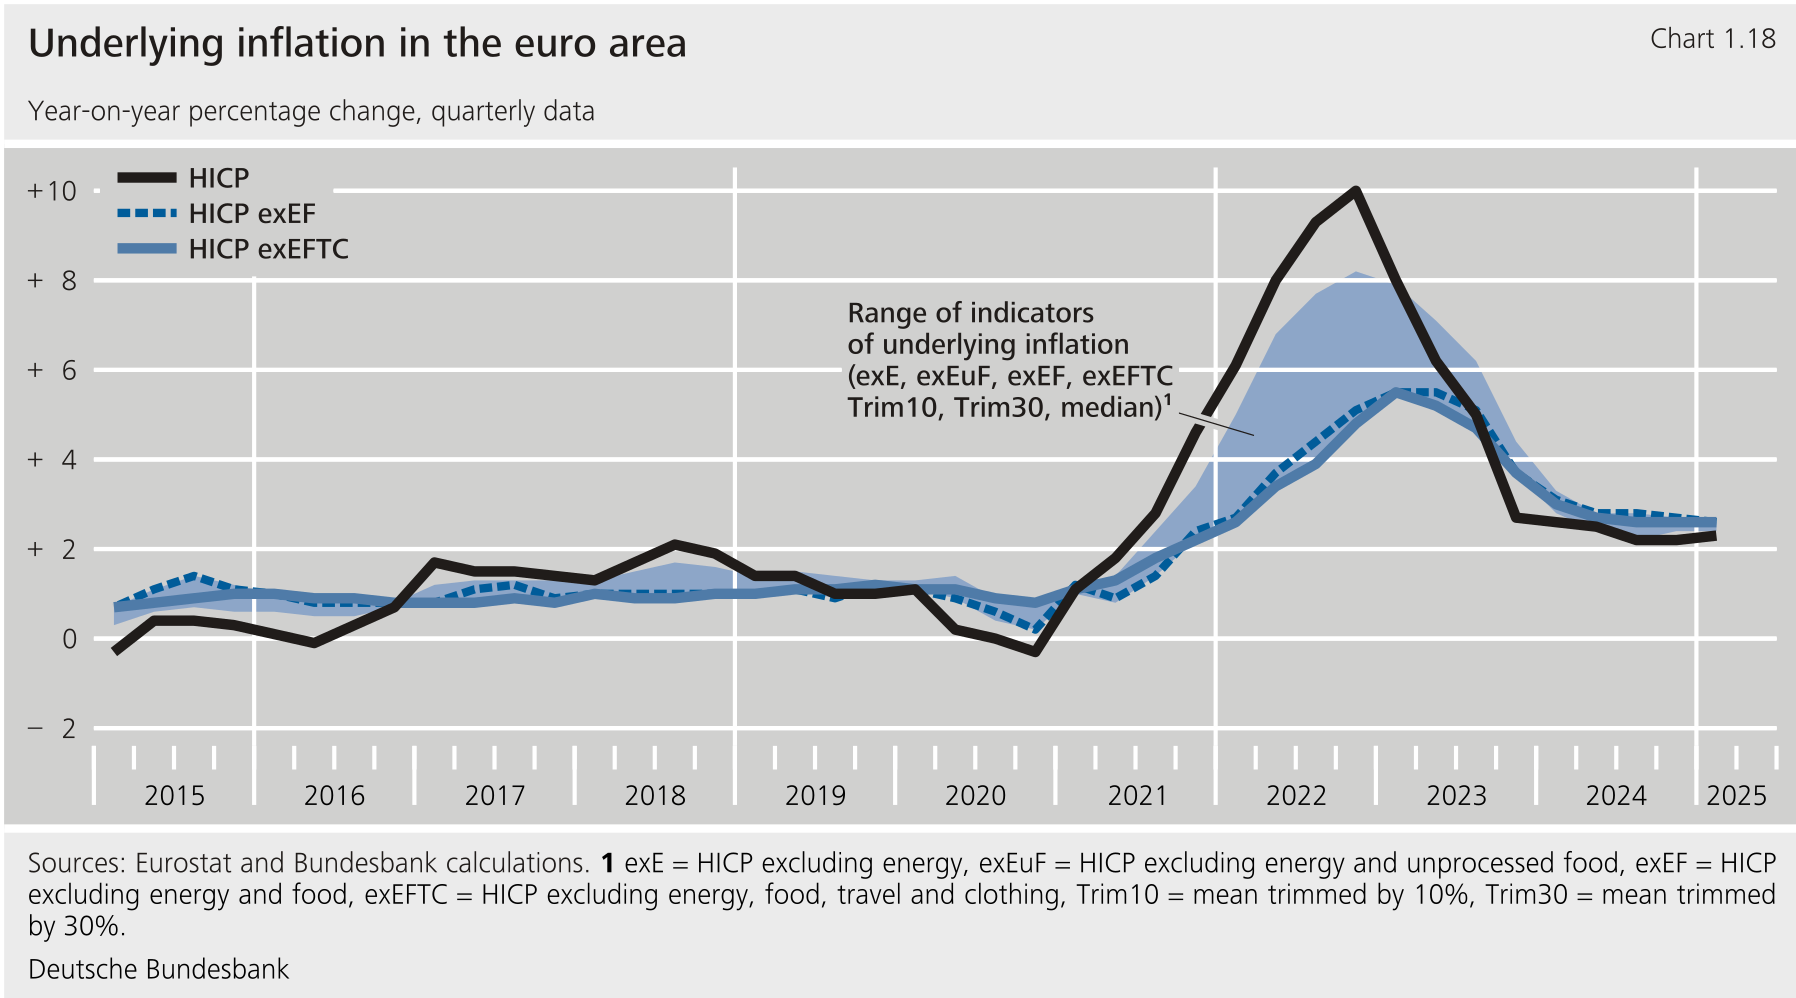**
****Headline inflation stayed put at 2.2 % in April 2025.** Price pressure in the services sector strengthened noticeably, above all due to higher prices of travel-related items over Easter. This had the effect of countering the sharp decline in energy prices, which was the result of the downward movement in international commodity markets. Industrial goods excluding energy and food once again appreciated in line with their historical average. Core inflation (i.e. excluding energy and food), which had declined to 2.4 % in March, rose sharply to 2.7 % due to strong inflation in services.**{#par-i92o93}
****The inflation outlook for the euro area is subject to heightened uncertainty.** Energy prices have recorded strong falls recently. One contributory factor here is the trade policy of the current administration. At the same time, the dollar depreciated against the euro. Whether these developments prove to be just short-term fluctuations or lasting changes remains to be seen. Generally speaking, lower energy prices and a stronger EUR/ exchange rate should bring down the rate of inflation, particularly in the area of energy and industrial goods excluding energy. On the other hand, an escalating tariff dispute with counter-tariffs from the on imports from the United States could strengthen price pressure at upstream production stages. Moreover, the measures of underlying inflation remain rather high, indicating persistent risks to the upside.[\[17\]](#_ftn_root_17) Where services are concerned, the disinflationary process essentially appears to be intact. Contributory factors here include declining wage increases and the lagged impact of restrictive monetary policy. However, the upward price pressure in the services sector experienced a surprisingly sharp rise in April. Price developments in this area in particular therefore need to be closely watched.**{#par-oo733e}
{#par-eaa554}
**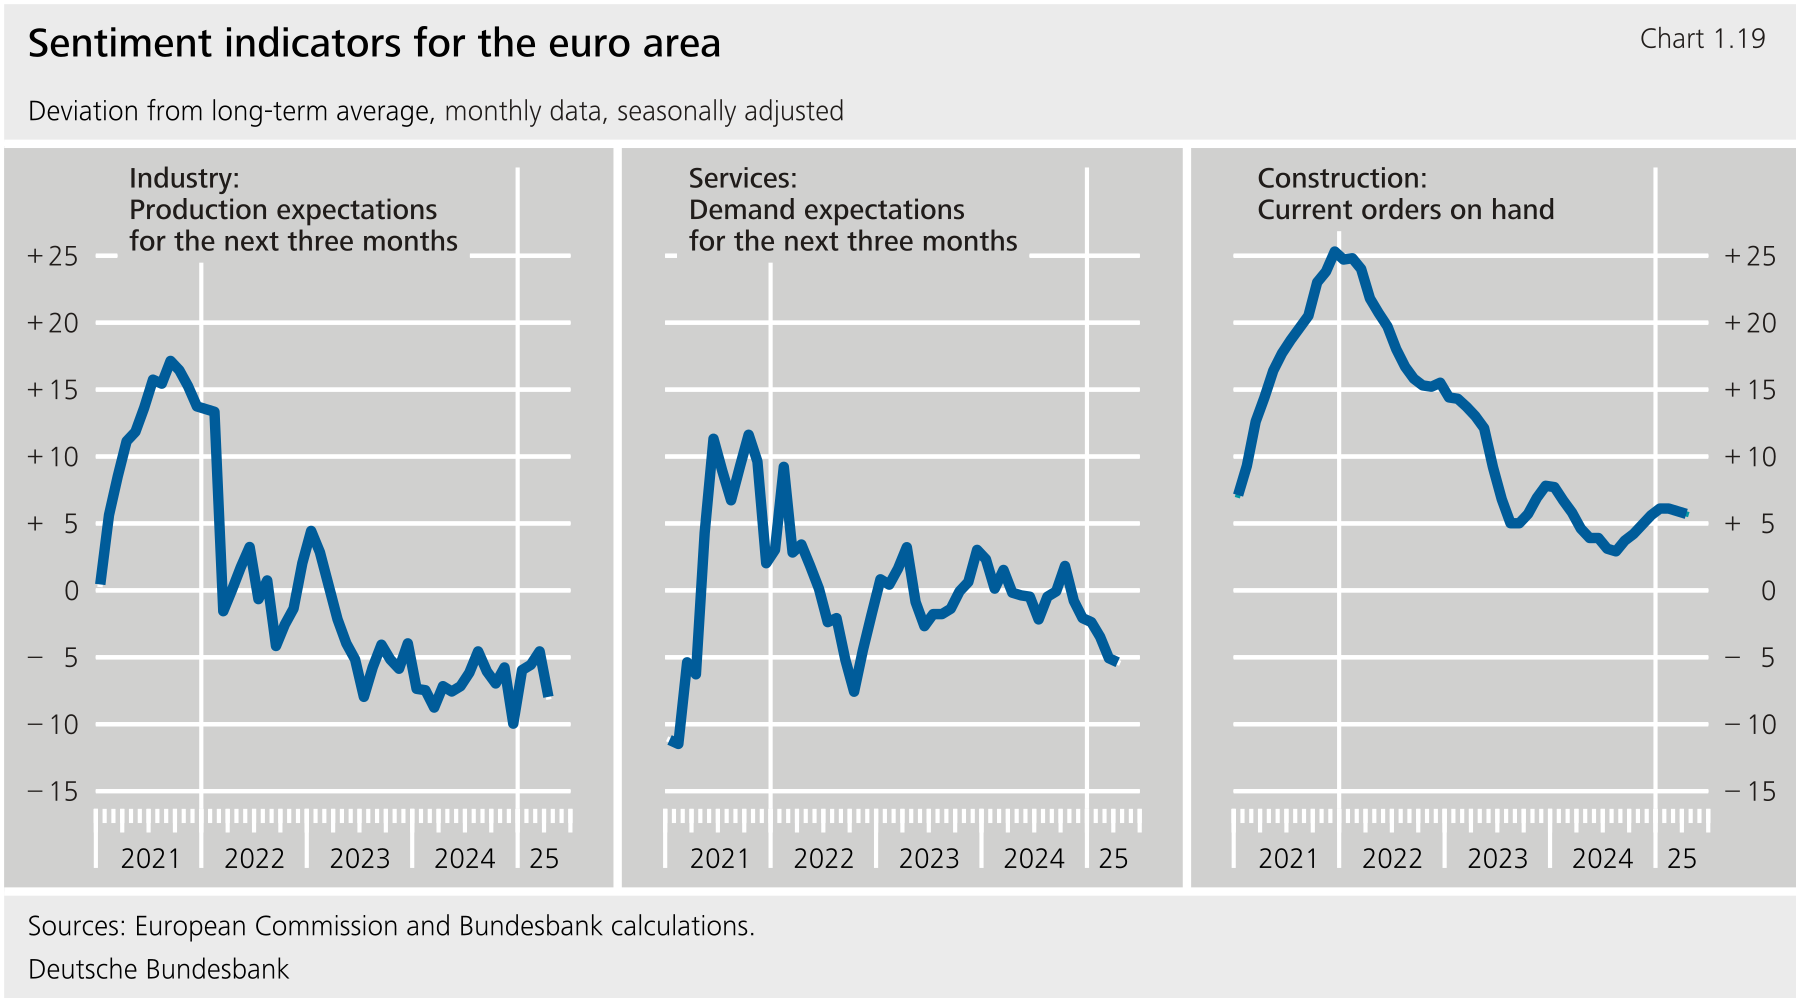**
****There is evidence of a weakening of** **growth in the euro area in the current quarter.** Where exports are concerned, there could once again be anticipatory effects in expectation of further tariff increases. However, countermovements are expected to ensue sooner or later. Furthermore, uncertainty over future foreign trade policy and the general economic policy direction of the United States and its consequences has also increased since the start of year. Studies show that a lasting rise in uncertainty could have a negative impact on corporate investment in particular (see the supplementary information entitled "[The macroeconomic effects of heightened uncertainty](#The-macroeconomic-effects-of-heightened-uncertainty)"). Consistent with this, production expectations in manufacturing have once again deteriorated, despite a more favourable order situation. The outlook for service providers has also deteriorated. Growth in private consumption can be expected to slow in view of weaker increases in real incomes and high uncertainty. At any rate, consumer confidence has fallen well below its long-term average since February. On the other hand, more favourable financing terms and lower commodity prices are likely to have a supporting effect. Although tangible direct growth stimuli can only be expected to materialise from the announced defence and infrastructure expenditure programmes in the medium term, they may contribute to the stabilisation of expectations in the current year. All in all, therefore, economic output in the euro area is likely to rise only modestly in both the current and the following quarter.**{#par-u91975}
***This article is based on data available up to 20 May 2025, 11:00.***{#par-a87187}
**Bibliography** {#tar-6}
-------------------------
**Amiti, M., S. J. Redding and D. E. Weinstein (2020), [Who's Paying for the Tariffs? A Longer-Term Perspective, American Economic Association](https://www.aeaweb.org/articles?id=10.1257/pandp.20201018), Papers and Proceedings, Vol. 110, pp. 541 -- 546.**{#par-ea12ee}
**Banca d'Italia (2024), [Survey of Industrial and Service Firms in 2023: Main results](https://www.bancaditalia.it/pubblicazioni/indagine-imprese/2023-indagini-imprese/en_statistiche_IIS_28062024.pdf?language_id=1), Statistics, June 2024.**{#par-ue1294}
**Banco de España (2025), [Adoption of artificial intelligence in Spanish firms: an initial analysis based on the Banco de España Business Activity Survey,](https://www.bde.es/f/webbe/SES/Secciones/Publicaciones/InformesBoletinesRevistas/BoletinEconomico/25/T2/Files/be2502-art06e.pdf) Economic Bulletin, 2025/Q2, Article 6.**{#par-eo8348}
**Bernard, S., L. de Greef, I. Hurst, A. I. Kaya, I. Liadze and B. Naisbitt (2024), [The Effects of Higher Tariffs](https://niesr.ac.uk/publications/effects-higher-us-tariffs?type=global-economic-outlook-topical-feature), National Institute of Economic and Social Research, Global Economic Outlook Topical Feature, October 2024, pp. 64 -- 77.**{#par-oi8i56}
**Bloom, N. (2009), [The Impact of Uncertainty Shocks](https://onlinelibrary.wiley.com/doi/epdf/10.3982/ECTA6248), Econometrica, Vol. 77(3), pp. 623 -- 685.**{#par-eee285}
**Bureau of Economic Analysis (2025), [Gross Domestic Product, 1st Quarter 2025 (Advance Estimate)](https://www.bea.gov/news/2025/gross-domestic-product-1st-quarter-2025-advance-estimate), News Release, 30 April 2025.**{#par-oe7388}
**Caldara, D., M. Iacoviello, P. Molligo, A. Prestipino and A. Raffo (2020), [The economic effects of trade policy uncertainty](https://www.sciencedirect.com/science/article/pii/S0304393219302004), Journal of Monetary Economics, Vol. 109, pp 38 -- 59.**{#par-o8e432}
**Cavallo, A., P. Llamas and F. Vazquez (2025), [Tracking the Short-Run Price Impact of U.S. Tariffs](https://pricinglab-rw7gfm.s3.us-east-1.amazonaws.com/tariffs/TrackingTariffs_Cavallo_Llamas_Vazquez.pdf), Harvard Business School: Faculty \& Research, Working Paper, May 2025.**{#par-o5634o}
**Clark, H. L. (2025), [U.S. Imports from China Have Fallen by Less Than U.S. Data Indicate](https://libertystreeteconomics.newyorkfed.org/2025/02/u-s-imports-from-china-have-fallen-by-less-than-u-s-data-indicate/), Federal Reserve Bank of New York, Liberty Streets Economics Blog, 26 February 2025**{#par-e62u4o}
**Deutsche Bundesbank (2024a), [Forecast for Germany: Significantly gloomier growth outlook -- inflation decreases to 2%](https://publikationen.bundesbank.de/content/947278), Monthly Report, December 2024.**{#par-eu7uo3}
**Deutsche Bundesbank (2024b), [German enterprises' profitability and financing in 2023 during the period of monetary policy tightening](https://publikationen.bundesbank.de/content/947298), Monthly Report, December 2024.**{#par-eo6i88}
**Deutsche Bundesbank (2021), [The slowdown in euro area productivity growth](https://www.bundesbank.de/content/858448), Monthly Report, January 2021, pp. 15 -- 46.**{#par-e678i9}
**Deutsche Bundesbank (2020), [Consequences of increasing protectionism](https://www.bundesbank.de/content/822438), Monthly Report, January 2020, pp. 45 -- 66.**{#par-o4a868}
**Deutsche Bundesbank (2018a), [The macroeconomic impact of uncertainty](https://www.bundesbank.de/content/766596), Monthly Report, October 2018, pp. 49 -- 64.**{#par-ae3oi7}
**Deutsche Bundesbank (2018b), [Activities of multinational enterprise groups and national economic statistics](https://www.bundesbank.de/content/766598), Monthly Report, October 2018, pp. 65 -- 78.**{#par-aeu7oo}
**European Central Bank (2025), [The implications of -China trade tensions for the euro area -- lessons from the tariffs imposed by the first Trump Administration](https://www.ecb.europa.eu/press/economic-bulletin/focus/2025/html/ecb.ebbox202503_02~b2916b44db.en.html), Economic Bulletin, Issue 3/2025, pp. 49 -- 55.**{#par-eo9u32}
**Freund, C., A. Mattoo, A. Mulabdic and M. Ruta (2024), [Is trade policy reshaping global supply chains?](https://www.sciencedirect.com/science/article/pii/S0022199624001387), Journal of International Economics, Vol. 152.**{#par-ui5675}
**Ghirelli, C., J. J. Pérez and A. Urtasun (2019), [A new economic policy uncertainty index for Spain](https://www.sciencedirect.com/science/article/pii/S0165176519301806), Economics Letters, Vol. 182, pp. 64 -- 67.**{#par-u1e41o}
**Handley, K. and N. Limão (2022), [Trade Policy Uncertainty](https://www.annualreviews.org/docserver/fulltext/economics/14/1/annurev-economics-021622-020416.pdf?expires=1747215893&id=id&accname=ar-517335&checksum=67362376CD77D624DE958C0116651BE2), Annual Review of Economics, Vol. 14, pp. 363 -- 395.**{#par-i31ui8}
**Handley, K. and J. F. Li (2020), [Measuring the Effects of Firm Uncertainty on Economic Activity: New Evidence from One Million Documents](https://www.nber.org/system/files/working_papers/w27896/w27896.pdf), National Bureau of Economic Research Working Paper 27896.**{#par-u74o71}
**Hantzsche, A., M. Lopresto and G. Young (2018), [Using NiGEM in uncertain times: Introduction and overview of NiGEM](https://niesr.ac.uk/publications/using-nigem-uncertain-times-introduction-and-overview-nigem?type=national-institute-economic-review), National Institute of Economic and Social Research, National Institute Economic Review, Vol. 244, pp. R1 -- R14.**{#par-e4o2i1}
**Hinz, J., I. Méjean and M. Schularick (2025), [The consequences of the Trump trade war for Europe](https://www.ifw-kiel.de/fileadmin/Dateiverwaltung/IfW-Publications/fis-import/ffae0535-8479-456b-bc1c-cb8fc3d1ea6c-PB_Response_Trump_Tariffs-3.pdf), Kiel Institute for the World Economy, Kiel Policy Brief, no. 190.**{#par-u4a374}
**International Energy Agency (2025), [Oil Market Report](https://www.iea.org/reports/oil-market-report-april-2025), April 2025.**{#par-aa93i6}
**International Monetary Fund (2025), [World Economic Outlook: A Critical Juncture amid Policy Shifts](https://www.imf.org/en/Publications/WEO/Issues/2025/04/22/world-economic-outlook-april-2025), April 2025.**{#par-aou38a}
**Jurado, K., S. C. Ludvigson and S. Ng (2015), [Measuring Uncertainty](https://pubs.aeaweb.org/doi/pdfplus/10.1257/aer.20131193), American Economic Review, Vol. 105(3), pp. 1177 -- 1216.**{#par-ao1e19}
**Krippner, L. (2013), [Measuring the stance of monetary policy in zero lower bound environments](https://www.sciencedirect.com/science/article/pii/S016517651200554X), Economics Letters, Vol. 118(1), pp. 135 -- 138.**{#par-e963a9}
**Ludvigson, S. C., S. Ma and S. Ng (2021), [Uncertainty and Business Cycles: Exogenous Impulse or Endogenous Response?](https://www.aeaweb.org/articles?id=10.1257/mac.20190171), American Economic Journal: Macroeconomics, Vol. 13(4), pp. 369 -- 410.**{#par-o11a16}
**Meinen, P. and O. Röhe (2018), [To sign or not to sign? On the response of prices to financial and uncertainty shocks](https://www.sciencedirect.com/science/article/pii/S0165176518303057), Economics Letters, Vol. 171, pp. 189 -- 192.**{#par-a1u73e}
**The White House (2025), [Regulating Imports with a Reciprocal Tariff to Rectify Trade Practices that Contribute to Large and Persistent Annual United States Goods Trade Deficits, Executive Order, 2 April 2025.](https://www.whitehouse.gov/presidential-actions/2025/04/regulating-imports-with-a-reciprocal-tariff-to-rectify-trade-practices-that-contribute-to-large-and-persistent-annual-united-states-goods-trade-deficits/), Executive Order, 2 April 2025.**{#par-iee37a}
**World Trade Organization (2025), [Global Trade Outlook and Statistics](https://www.wto.org/english/res_e/booksp_e/trade_outlook25_e.pdf), April 2025.**{#par-o68iae}
1. **{#_ftn_root_1} For example, the majority of goods exported to the United States from the could face a tariff increase of 20 percentage points in the future. A number of other economies are threatened with even higher additional tariffs. These so-called "reciprocal" tariffs are intended to address the persistently high trade deficit of the United States, which in the eyes of the current administration originate from both tariff-based and non-tariff-based trade barriers. See The White House (2025).**
2. **{#_ftn_root_2} See International Energy Agency (2025).**
3. **{#_ftn_root_3} Discussions are currently underway at the level to relax the requirement for European gas storage facilities to be at least 90 % full on 1 November of each year. This is likely to reduce demand -- and therefore prices -- during the summer season, which is when gas storage tanks are filled.**
4. **{#_ftn_root_4} See International Monetary Fund (2025).**
5. **{#_ftn_root_5} At last count, nearly one-fifth of all Indian exports went to the United States.**
6. **{#_ftn_root_6} The seasonally adjusted rate of change has not been officially reported yet. According to Bundesbank seasonal adjustment, was down by 1.3 % from the final quarter of 2024.**
7. **{#_ftn_root_7} The actual development of inventory investment over the course of the winter quarter cannot yet be definitively assessed. Due to the difficult data situation, the responsible statistical office used estimates, particularly for March; see Bureau of Economic Analysis (2025). As the national accounts are calculated only on the demand side for earlier estimates, imports arithmetically reduce if the corresponding figures are not offset by additional consumption, including inventories.**
8. **{#_ftn_root_8} See Amiti et al. (2020).**
9. **{#_ftn_root_9} High-frequency data on the sales prices of tariff-affected products in the online offerings of major retailers are already indicating the first -- albeit modest -- price rises. See Cavallo et al. (2025).**
10. **{#_ftn_root_10} Although the negotiations relate to only a small proportion of Japanese employees, they have an important signalling effect for wage development in the economy at large.**
11. **{#_ftn_root_11} Companies have had to pay higher social security contributions since April.**
12. **{#_ftn_root_12} Among other things, the agreement envisages the import tariff for the first 100,000 cars exported to the United States falling from 27.5 % to 10 %. Additional tariffs for steel and aluminium are to be scrapped altogether. However, the base tariff is to remain in place at 10 %. As a result, the tariff burden for exports to the United States is still much higher than it was before the beginning of the second Trump administration.**
13. **{#_ftn_root_13} The statistical reporting of in Ireland is heavily influenced by the activities of multinational companies. See Deutsche Bundesbank (2018b).**
14. **{#_ftn_root_14} These appear to have been a growth driver for Irish in particular. Here the prior-quarter figure was exceeded by 3.2 %.**
15. **{#_ftn_root_15} Excluding Ireland. The statistical reporting of corporate investment overall, but particularly in the area of intellectual property, has been heavily influenced by the activities of multinational companies for many years now. See Deutsche Bundesbank (2018b).**
16. **{#_ftn_root_16} The United States has become the most important export destination for the euro area in recent years. In 2024, the accounted for 17 % of all extra-euro area exports, followed by the at 10 % and China at 7 %.**
17. **{#_ftn_root_17} See the supplementary information entitled "[The German economy](https://publikationen.bundesbank.de/content/957532)".**
*[HICP]: Harmonised Index of Consumer Prices
*[GDP]: gross domestic product
*[OECD]: Organisation for Economic Co-operation and Development
*[WTO]: World Trade Organization
*[UK]: United Kingdom
*[CISS]: composite indicator of systemic sress
*[OPEC]: Organization of the Petroleum Exporting Countries
*[US]: United States
*[USA]: United States
*[IMF]: International Monetary Fund
*[ECB]: European Central Bank
*[Eurostat]: European Union
*[USD]: United States dollar
*[AI]: artificial intelligence
*[**GDP**]: gross domestic product
*[IT]: information technology
*[EU]: European Union
*[NACE]: Nomenclature générale des activités économiques dans les Communautés européennes
*[**AI**]: artificial intelligence
*[SVAR]: structural vector autoregression
*[S\&P]: Standard & Poor’s
*[**UK**]: United Kingdom
*[**IMF**]: International Monetary Fund
*[ICT]: information and communications technology
*[**US**]: United States