# Annex
I. and climate metrics: background information and methods
----------------------------------------------------------
### **"Carbon" as a synonym for**
In this report, "carbon" is used as a synonym for emissions, in line with widespread use in the area of metrics. However, the term "carbon" is misleading, as the metrics do not cover carbon dioxide (CO**~2~** ) alone but also other within the meaning of the Kyoto Protocol, such as methane (**~4~** ) and nitrous oxide (N**~2~**O).
{#par-i3585e}{#par-o4o728}{#par-a679au}{#par-a44291}{#par-ia1ieu}
| | **Share of global emissions (expressed as CO~2~e)** [^\[1\]^](#_ftn_root_1) | **Examples of key sources** |
| **Carbon dioxide (CO~2~)** | 73.6 % | * Burning of fossil fuels * Manufacture of cement |
| **Methane** (**~4~)** | 17.7 % | * Agriculture: cattle farming * Natural gas: leaks during extraction, transport |
| **Nitrous oxide (N~2~O)** | 6.2 % | * Agriculture: use of fertilisers |
| **Other** | 2.6 % | |
|----------------------------|-----------------------------------------------------------------------------|---------------------------------------------------------------------------------|
{#par-eueia9}
### **CO~2~e as a unit for**
The various are measured by their or warming effects in CO~2~e or tCO~2~e.
### **Quantities of** **emissions worldwide and in Germany**
Annual global emissions are around 50 billion tCO~2~e.[**^\[2\]^**](#_ftn_root_2) In Germany, they amount to around 760 million tCO~2~e. This means that average per capita emissions in Germany are just under 9 tCO~2~e.
{#par-uuo359}
II. and climate metrics on the euro portfolio and bonds issued by promotional and development banks
---------------------------------------------------------------------------------------------------
### **Source of** **data**
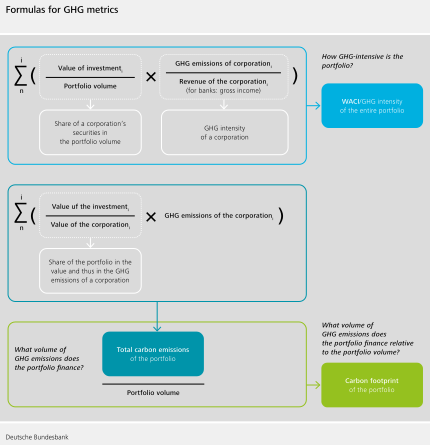
To calculate metrics for Bundesbank investments in banks, data derived from the banks' disclosures (e.g. sustainability reports) are used. The Bundesbank obtains relevant data from the data provider . When calculating metrics, the Bundesbank does not use data on emissions modelled or estimated by data providers.[**\[3\]**](#_ftn_root_3)
### **Lead times for** **data and retroactive updates of** **metrics from previous portfolio reference dates**
In principle, the aim is to ensure that portfolio holdings and data relate to the same year, data availability permitting. However, for the reporting dates of both 31 December 2023 and 31 December 2024, the metrics are based on data on banks' emissions in 2023. These were the latest available data when this report was prepared, which is why they were also used for the portfolio reference date of 31 December 2024. For next year's climate-related disclosures, the plan is to retroactively adjust these calculations using data for 2024. Following the same principle, the calculations as at 31 December 2023 reported in this document have been adjusted to reflect the data for 2023 (having been based on the 2022 data in last year's disclosures).
{#par-eo4i56}{#par-a71ei4}{#par-i5uueo}{#par-i831oi}
| **Scope 1, 2 and 3** **emissions** |||
| **Category** | **Comprises** | **Examples of sectors with comparatively high emissions** |
| **Scope 1** | Direct emissions | * Electricity producers * Producers of cement, steel * Airlines |
| **Scope 2** | Indirect emissions from the production of purchased energy (primarily electricity) | * Heavy industry * Chemical companies |
| **Scope 3** | ||
| **Upstream**{#par-a14u8a} | Indirect emissions along the value chain (except scope 2) | * Retail * Food companies |
| **Downstream**{#par-e87849} | Indirect emissions along the value chain (except scope 2) | * Oil and gas producers * Manufacturers of cars, aircraft * Banks |
|-----------------------------|------------------------------------------------------------------------------------|-------------------------------------------------------------------|
{#par-au367o}{#par-u41a68}
III. and climate metrics for sovereign investments
--------------------------------------------------
### **Sources and measurement approaches for** **data**
The data on sovereigns used in this report are mostly obtained from the United Nations Framework Convention on Climate Change () data interface, where the lists data recorded by sovereigns and reported to the . In cases where no recent data are available for a given sovereign in the data interface, data from the World Resources Institute () modelled for this report are used. The data are obtained using the production-based, or territorial, measurement approach: sovereigns are assigned those emissions that occur within their borders or in their jurisdiction. {#par-o8841i}
Production-based/territorial emissions are also used for sub-sovereigns or federation members/regions. The respective national authorities (e.g. statistical offices) serve as data sources.{#par-eo5728}
data based on the consumption-based measurement approach are not yet included in this report. This approach draws on foreign trade data. Unlike in the production-based approach, sovereigns are not allocated emissions from exported goods but are additionally allocated emissions from imported goods. However, a number of consumption-based methods have so far led to -- in some cases -- large discrepancies in levels. This report therefore focuses on the well-established production-based approach. {#par-u71uao}
### **Lead times for** **data and retroactive updates of** **metrics from previous portfolio reference dates**
In principle, the aim is to ensure that portfolio holdings and data relate to the same year, data availability permitting. However, data on sovereigns have longer lead times than data on companies. At the time of reporting, the majority of the latest available data refer to 2022 or 2023. In most cases, then, the data merely serve as a provisional basis for the metrics as at the portfolio reference dates of 31 December 2023 and 31 December 2024. To nonetheless provide a meaningful picture of developments in sovereigns' profiles over time, longer periods are considered for the metrics (, total carbon emissions and carbon footprint) than for amounts that are not invested in sovereigns.
### **as a** **sector**
Measurements of sovereign emissions often differ in whether they include the land use, land use change, and forestry () sector. For example, can be a major -- and sometimes the largest -- source of in densely wooded regions given deforestation. By contrast, reforestation may lead to negative emissions, resulting in an improved profile. then constitute sinks.{#par-eo644u}
thus play an important role in many national and international climate objectives. However, in view of the complicated accounting of , climate researchers still have reservations concerning the quality and comparability of such data. {#par-oaa443}
The metrics in this report are shown both with and without .{#par-oa8e83}
### **Methodological caveats concerning the total carbon emissions and carbon footprint of sovereign investments**
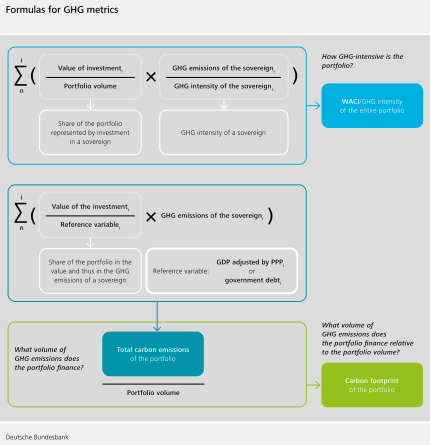
The methods for calculating the total carbon emissions and carbon footprint are not as well established for investments in sovereigns as they are for investments in companies. Methodological challenges notably include adequately capturing which sovereign shares and thus which emissions are financed by investments in the portfolio. {#par-u4ea5e}
Early climate-related disclosures often took **sovereign debt** as the reference variable. Government bonds (held in a portfolio) do indeed account for a part of sovereign debt. However, sovereigns and their emissions are not financed through sovereign debt alone. Under this approach, the financed emissions would therefore be overstated.{#par-u8aa3u}
The recommends using adjusted by as the reference variable instead. Unlike sovereign debt, adjusted by is clearly related to a sovereign's emissions. However, the relationship between government bonds (held in a portfolio) and adjusted by is unclear.{#par-a2241a}
Both approaches therefore have substantial downsides. Despite these reservations, this report includes the total carbon emissions and carbon footprint based on both approaches in order to contribute to the discussion of methodological developments and to identify differences in results.{#par-ai9a87}
### **Production volumes of fossil fuels: methodology for the indicators**
Production volumes of coal, crude oil and natural gas are measured by energy content in terajoules (),[**\[4\]**](#_ftn_root_4) and are set in relation to the size of the economy ( adjusted by ), analogously to the methodology. Weighted averages of the intensity of coal, crude oil and natural gas production volumes are calculated for sovereign investments on this basis.
{#par-a6627i}
IV. The Eurosystem's monetary policy holdings -- additional metrics
-------------------------------------------------------------------
{#par-uu3915}{#par-uo642e}{#par-au4194}{#par-iu85uu}{#par-iu5i4i}{#par-u5963u}
|---|---|-------------|--------------------------|--------------------------|---------------------------|---------------------------|---------------------------|
| Table 7: Covered bonds in monetary policy and portfolios: scope 3 metrics ||||||||
| ||| **Portfolio as at:** |||||
| ||| **31.12.2020** | **31.12.2021** | **31.12.2022** | **31.12.2023** | **31.12.2024** |
| **of Bundesbank share** (in tCO~2~e/€mn of gross income) || **Scope 3** | **454** *(86 %)* | **797** *(92 %)* | **1,587** *(94 %)* | **1,78** *(93 %)* | **1,725** *(96 %)* |
| **Total carbon emissions of Bundesbank share** (in tCO~2~e) || **Scope 3** | **3.7 million** *(83 %)* | **8.6 million** *(88 %)* | **18.1 million** *(89 %)* | **28.1 million** *(90 %)* | **23.7 million** *(93 %)* |
| **Carbon footprint of Bundesbank share** (in tCO~2~e/€mn of investment) || **Scope 3** | **59** *(83 %)* | **124** *(88 %)* | **254** *(89 %)* | **409** *(90 %)* | **370** *(93 %)* |
{#par-i9e954}{#par-ui1u47}{#par-eo1o56}{#par-ee5475}{#par-e2769e}{#par-o5o643}{#par-a56356}
|-------------------------------------------------------------------------|-------------|---------------------------|---------------------------|---------------------------|---------------------------|---------------------------|
| Table 8: Corporate bonds in monetary policy and portfolios: scope 3 metrics |||||||
| || **Portfolio as at:** |||||
| || **31.12.2020** | **31.12.2021** | **31.12.2022** | **31.12.2023** | **31.12.2024** |
| **of Bundesbank share** (in tCO~2~e/€mn of gross income) | **Scope 3** | **1,414** *(98 %)* | **1,344** *(99 %)* | **1,077** *(97 %)* | **1,201** *(97 %)* | **1,237** *(94 %)* |
| **Total carbon emissions of Bundesbank share** (in tCO~2~e) | **Scope 3** | **71.2 million** *(96 %)* | **77.6 million** *(95 %)* | **88.6 million** *(96 %)* | **78.3 million** *(96 %)* | **65.3 million** *(92 %)* |
| **Carbon footprint of Bundesbank share** (in tCO~2~e/€mn of investment) | **Scope 3** | **980** *(96 %)* | **894** *(95 %)* | **912** *(96 %)* | **853** *(96 %)* | **803** *(92 %)* |
{#par-a3ai37}
1. {#_ftn_root_1}[World Resources Institute (WRI) data](https://www.wri.org/insights/4-charts-explain-greenhouse-gas-emissions-countries-and-sectors) on global emissions in 2021.
2. {#_ftn_root_2}[World Resources Institute (WRI) data](https://www.wri.org/insights/4-charts-explain-greenhouse-gas-emissions-countries-and-sectors) on global emissions in 2021.
3. {#_ftn_root_3}This results in lower data coverage than would be the case if data providers' modelled data were included. However, depending on the methodology used by the data providers, such data may exhibit larger deviations from each other and from actual emissions, especially for banks. Data uncertainty is significantly greater here than, say, in the case of modelled data on sovereigns for which macroeconomic data can be used as a modelling basis.
4. {#_ftn_root_4}In accordance with the International Energy Agency ()'s standard for countries' energy balances.
*[UNFCCC]: United Nations Framework Convention on Climate Change)
*[IEA]: International Energy Agency
*[CH]: Kohlenwasserstoff
*[GHG]: Greenhouse Gas
*[ISS]: Institutional Shareholder Services
*[GHGs]: Greenhouse Gases
*[WRI]: World Resources Institute
*[PEPP]: pandemic emergency purchase programme
*[**WACI**]: Weighted Average Carbon Intensity
*[PPP]: public-private partnership
*[GDP]: gross domestic product
*[LULUCF]: Land Use, Land-Use Change and Forestry
*[TJ]: Terajoule
*[ESG]: environmental, social and governance
*[WACI]: Weighted Average Carbon Intensity
*[**LULUCF**]: Land Use, Land-Use Change and Forestry
*[CBPP3]: third covered bond purchase programme
*[**GHG**]: Greenhouse Gas
*[PCAF]: Partnership for Carbon Accounting Financials
*[**CH**]: Kohlenwasserstoff