# What’s behind the sustained decline in German export market shares?
* [*1 Recent weakness in exports and losses in market share*](#tar-1 "1 Recent weakness in exports and losses in market share")
* *[*2 Adverse developments in key competitiveness factors*](#tar-2 "2 Adverse developments in key competitiveness factors")*
* **[*among key categories of goods and trading partners*](#tar-3 "among key categories of goods and trading partners")**
* ***[*4 New empirical findings on the drivers behind Germany's export market losses*](#tar-4 "4 New empirical findings on the drivers behind Germany’s export market losses")***
* ***[*Decomposing changes in export market shares -- detailed methodology*](#tar-5 "Decomposing changes in export market shares – detailed methodology")***
* ***[*5 Majority of market share losses due to reduced competitiveness*](#tar-6 "5 Majority of market share losses due to reduced competitiveness")***
* ***[*6 Patterns of market share losses with indications of economic determinants*](#tar-7 "6 Patterns of market share losses with indications of economic determinants")***
* ***[*7 Germany's recent losses in competitiveness are considerable by comparison with other countries*](#tar-8 "7 Germany’s recent losses in competitiveness are considerable by comparison with other countries")***
* ***[*8 Conclusion*](#tar-9 "8 Conclusion")***
* ***[*9 List of references*](#tar-10 "9 List of references")***
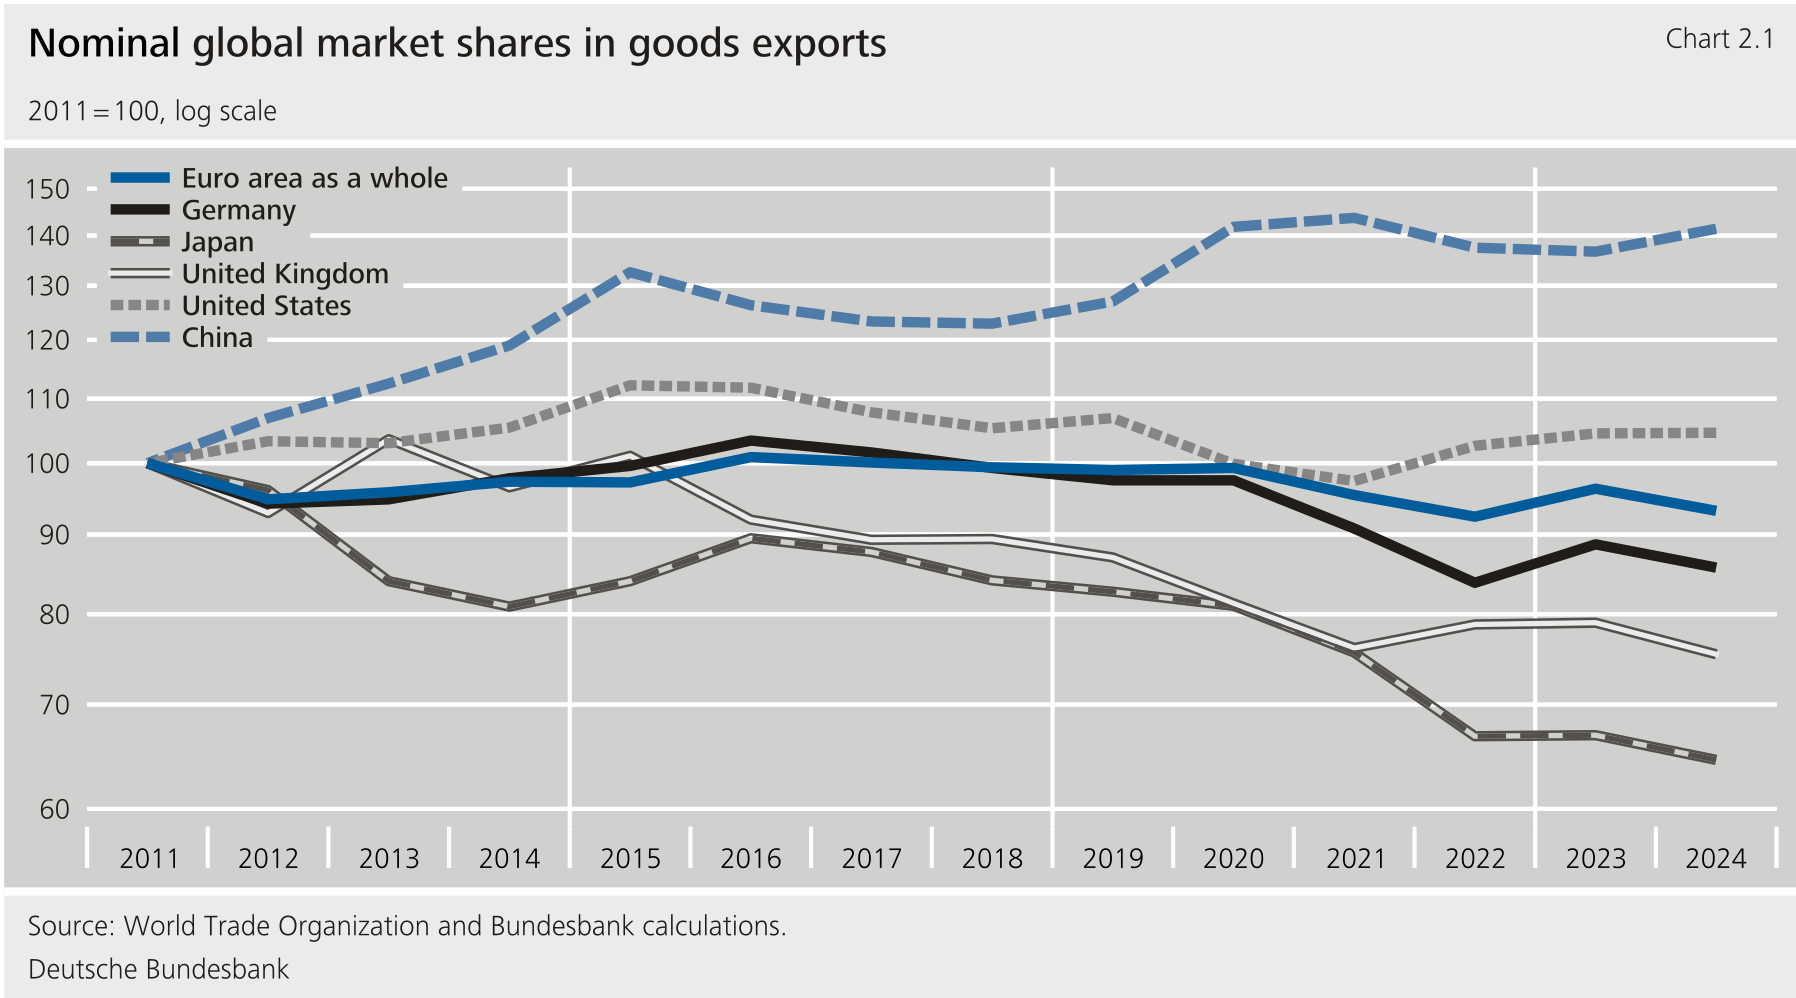
****The weak performance of German exports in recent years has been accompanied by significant market share losses for the German export industry. German export market shares have been contracting since 2017 and have increasingly fallen behind those of other advanced economies since 2021. As a result, the losses in market share have contributed significantly to the sluggish growth of the German economy.****{#par-i158a9}
****A novel approach serves to decompose developments in Germany's export market shares into demand and supply effects. Two demand-side effects capture whether products or countries to which Germany's export structure is geared have exhibited particularly strong or weak growth. In addition, two supply-side effects show how Germany's competitiveness has changed with regard to product groups or destination markets. The competitive position of a given country determined in this way reflects its revealed competitiveness. It is derived from export activity and can encompass both price and non-price factors. As such, it represents a broader concept than the standard indicators of price competitiveness.****{#par-e28231}
****More than three-quarters of the losses in export market shares between 2021 and 2023 were due to a deterioration in the competitiveness of German exporters with regard to product groups. The decline in competitiveness was broad based across sectors, suggesting that fundamental supply-side problems in the German economy played a role. The machinery industry, electrical industry and energy-intensive sectors such as the chemical industry were the biggest contributors to the drop in competitiveness. The sectoral profile and timing of the losses in competitiveness suggest that supply chain problems and energy price increases weighed particularly heavily. The development of German export market shares was also dampened by product-specific demand effects, mainly due to weak global demand for motor vehicles and motor vehicle parts as well as for aerospace technology. Overall, the findings point to the existence of supply-side problems in the German economy.****{#par-u23u74}
***1 Recent weakness in exports and losses in market share*** {#tar-1}
----------------------------------------------------------------------
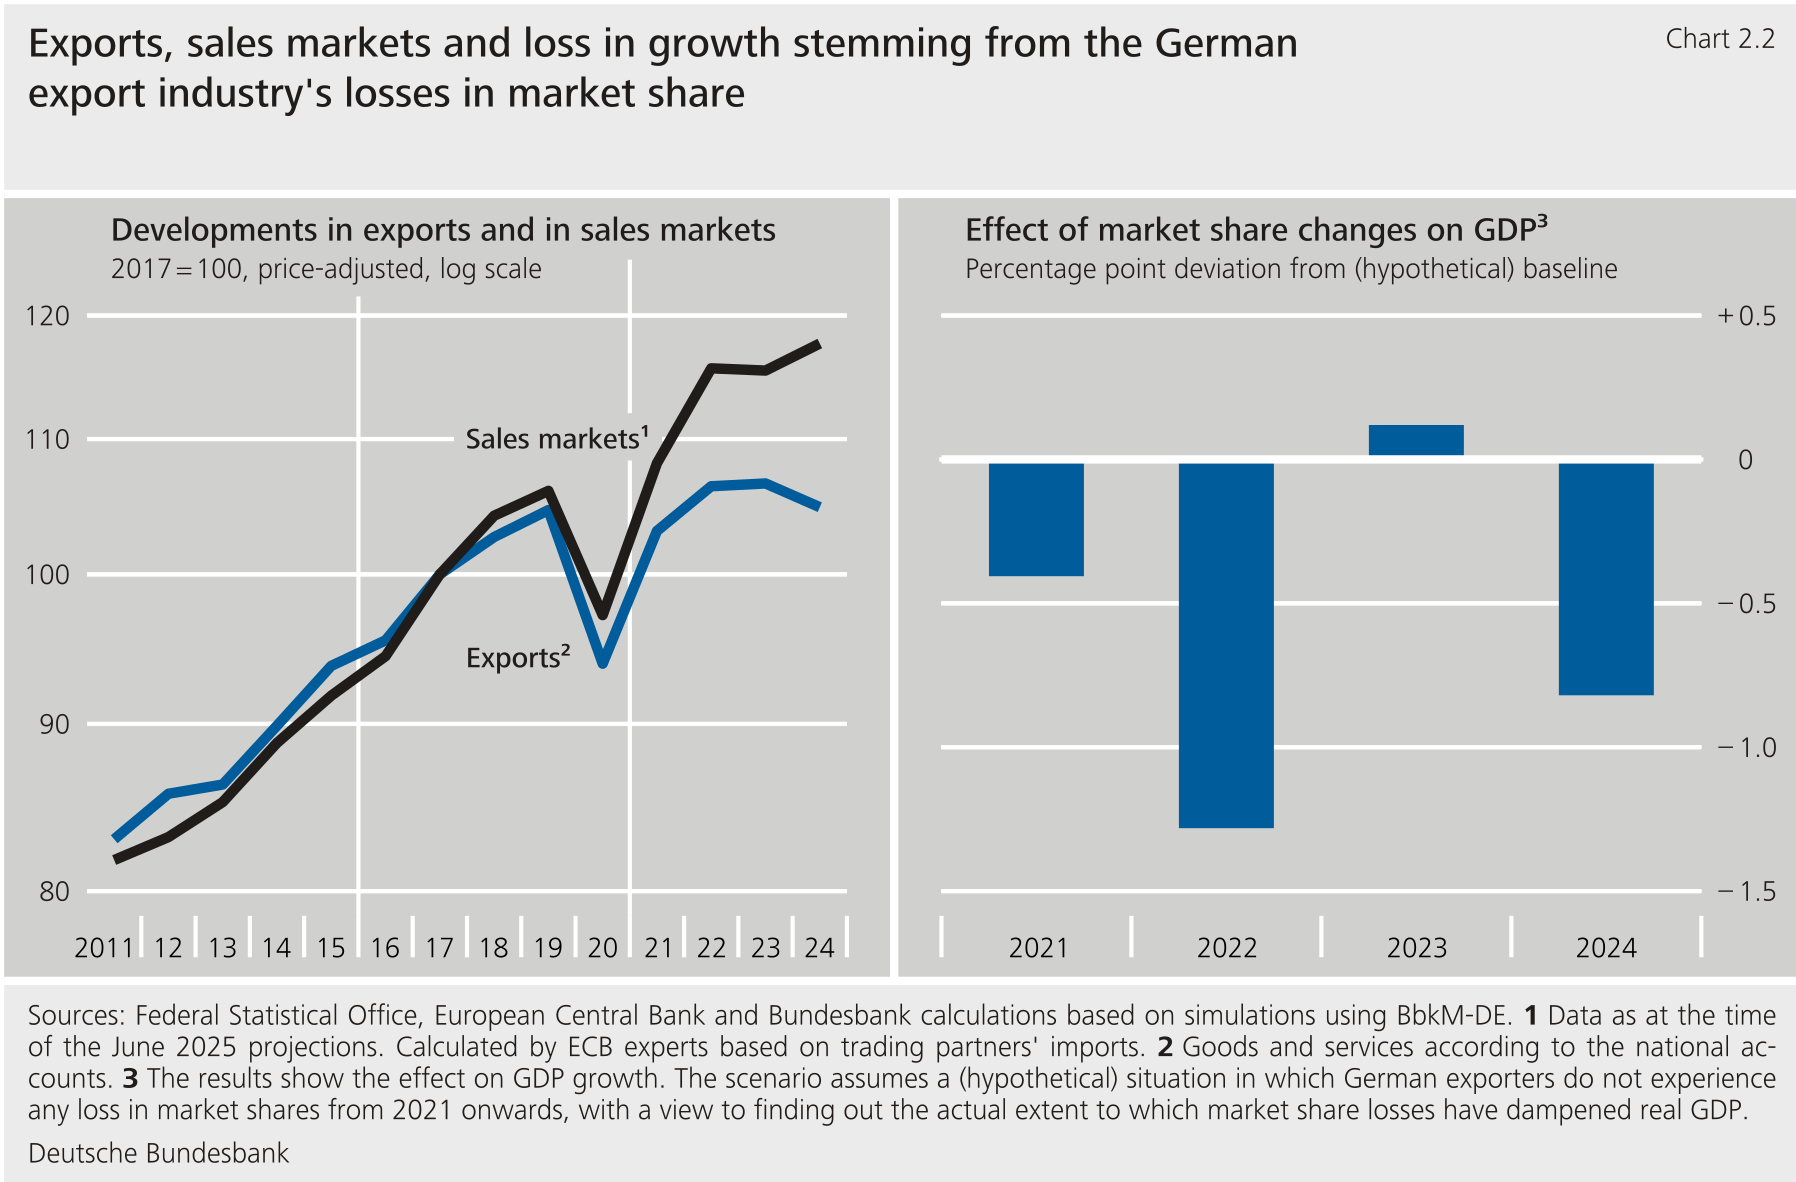
*****The weak development of German exports in recent years has gone hand in hand with sluggish foreign demand and significant losses in market share.** Growth in German exports was slowing before the -19 pandemic and has been especially weak in the past few years. Muted foreign demand has been a contributing factor, with the average annual growth of German sales markets having halved since 2018 compared with the years before. In addition, the evolution of German exports has since fallen significantly short of developments in foreign demand, meaning that the German export industry has lost shares in the global market.***{#par-u897i5}
*****German export market shares have fallen since 2017 and, compared with other countries, have developed particularly weakly since 2021.** After the global economic and financial crisis, German export market shares remained more or less stable up until 2016, thus developing comparatively favourably.***{#par-u2ii45}
{#par-e8e5u6}
******
*****The market share losses experienced by the German export industry have played a significant part in Germany's weak economic growth over the last few years.** This is suggested by simulations performed using the Bundesbank's macroeconomic model (BbkM-).[\[1\]](#_ftn_root_1) According to those simulations, Germany's would have grown by a total of 2.4 percentage points more strongly between 2021 and 2024 if German exports had risen in line with sales markets -- i.e. if there had been no loss in market share. In 2022, losses on account of market share declines were particularly heavy, at 1.3 percentage points. That said, such losses were still very steep last year, too, at 0.8 percentage point.[\[2\]](#_ftn_root_2)***{#par-e74833}
{#par-e596iu}
****
****Gaining a better understanding of why market share losses have come about is an important step on the way to deriving conclusions for economic policy.**In conceptual terms, losses in market share can occur for a variety of reasons. It is possible that weak demand hit the German export industry particularly hard on account of its specific goods mix or trading partner profile. It may also be the case that losses in market share are linked to a deterioration in competitiveness. Losses in competitiveness can be particularly pronounced for certain products or partner countries, and this can give an idea of the underlying causes. If, for example, supply-side factors are the main reason for market share declines across a large number of products, there is a high chance that Germany's overall business environment is at fault. Competition or demand problems in the case of products from individual sectors or destined for particular countries would additionally hint at specific challenges.**{#par-a47e88}
**2 Adverse developments in key competitiveness factors** {#tar-2}
------------------------------------------------------------------
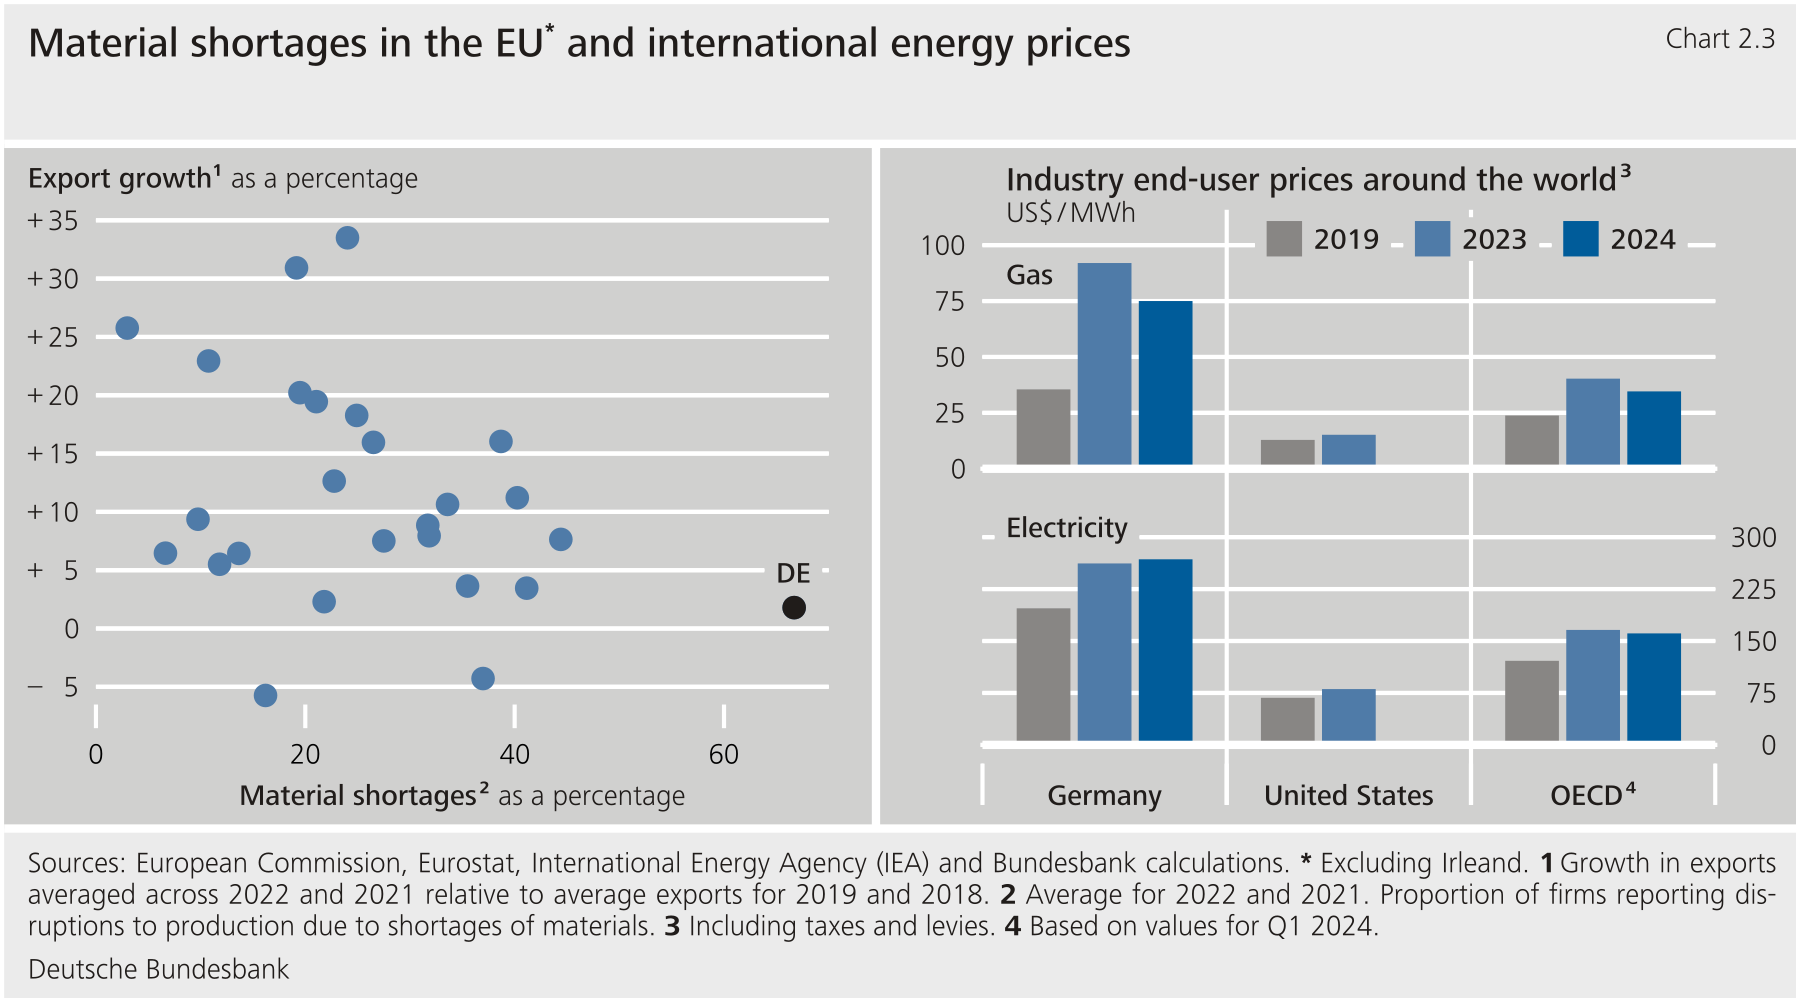
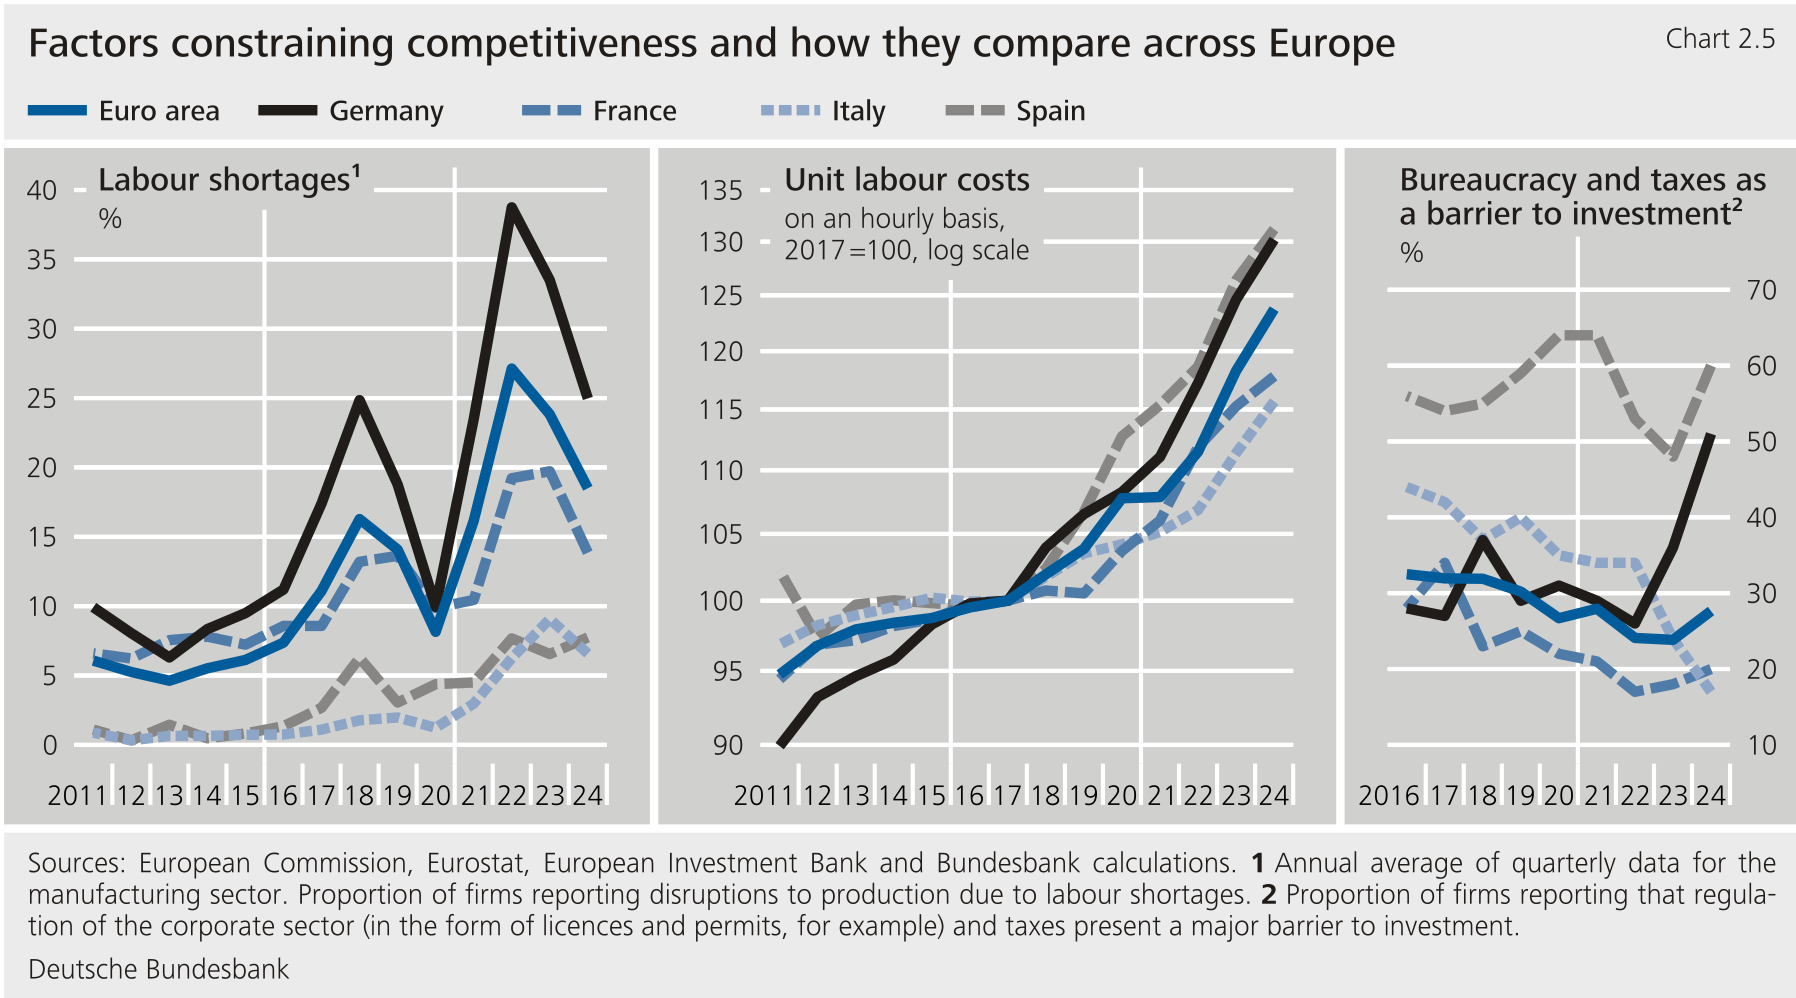
****Recent years have brought with them a number of shocks in the external environment that have been particularly detrimental to German firms.** These include global supply chain disruptions in the course of the -19 pandemic, which left Germany's industrial firms especially hard hit. According to European Commission surveys, significantly more firms in Germany were contending with supply bottlenecks than in other European countries in 2021 and 2022. German export performance was correspondingly weak in those years. The issue was compounded by the rise in energy prices since the outbreak of Russia's war of aggression against Ukraine. Compared with other countries, end-user prices for gas and electricity for industrial firms in Germany rose particularly steeply. Over recent years, this has been especially detrimental to exports by Germany's energy-intensive economic sectors.**{#par-i15258}
{#par-e27484}
****
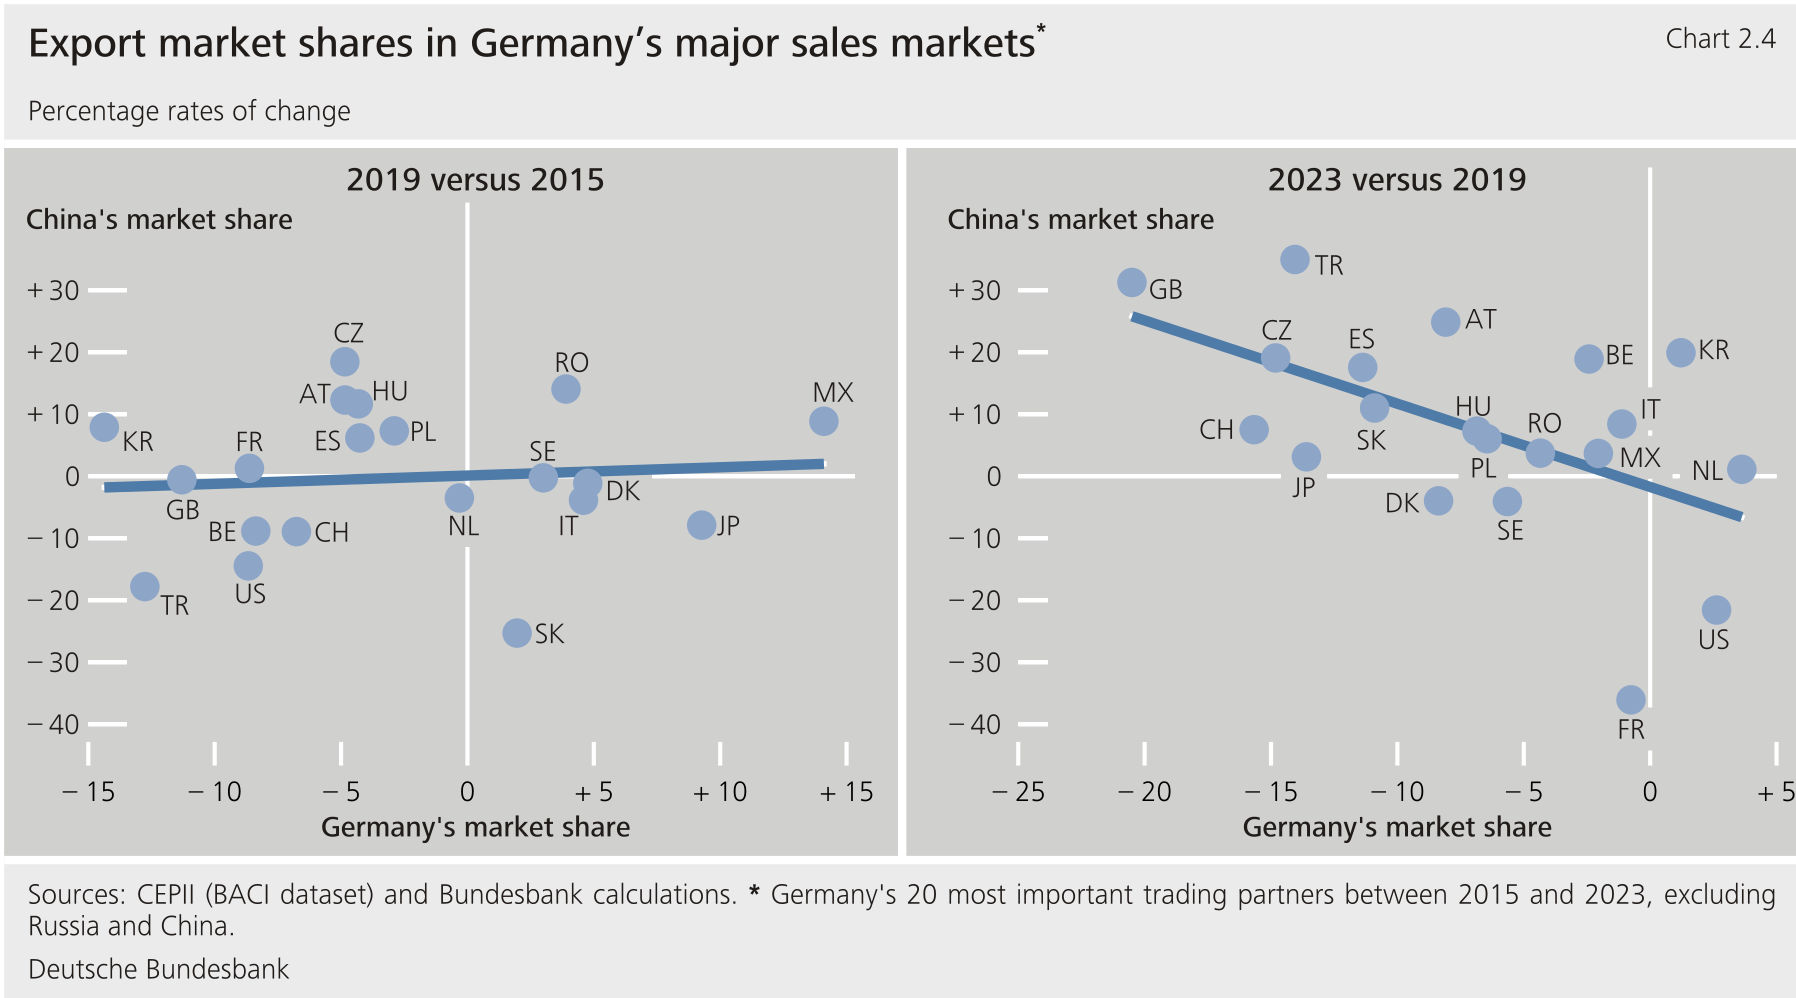
****China increasingly emerged as a competitor of German firms on the global market.** This was felt, for example, by the German automotive industry,[\[3\]](#_ftn_root_3) though the development was not confined to that sector.[\[4\]](#_ftn_root_4) Since 2019, in dealings with its most important trading partners, the German export industry has tended to lose more market share in the very areas where China has gained ground. This negative relationship between growth in the market shares of German and Chinese exports among Germany's major trading partners is a phenomenon that had not been seen in the years before.**{#par-e14a29}
{#par-o16u2u}
****
****In addition, domestic structural developments have put pressure on the German economy.** One example has been the especially pronounced demographic shift in Germany, which has exacerbated the shortage of labour and skilled workers in recent years.[\[5\]](#_ftn_root_5) By international comparison, a particularly large number of firms in Germany appear to complain of labour shortages -- and not just during periods when the economy is booming. Although industry has been faltering over the past two years, this has held true for many firms in the German manufacturing sector, for instance. The labour market has remained tight despite the recent slowdown. This tightness is likely to be one reason for wage pressures, which, combined with weak productivity developments, have sharply increased unit labour costs in Germany compared with other euro area countries over recent years.[\[6\]](#_ftn_root_6) Added to this are bureaucracy and tax burdens, which, according to surveys by the European Investment Bank, significantly dampened the investment activity of more than one-half of firms.[\[7\]](#_ftn_root_7) Since 2022, an increasing proportion of companies in Germany have perceived these burdens as a barrier to investment.**{#par-e322e2}
{#par-i5ao66}
****
****3 Weak export** performance**among key categories of goods and trading partners**** {#tar-3}
------------------------------------------------------------------------------------------------
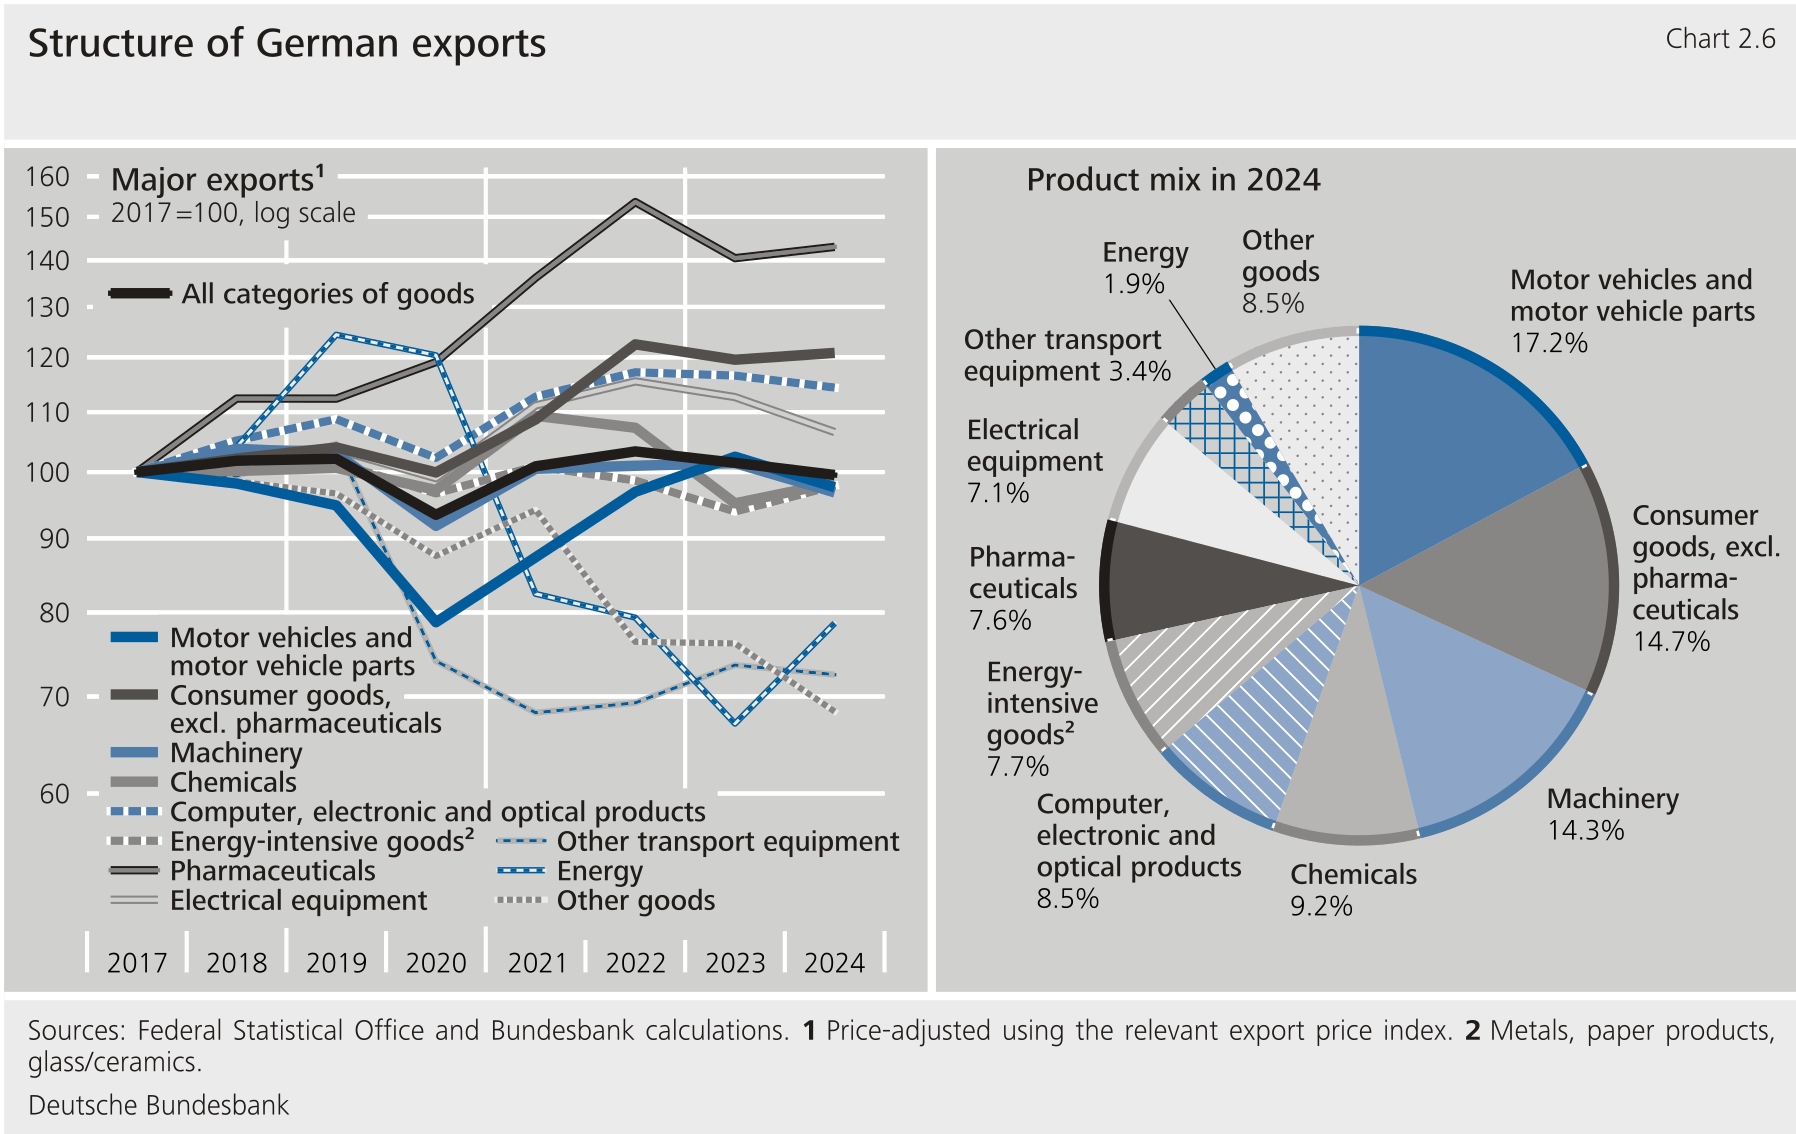
****Exports of some of Germany's important goods have performed weakly in recent years.** Exports of motor vehicles and motor vehicle parts have tended downwards since 2017, despite increasing substantially for a time once supply bottlenecks had eased after the -19 crisis.[\[8\]](#_ftn_root_8) Machinery exports remained sluggish after regaining some ground following the -19 crisis. In addition, exports of other transport equipment failed to recover from the 2020 slump.[\[9\]](#_ftn_root_9) Since 2022, the decline in exports of energy-intensive products, including chemicals and iron and steel products, has also dampened total exports.[\[10\]](#_ftn_root_10) On top of that, deliveries of other key export goods such as electronics and electrical equipment have been flagging since 2023.[\[11\]](#_ftn_root_11)**{#par-o88561}
{#par-a19462}
****
****Some of Germany's trading partners have experienced economic problems in recent years.** Following the Brexit referendum, German exporters' sales in the United Kingdom declined in the period up to 2021, in contrast to the average for the customer countries.[\[12\]](#_ftn_root_12) Nominal exports to Russia collapsed in 2022.[\[13\]](#_ftn_root_13) Meanwhile, revenue from export business with the euro area countries rose sharply and even more strongly in the case of other central and eastern European countries and the United States.[\[14\]](#_ftn_root_14) Since 2023, however, exports have weakened on a broad basis across regions. Deliveries to the euro area have declined significantly in terms of value. Exports to China have fallen particularly sharply.[\[15\]](#_ftn_root_15) And impetus from the other sales markets in South and East Asia as well as in central and eastern Europe has also been lacking of late.**{#par-u8i75e}
**4 New empirical findings on the drivers behind Germany's export market losses** {#tar-4}
------------------------------------------------------------------------------------------
****Changes in German export market shares can be systematically analysed by decomposing them into demand and supply effects.** [\[16\]](#_ftn_root_16) An empirical model can be used to examine, under certain assumptions, the extent to which market share gains or losses can be attributed to shifts in demand or to changes in competitiveness. The method employed here extends the standard decomposition commonly used in the literature. This provides a better understanding of why competitiveness has changed (see the supplementary information entitled [Decomposing changes in export market shares -- Detailed methodology](#Decomposing-changes-in-export-market-shares---detailed-methodology)).[\[17\]](#_ftn_root_17) Specifically, the analysis distinguishes between four effects. Two demand-side effects reflect whether a country has specialised in products (product demand effect) or trading partners (partner demand effect) where market growth has been particularly strong or weak. Two supply-side effects capture how a country's competitiveness has changed in terms of individual product groups (product supply effect) or in certain destination markets (partner supply effect). They reflect the relative performance of specific sectors within the country or of the economy as a whole in certain markets. As such, the supply effects provide insights into the international competitive position of the country. The following examples illustrate what these effects might look like in the case of Germany:**{#par-oo6485}
* **Product demand effect: Global demand for one of Germany's major export goods (for example, motor vehicles with internal combustion engines) is weak.**
* **Partner demand effect: An export destination country that is more important for Germany than for other countries is experiencing a period of economic weakness which is dampening import demand.**
* **Product supply effect: Germany falls behind other suppliers when it comes to exporting certain products, for example because production costs in Germany are developing less favourably or competitors are catching up on the technological front.**
* **Partner supply effect: German exports to a destination country are comparatively weak, for example because (as in the case of Brexit in the United Kingdom) the trade costs for German (and ) exporters are rising compared with the costs for third parties.[\[18\]](#_ftn_root_18)**
**The analysis is based on the French research institute 's extensive dataset of trade flows covering the period from 2000 to 2023 (latest data).**{#par-o81eaa}
****Decomposing changes in export market shares -- detailed methodology**** {#tar-5}
------------------------------------------------------------------------------------
****Gains or losses in a country's international competitiveness can be systematically captured by decomposing the changes in its export market shares.** This supplementary information outlines the technical details of the approach presented in the main text. Its aim is to break down the changes into supply-side and demand-side components. The approach builds on methods developed by Gaulier et al. (2013) and Cheptea et al. (2005), amongst others. These methods enable changes in market shares to be decomposed into geographical and product-specific demand composition effects, as well as an aggregate competitiveness effect for each exporter. The methodology presented here expands on this approach by further disaggregating the competitiveness effect for each exporter into product-specific and partner-specific contributions.[\[1\]](#_ftn_44978f29_1) This allows for a more detailed and nuanced assessment of a country's international competitiveness. It also makes it possible to specifically identify the products or trading partners for which competitiveness has significantly improved or deteriorated.**{#par-a3ea3i}
****The analysis of detailed trade data makes it possible to precisely map export dynamics.** It is based on the dataset compiled by the French research institute .[\[2\]](#_ftn_44978f29_2) This dataset draws on trade data reported to and contains information on bilateral trade flows at the six-digit level of the Harmonized System () nomenclature.[\[3\]](#_ftn_44978f29_3) This level of detail allows for a nuanced analysis of export developments but requires a clear distinction between two components: existing trade relationships in two consecutive years (intensive margin) and market entries or exits at the product-destination level (extensive margin). To capture both components, a symmetric growth measure is used: the mid-point growth rate, hereinafter referred to as the growth rate for the sake of simplicity.[\[4\]](#_ftn_44978f29_4)**{#par-a31568}
****To estimate the supply-side and demand-side effects, export value growth at the most disaggregated level of observation -- the combination of exporter, importer and product -- is decomposed into several components.** These components are estimated separately for each year as fixed effects using a weighted linear regression. The equation for the growth rate of bilateral exports \\( g_{ijkt} \\) between exporter \\( i \\) and importer \\( j \\) for product \\( k \\) at time \\( t \\) can be specified as:**{#par-e2u993}
**$$ g_{ijkt} = c_{world,t}+c_{kt}+d_{jt}+\\alpha_{jkt}+\\beta_{ikt}+\\gamma_{ijt}+\\epsilon_{ijkt}. $$**{#par-a79aoo}
**The constant \\( c_{world,t} \\) corresponds to the growth rate of world exports. On the demand side, \\( c_{kt} \\) and \\( d_{jt} \\) capture product-specific and partner-specific deviations from the global mean, while \\( \\alpha_{jkt} \\) captures importer-specific and product-specific demand effects. On the supply side, \\( \\beta_{ikt} \\) reflects exporter-specific and product-specific influences, and \\( \\gamma_{ijt} \\) captures bilateral influences between the exporter and the importer.[\[5\]](#_ftn_44978f29_5) The residual term \\( \\epsilon_{ijkt} \\) captures any further fluctuations that cannot be explained by the model.[\[6\]](#_ftn_44978f29_6)**{#par-e7o62i}
****The rate of change in a country's world market share can be approximated by the estimated supply-side and demand-side factors.** The central question is why a country has gained or lost market shares over time. The rate of change in world market share is approximated by the difference between a country's export growth rate \\( g_{it} \\) and world export growth \\( c_{world,t} \\).[\[7\]](#_ftn_44978f29_7) This difference can be expressed using the weighted aggregation of the effects estimated at the granular level:**{#par-iu8ou4}
**$$ g_{it} -- c_{world,t} = $$ $$ \\sum_{k} w_{ikt}c_{kt} + \\bigl(\\sum_{j} w_{ijt}d_{jt} + \\sum_{j,k} w_{ijkt}\\alpha_{jkt}\\bigr) + \\sum_{k} w_{ikt}\\beta_{ikt} + \\sum_{j} w_{ijt}\\gamma_{ijt} = $$ $$ DP_{it} + DC_{it} + SP_{it} + SC_{it}. $$**{#par-ai4919}
**The weights \\( w_{ikt} \\), \\( w_{ijkt} \\) and \\( w_{ijt} \\) are the respective export shares. \\( DP_{it} \\) (demand product) and \\( DC_{it} \\) (demand country) are the product-specific and partner-specific demand effects for country \\( i \\).[\[8\]](#_ftn_44978f29_8) \\( SP_{it} \\) (supply product) and \\( SC_{it} \\) (supply country) represent the product-specific and partner-specific supply or competitiveness effects for country \\( i \\).**{#par-ei431o}
****In addition, it is possible to track the extent to which the change in a country's market share and the underlying components are driven by price adjustments or shifts in volume.** [\[9\]](#_ftn_44978f29_9) Changes in the logarithmic export value can be precisely decomposed into price and volume components.[\[10\]](#_ftn_44978f29_10) This relationship is used to determine, for each export relationship, the share of the change attributable to either volumes or prices.[\[11\]](#_ftn_44978f29_11) The resulting weights are then applied to the estimated fixed effects and aggregated accordingly. As a result, all four components of the market share decomposition (\\( DP_{it} \\), \\( DC_{it} \\), \\( SP_{it} \\) and \\( SC_{it} \\)) can be broken down into price and volume components.**{#par-i899u6}
1. **{#_ftn_44978f29_1} For econometric reasons, it is also necessary to capture the geographic (partner-specific) demand effect at a finer level of granularity.**
2. **{#_ftn_44978f29_2} The [BACI dataset](https://www.cepii.fr/CEPII/en/bdd_modele/bdd_modele_item.asp?id=37) is regularly updated and is publicly available in various product classifications.**
3. **{#_ftn_44978f29_3} The analysis covers the years 2000 to 2023, using the version 1992.The fine granularity, with over 5,000 commodity groups and more than 230 countries, results in just under 277 million observations in total.**
4. **{#_ftn_44978f29_4} The mid-point growth rate is defined as\\( g = \\frac{X_t -- X_{t-1}}{0{,}5 \\times (X_t + X_{t-1})} \\), whereby \\( X_{t} \\) and \\( X_{t-1} \\) denote the export value in the years \\( t \\) and\\( t-1 \\), respectively. The metric is bounded within the interval between − 2 and + 2, making it robust to outliers. Since it remains well defined even when the trade value is zero in one of the two periods, it is especially well suited for analysing both intensive and extensive margins. For small changes, it provides a good approximation of the percentage change based on the natural logarithm. Aggregation is performed using a weighting procedure in which individual export flows are weighted by the average of their trade shares in both periods: \\( w_{ijkt} = \\frac{X_{ijkt} + X_{ijkt-1}}{X_t + X_{t-1}} \\). This ensures that the export flows are consistently aggregated at the exporter-importer-product level, whereby growth rates at higher levels -- such as at the exporter or global level -- are calculated as weighted sums of growth rates at more granular levels. See Gaulier et al. (2013) and Bricongne et al. (2012).**
5. **{#_ftn_44978f29_5} Unlike the method presented here, Gaulier et al. (2013) use the estimation equation \\( g_{ijkt} = \\alpha_{it} + \\beta_{jt} + \\gamma_{kt} + \\varepsilon_{ijkt} \\) to decompose the symmetric growth rate of export values, which does not allow for the separate identification of supply-side effects by import country or product dimension.**
6. **{#_ftn_44978f29_6} Final normalisation at the global level prevents overidentification and multicollinearity. Specifically, the weighted means of the fixed effects are set at zero: \\( \\sum_k w_{kt} c_{kt} = \\sum_j w_{jt} d_{jt} = \\sum_{j,k} w_{jkt} \\alpha_{jkt} = \\sum_{i,k} w_{ikt} \\beta_{ikt} = \\sum_{i,j} w_{ijt} \\gamma_{ijt} = 0 \\). The weights \\( w_{kt} \\), \\( w_{jt} \\), \\( w_{jkt} \\), \\( w_{ikt} \\) and \\( w_{ijt} \\) are calculated by summing up the export shares \\( w_{ijkt} \\) across the respective dimensions that are not considered. This ensures that the fixed effects can be interpreted as relative deviations from the global average.**
7. **{#_ftn_44978f29_7} In theory, the rate of change in a country's world market share is derived from the difference in logarithmic growth rates:\\( \\Delta\\ln s_{it}=\\Delta\\ln\\frac{X_{it}}{X_{it-1}}-\\Delta\\ln\\frac{X_t}{X_{t-1}} \\). When using the symmetric growth rate considered here, this relationship holds approximately: \\( g_{it}-c_{world,t}\\approx\\Delta\\ln s_{it} \\). This difference forms the conceptual basis for decomposing the change in market share.**
8. **{#_ftn_44978f29_8} The partner demand effect (\\( DC_{it} \\)) consists of a pure country component (\\( c_{jt} \\)) and country-product combinations (\\( \\alpha_{jkt} \\)) that capture demand deviations from the product-specific and partner-specific mean.**
9. **{#_ftn_44978f29_9} For the analysis of volume and price effects, missing volume data in the dataset, amounting to around 2 % of observations, were imputed using average unit values at the exporter, importer and product levels.**
10. **{#_ftn_44978f29_10} \\( \\Delta\\ln X_{ijkt} = \\Delta\\ln p_{ijkt} + \\Delta\\ln q_{ijkt} \\) applies to existing trade relationships, whereby \\( X \\),\\( p \\) and \\( q \\) denote the export value, average price (unit value) and volume, respectively.**
11. **{#_ftn_44978f29_11} The weighting is based on the share of the volume or price change in the total change in export value: \\( \\omega\^q_{ijkt} = \\frac{\\Delta\\ln q_{ijkt}}{\\Delta\\ln X_{ijkt}} \\), \\( \\quad \\omega\^p_{ijkt} = 1 -- \\omega\^q_{ijkt} \\). In the case of new or discontinued export relationships (i.e. the extensive margin), half of the total change is assumed to be volume-based (i.e. \\( \\omega\^q_{ijkt} = 0{,}5 \\)). Alternative assumptions change the results very little as the extensive margin plays only a minor quantitative role in the development of the country-level aggregate. To avoid distortions caused by outliers, the weighting factors are winsorised at the 1st and 99th percentiles.**
****The competitive position of a country as determined by this model analysis represents its revealed competitiveness.** It is derived from actual changes in export market shares using granular product data broken down by destination country. The competitive position is estimated based on the development of a country's exports relative to all other countries in the world, controlling for demand-side factors. The supply-side performance calculated using this method reflects both price and non-price aspects of competitiveness. This makes it possible to analyse the revealed competitiveness of individual sectors and relative to each trading partner. It differs from common indicators of price competitiveness. For example, the Bundesbank's indicator of macroeconomic price competitiveness is based on a country's real exchange rate.[\[19\]](#_ftn_root_19) It shows how prices for domestic goods develop relative to those for foreign goods. Price indices for the economy as a whole are generally used here. However, the link between real exchange rates and export activity must then be established through more detailed analyses. Similarly, indicators of non-price competitiveness -- which often capture certain location factors, may include qualitative measures and can be defined quite differently depending on the data producer -- are also not directly indicative of export activity. Where necessary, this relationship must be established in a separate step.**{#par-i3u12e}
**5 Majority of market share losses due to reduced competitiveness** {#tar-6}
-----------------------------------------------------------------------------
****Germany's declining export market shares were primarily driven by the fall in Germany's competitiveness in certain product groups** .[\[20\]](#_ftn_root_20) Around three-quarters of the decline since 2017 -- and an even higher share since 2021 -- can be attributed to supply-side effects.[\[21\]](#_ftn_root_21) These were almost exclusively the result of German exporters losing competitiveness in certain product groups. Losses were particularly large in 2021 and 2022. From 2021 onwards, competitiveness in certain sales markets also weakened -- but to a lesser extent than for products. Overall, these results suggest that the losses in market share largely reflect supply-side weaknesses in the German economy.[\[22\]](#_ftn_root_22)**{#par-o297i4}
{#par-oii527}
**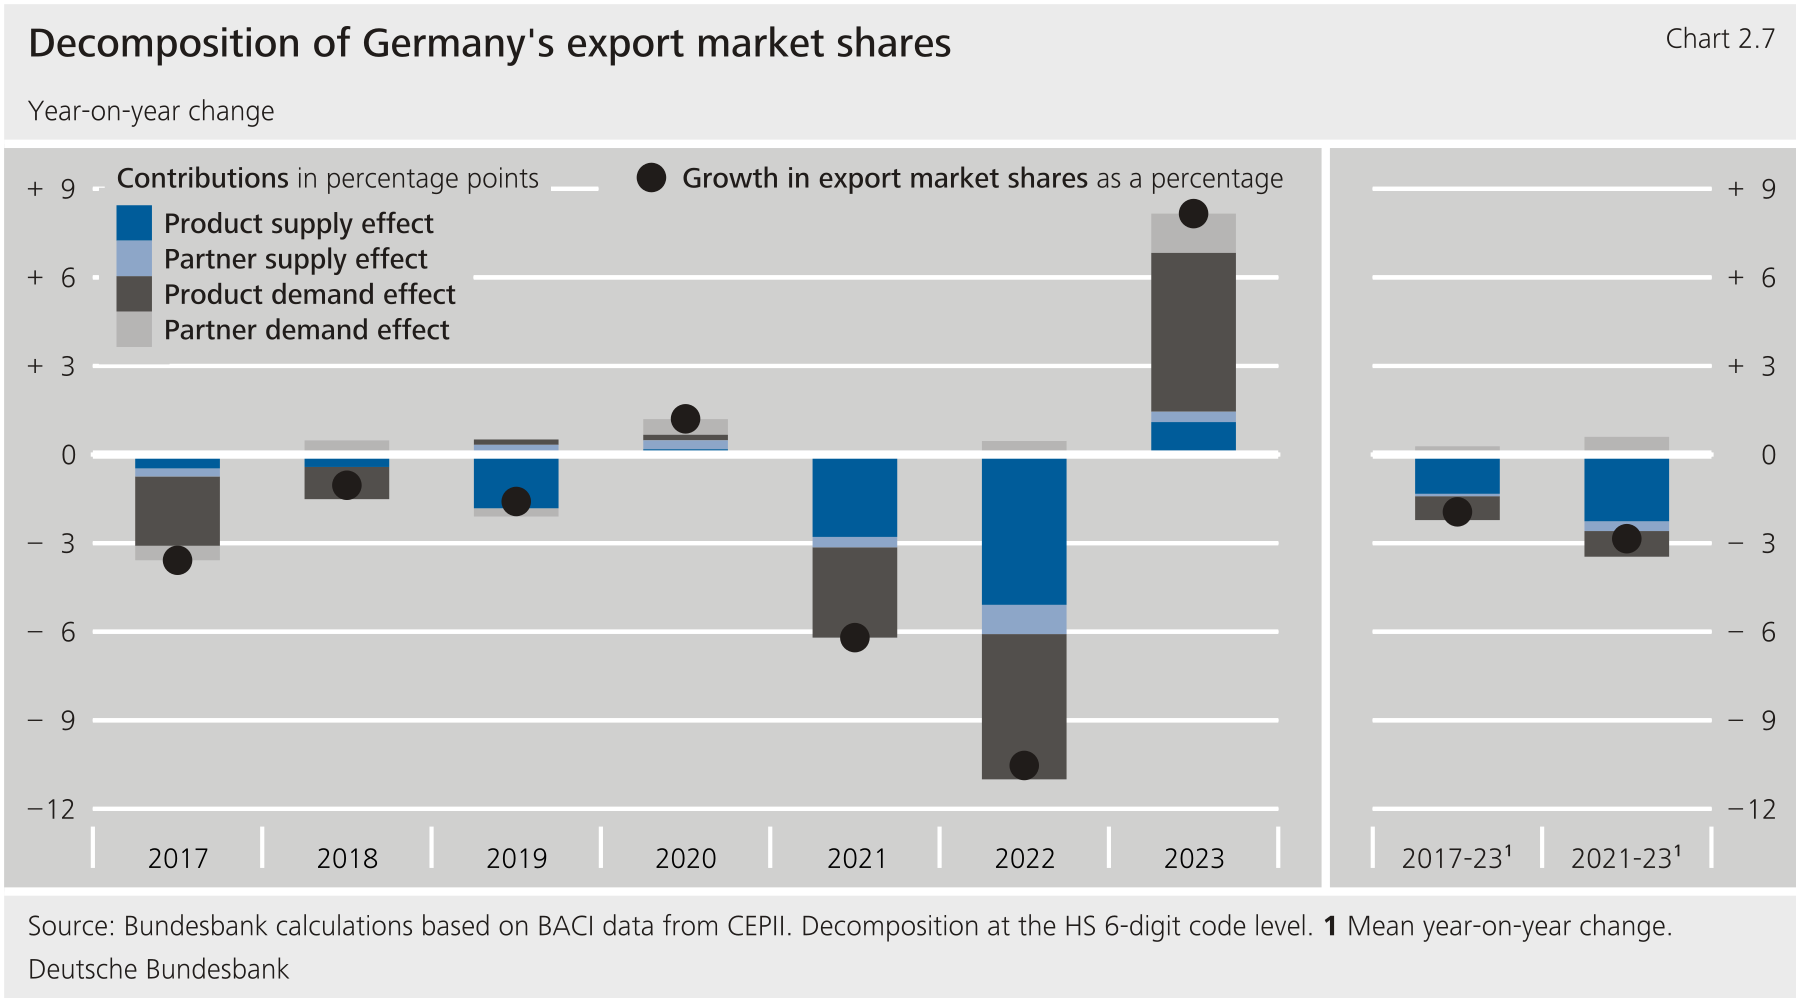**
****The specialisation of Germany's export industry in products with below average global demand growth explains just over one-third of the total losses in market share since 2017.** [\[23\]](#_ftn_root_23) Germany's export goods mix has therefore been more of a disadvantage in the recent past. However, the 2023 results also show that the German economy can benefit from its existing product portfolio. The dampening effects of the product portfolio observed in recent years are thus not necessarily a result of structural shifts in global demand, but could also be due to the exceptionally large shocks of recent years. On the demand side, by contrast, the geographical orientation of Germany's exports has not played a significant role in the decline in export market shares seen in recent years. At the end of the period under review, it was providing only slight , if any, support to German export market shares.**{#par-uua537}
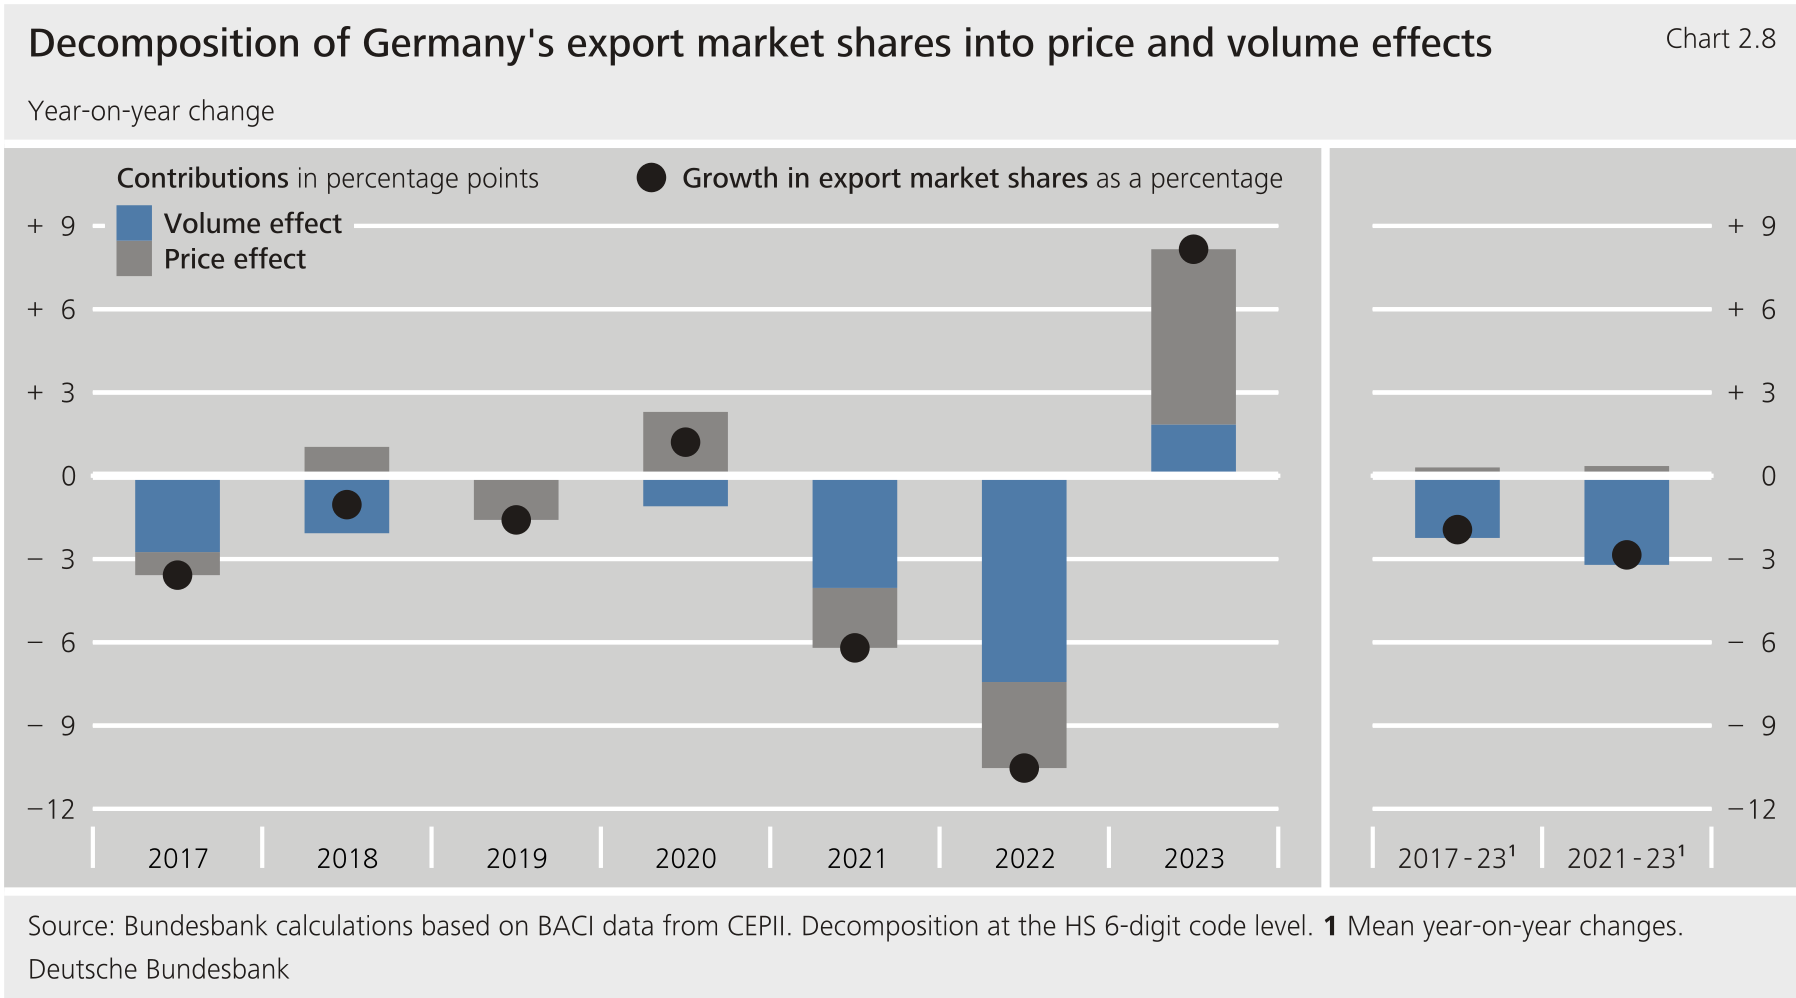
****Germany's export market share losses since 2017 can be attributed almost entirely to declining sales volumes.** [\[24\]](#_ftn_root_24) Under certain assumptions, value changes in market shares can be broken down into price and volume effects. This reveals whether market share losses or gains were caused by changes in prices or sales volumes. The results show that, with the exception of 2023, volume effects had a dampening influence in every year. The market share losses were therefore volume-based and not merely a consequence of unfavourable price developments. By contrast, price effects fluctuated considerably but, on average, were not substantial. In 2021 and 2022, years characterised by sharply rising energy and commodity prices, negative price effects had an impact. In absolute terms, however, they remained well below the respective volume movements.[\[25\]](#_ftn_root_25) The countermovement in market shares in 2023 was primarily due to price effects. Consistent with this, data for 2024 indicate that the recovery in 2023 was not sustained, as market shares declined once again.**{#par-oo59ai}
{#par-u63o4a}
****
**6 Patterns of market share losses with indications of economic determinants** {#tar-7}
----------------------------------------------------------------------------------------
****The temporal, sectoral and geographical patterns of market share losses allow conclusions to be drawn about their main determinants.** To this end, product and partner effects are further broken down by product or by destination country, respectively. In each case, a distinction is made between supply-side and demand-side effects. This results in a total of four more detailed decompositions, each supplemented with a time profile. Together, these provide sufficient differentiation to assess the plausibility of likely explanatory factors.**{#par-eui434}
****The fact that German exporters lost competitiveness across a wide range of products points to fundamental supply-side problems.** Between 2017 and 2023, competitiveness declined in more than three-quarters of nearly 100 product categories at the 2-digit code level. This points to fundamental structural challenges for the German economy, which weighed on both price and non-price competitiveness.[\[26\]](#_ftn_root_26) Likely contributing factors include several mentioned at the outset of this article, such as labour shortages, relatively sharp increases in unit labour costs, growing bureaucratic burdens, and mounting competitive pressure from China.**{#par-oieooi}
****The pattern of declining competitiveness** **suggests that****supply chain problems and sharply rising energy prices were the main contributing factors.** [\[27\]](#_ftn_root_27) The largest contributions to competitiveness losses in the 2021‑22 period came from medium-high and high-tech goods, especially in the machinery and electrical industries, as well as energy-intensive sectors such as parts of the chemical and metal industries. First, the sustained disruptions to global supply chains triggered by the -19 pandemic are likely to have been a major factor, especially in sectors with complex intermediate input structures such as the machinery and electrical industries.[\[28\]](#_ftn_root_28) Second, the sharp increase in energy prices since the start of Russia's war of aggression against Ukraine primarily affected the cost burden of energy-intensive sectors.[\[29\]](#_ftn_root_29) Both of these developments hit Germany particularly hard. By contrast, the competitiveness of aerospace products improved slightly. In 2023, the competitiveness of some sectors recovered, which is probably due in particular to the easing of supply chain disruptions and falling energy prices. However, this fell far short of offsetting the competitiveness losses of previous years.**{#par-a8e384}
{#par-i99471}
**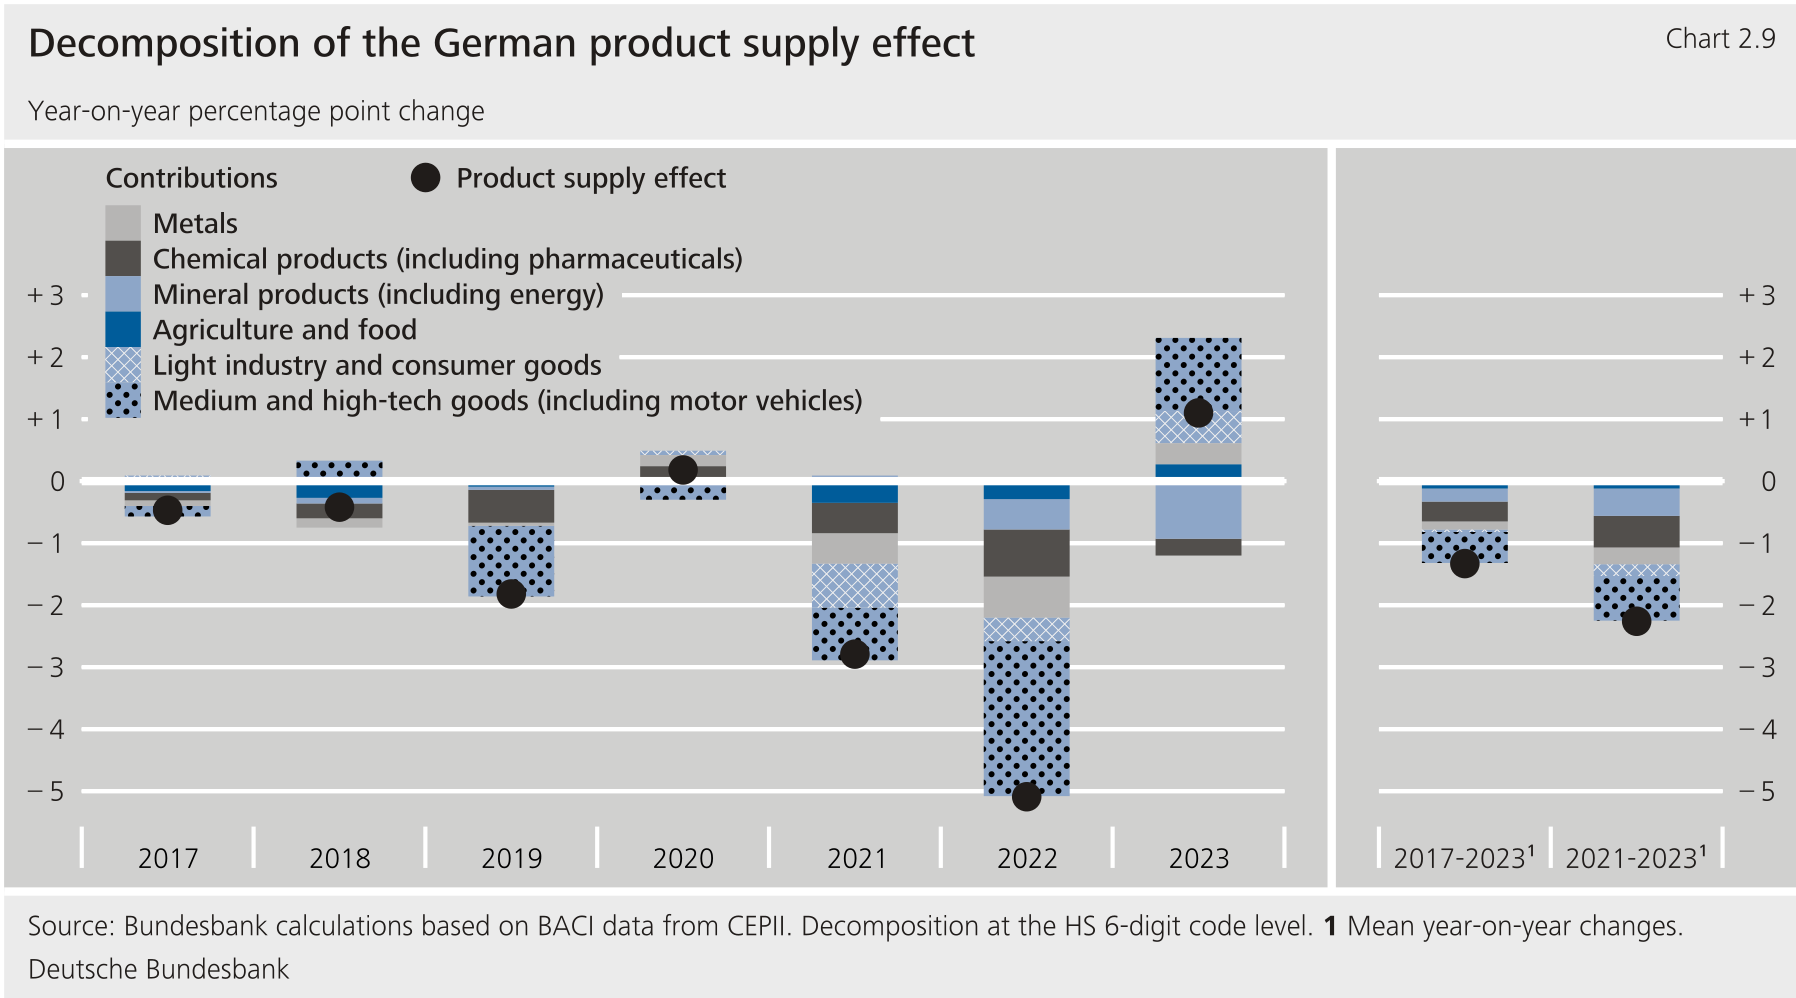**
****In contrast to many other sectors, the analysis found no evidence of lasting changes in competitiveness in the automotive industry up to 2023.** Only in 2019 did losses in competitiveness for motor vehicles and motor vehicle parts point to supply-side challenges. These may have been related to the introduction of a new exhaust emissions testing standard, which led to supply issues for some German brands.[\[30\]](#_ftn_root_30)**{#par-o82io9}
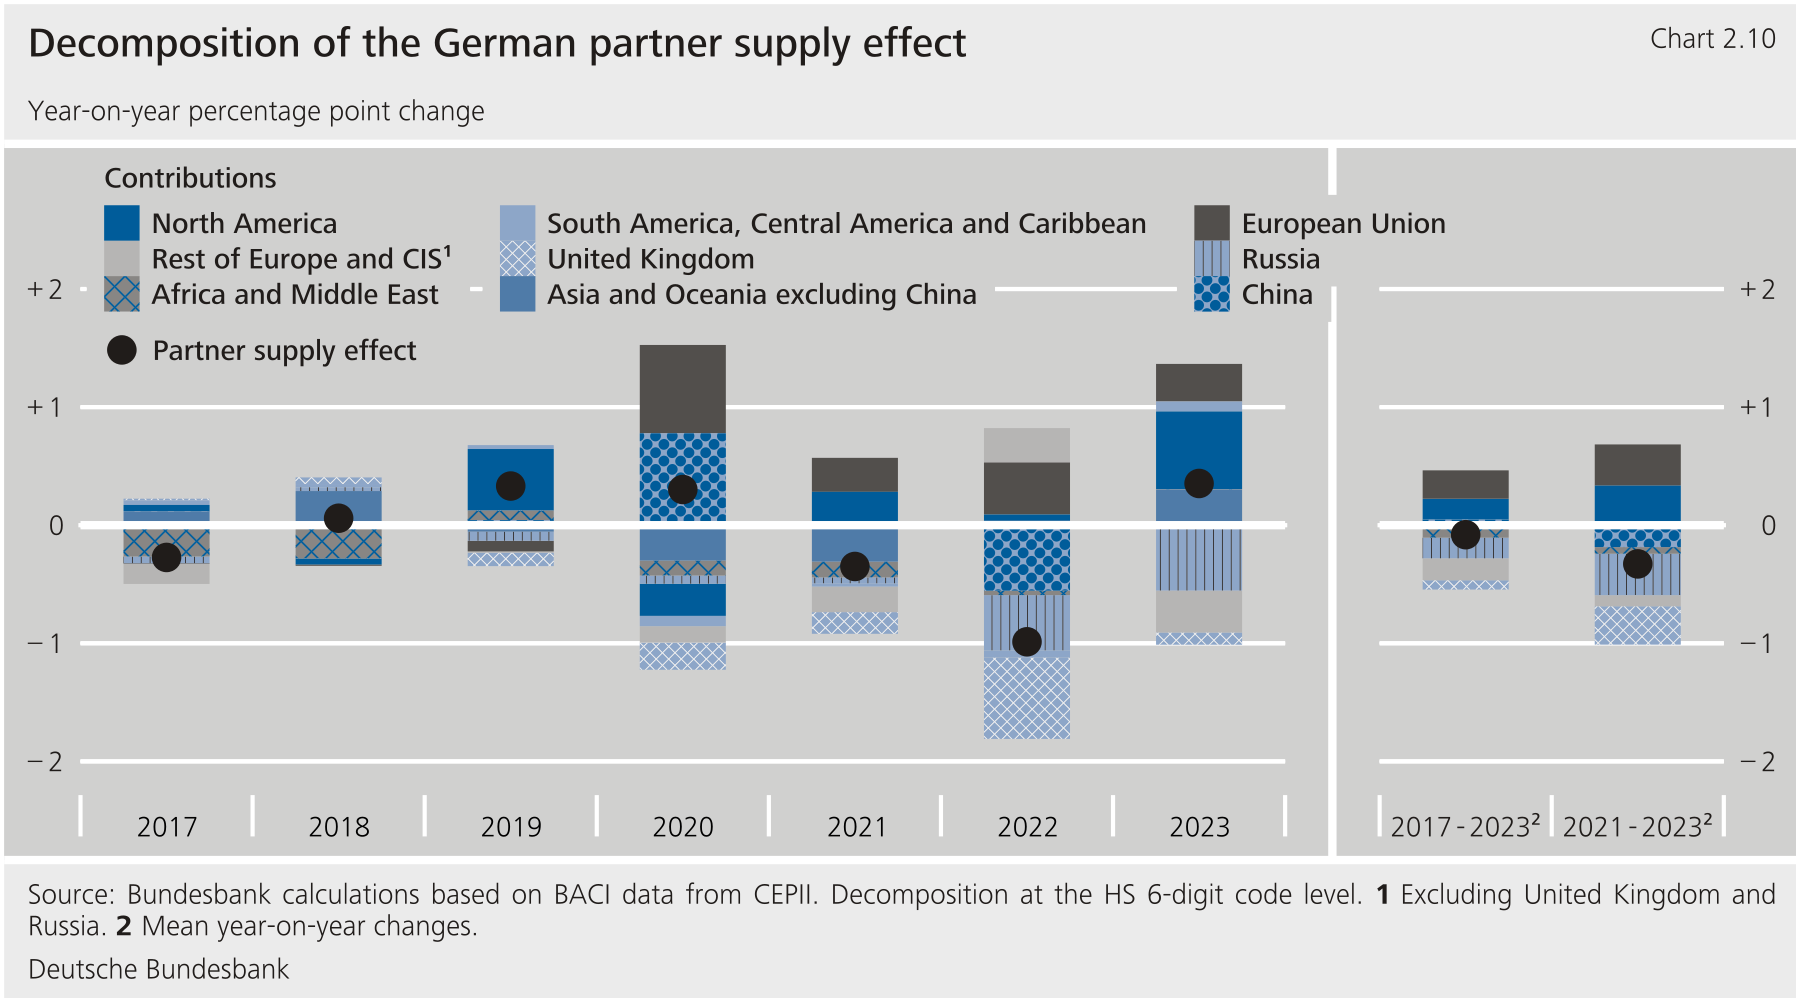
****The trade barriers with the United Kingdom resulting from Brexit and the collapse of exports to Russia due to the war against Ukraine significantly weakened the country-specific competitive position of German exporters.** [\[31\]](#_ftn_root_31) Exports from Germany and other countries to the United Kingdom declined more sharply than average due to trade barriers and bureaucratic hurdles following the United Kingdom's withdrawal from the , although the negative contributions lessened in 2023. Non- countries are likely to have become more competitive in this market given that their trade barriers with the United Kingdom were unchanged compared with those of countries. At the same time, there was a significant slump in exports to Russia in 2022‑23 owing to the war against Ukraine and subsequent sanctions. Alternative suppliers may have served Russian customers. The dampening contribution of Asia and Oceania in 2022 was mainly due to German exporters losing competitiveness in the Chinese export market.[\[32\]](#_ftn_root_32) By contrast, German firms were able to become more competitive in the and in the market. Overall, therefore, partner-specific supply effects had only a modest dampening effect.**{#par-ua8851}
{#par-o6i645}
****
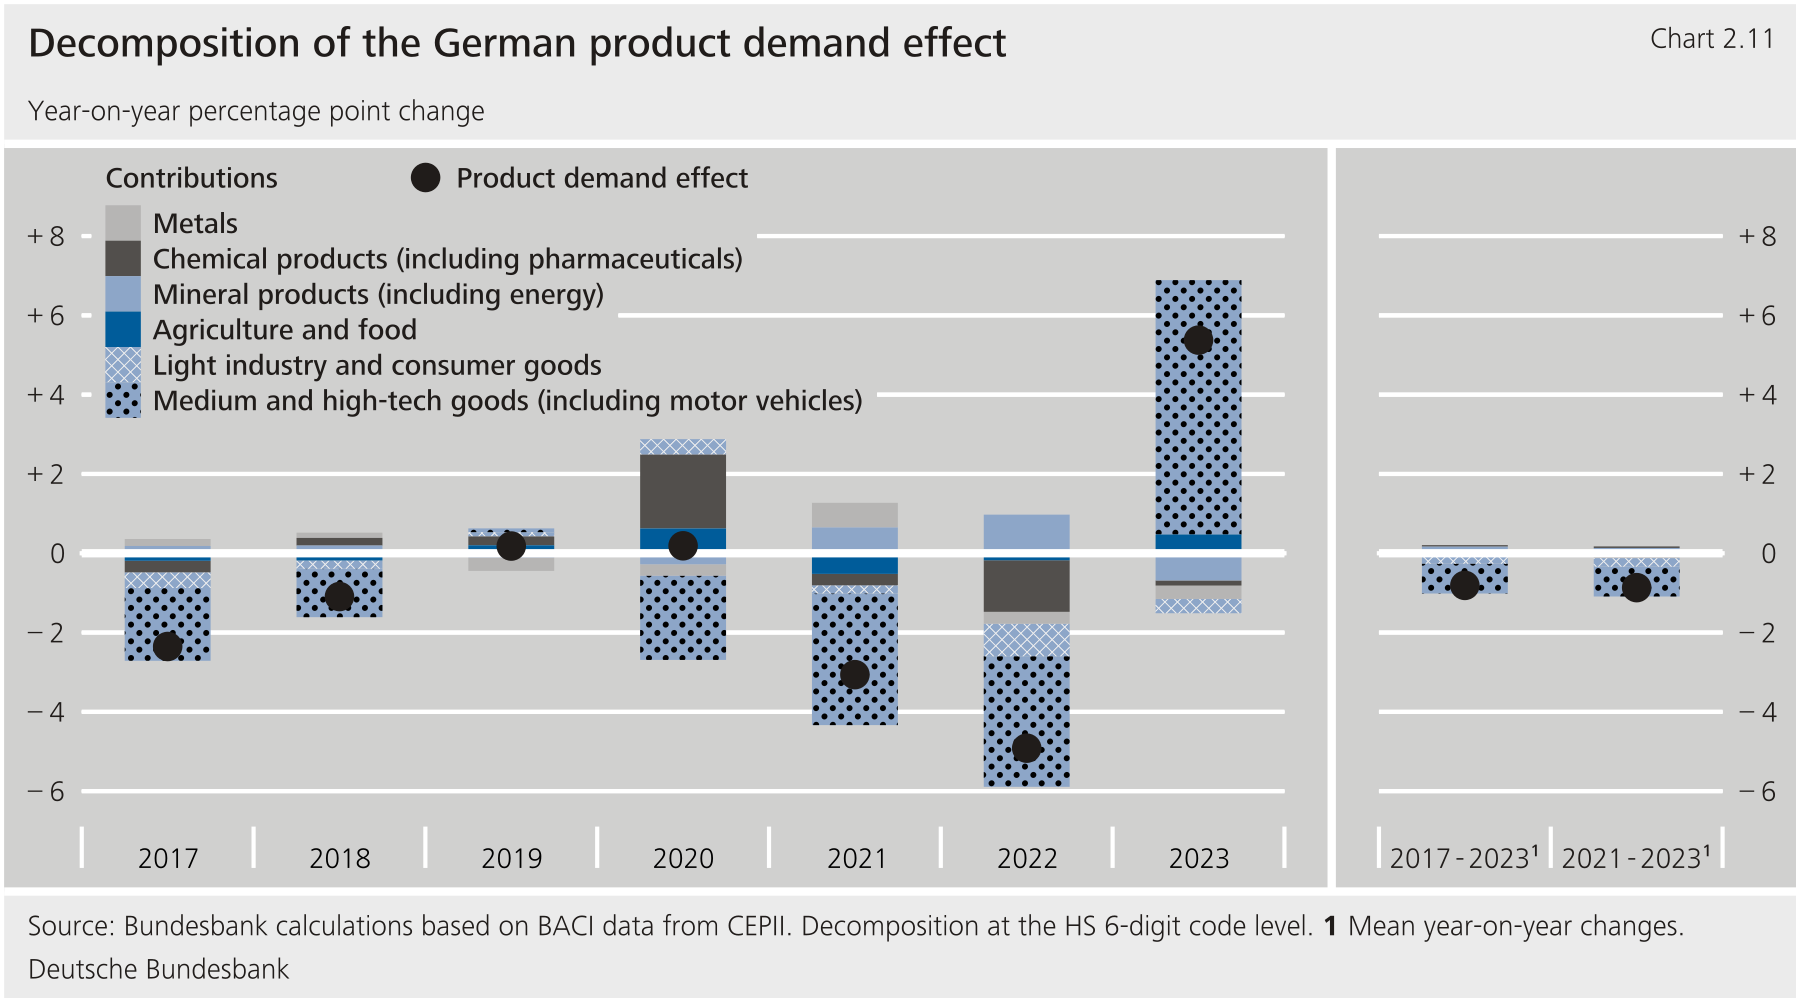
****The comparatively weak global demand for products that dominate Germany's export structure, especially motor vehicles and aerospace technology, led to net losses in market share.** Global demand for motor vehicles and motor vehicle parts was a key factor.[\[33\]](#_ftn_root_33) Global car sales have largely stagnated since 2016 and began to decline significantly as early as 2019. One factor that played a role in this was the saturation of major markets such as China. In 2020 and 2021, these sales problems were exacerbated by the -19 pandemic and global supply bottlenecks, especially for semiconductors.[\[34\]](#_ftn_root_34) It was not until 2023 that the market recovered and sales exceeded their pre-pandemic levels. Global demand for aerospace products also weakened at times. Pandemic-related travel restrictions reduced demand for new aircraft. By contrast, demand for pharmaceutical products was strong, especially during the -19 pandemic.**{#par-aa3e59}
{#par-iou9e9}
****
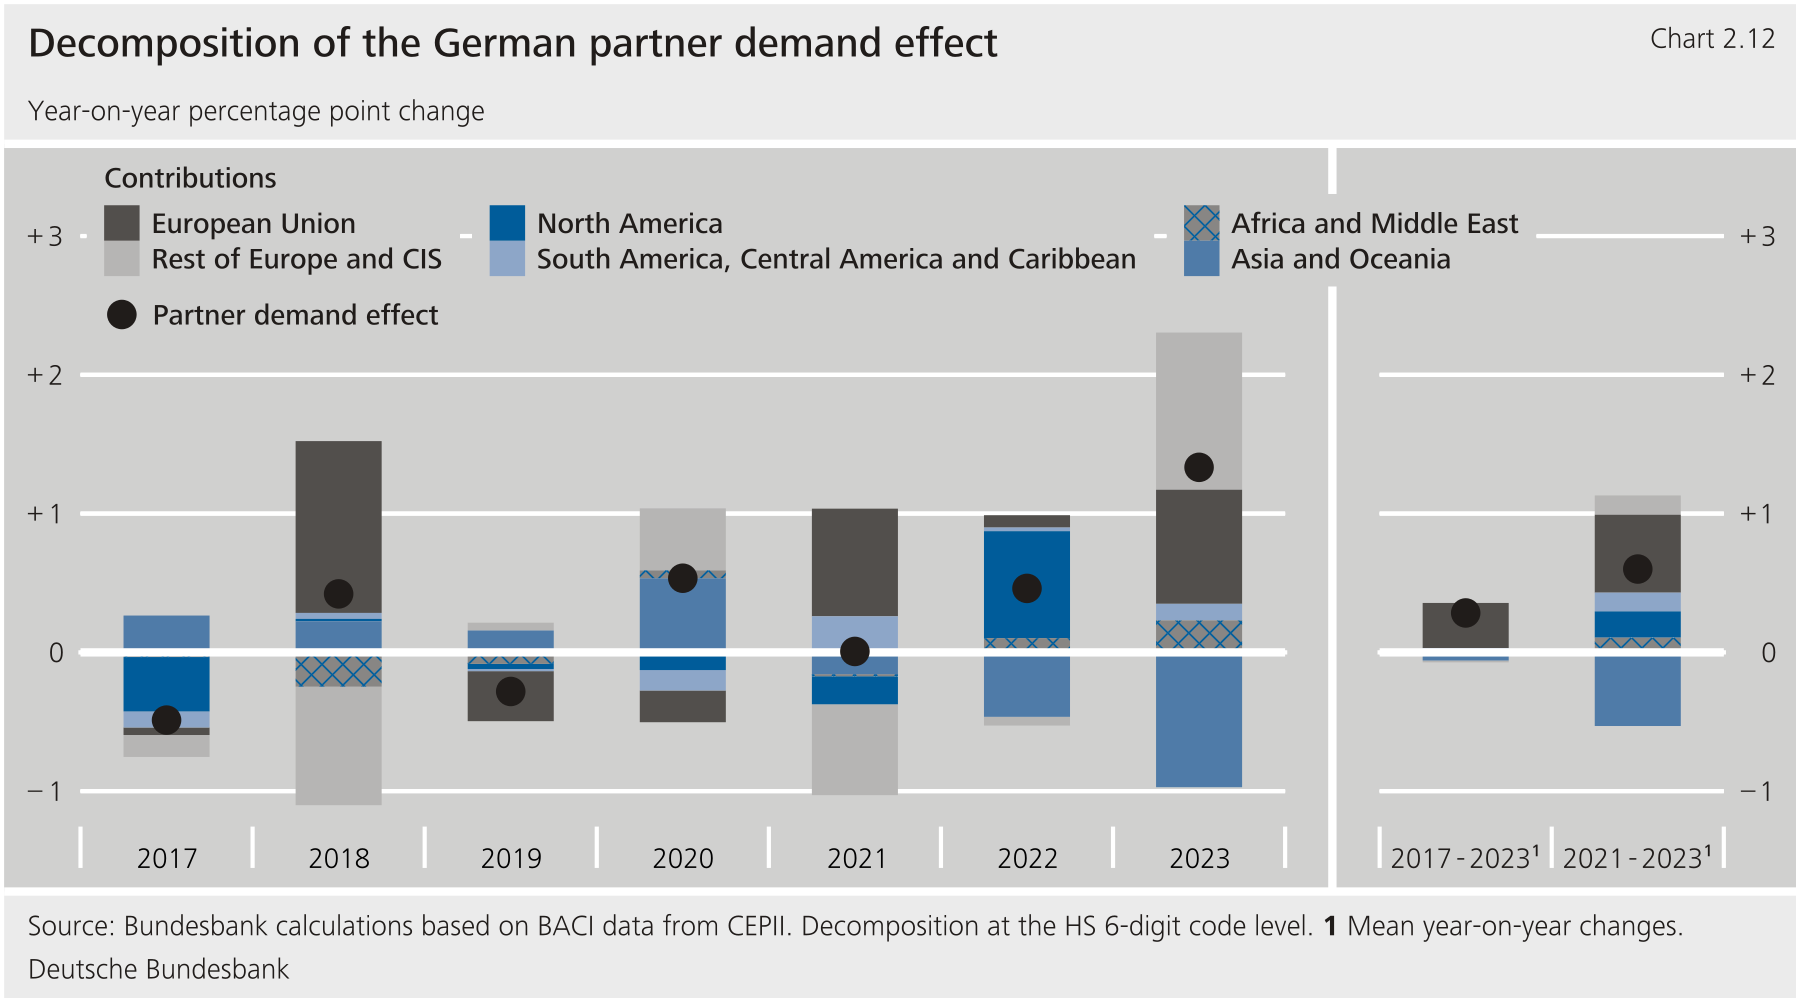
****From 2017 to 2023, growing demand in sales markets aligned with Germany's export structure provided a modest overall boost to Germany's export market shares.** [\[35\]](#_ftn_root_35) This was mainly due to continued solid import growth within the . Thanks to their significant weight in Germany's export structure, imports repeatedly contributed positively. Since 2021, however, opposing demand impulses have emerged from other countries. While demand led by China provided tailwinds up to and including 2020, Chinese demand has increasingly acted as a drag on German exports in recent years.[\[36\]](#_ftn_root_36) In isolation, weaker demand in the United Kingdom following the Brexit referendum also dampened the development of Germany's market shares.**{#par-o97498}
{#par-o4a4i1}
****
**7 Germany's recent losses in competitiveness are considerable by comparison with other countries** {#tar-8}
-------------------------------------------------------------------------------------------------------------
****From 2001 to 2016, Germany lost barely any export market shares due to product-specific competitiveness -- unlike, for example, France, the United Kingdom, the United States and the rest of the euro area.** [\[37\]](#_ftn_root_37) During that period, Germany clearly stood out from this peer group. The main driver of market share losses in these countries was a decline in competitiveness, especially in medium and high-tech industrial goods. These developments coincided with the decline in manufacturing value added in many advanced economies and the "China shock".[\[38\]](#_ftn_root_38) At the same time, China significantly increased its global market share thanks to major improvements in medium and high-tech industrial goods (and partly in light industry and consumer goods).**{#par-ua17e8}
{#par-i69o65}
**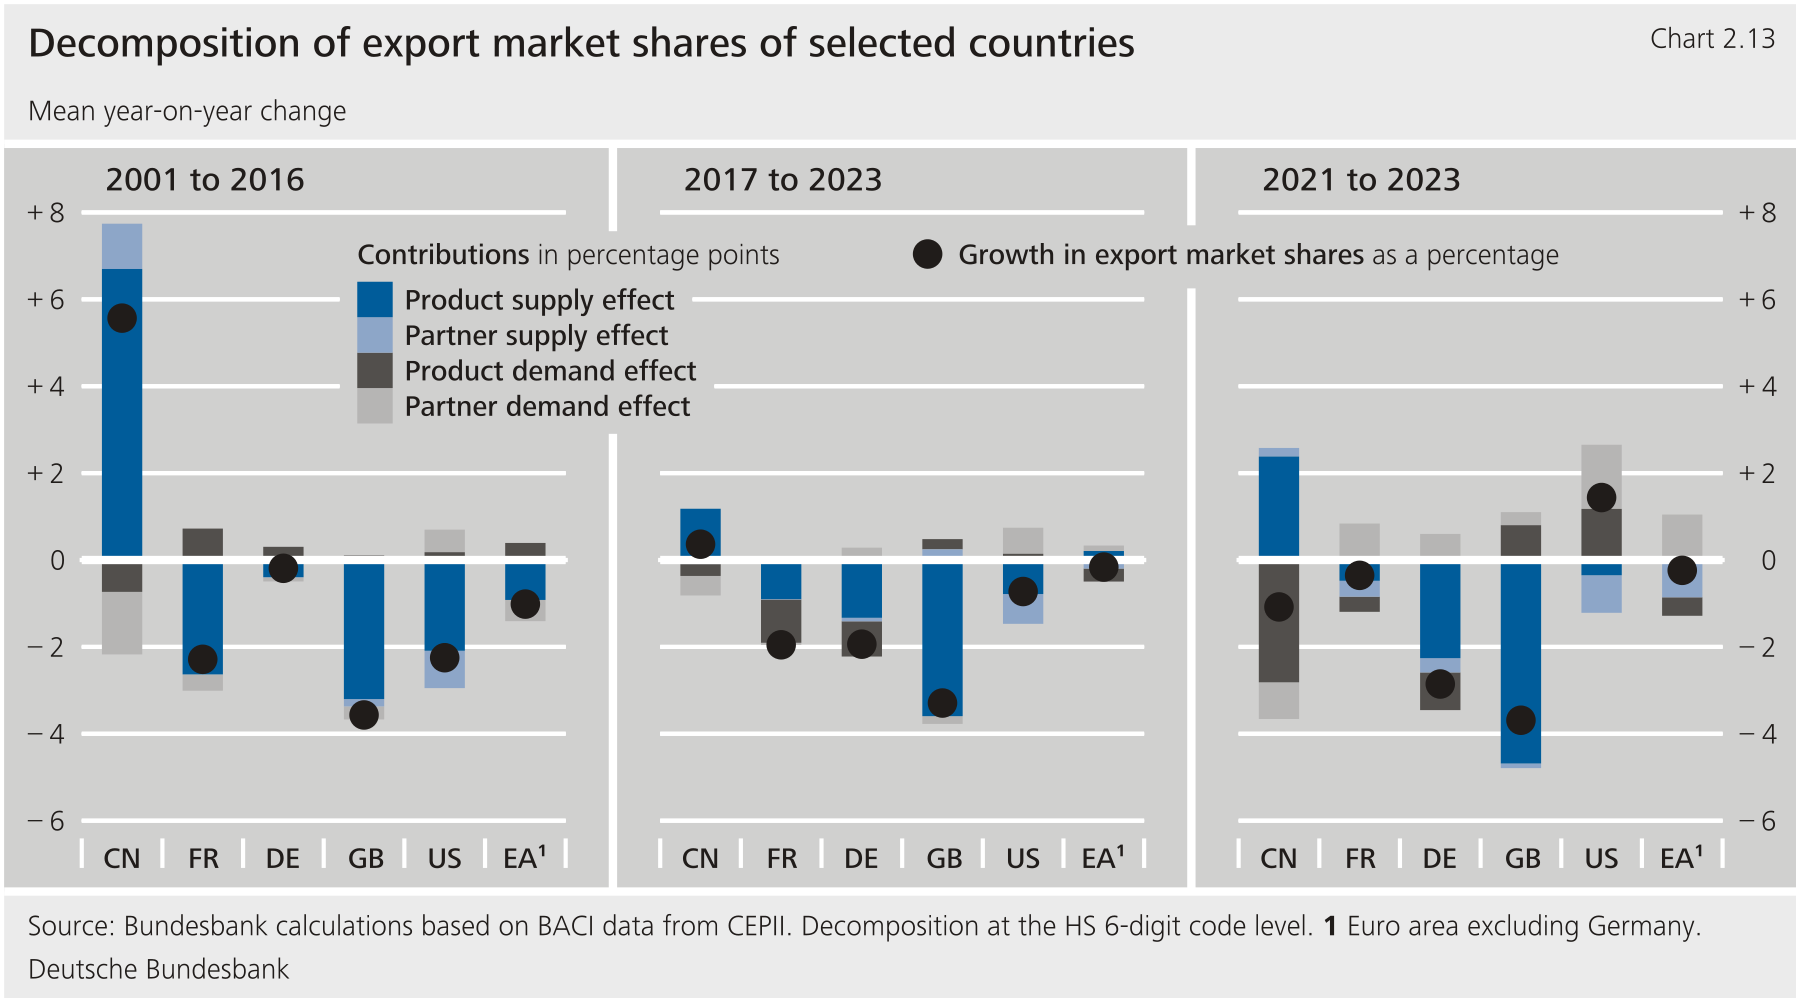**
****Since 2017, Germany has lost its former unique position in the development of export market shares and, particularly since 2021, has underperformed against other advanced economies owing to significant losses in competitiveness.** While the German economy was previously relatively competitive, since 2017 product-specific supply-side weaknesses have adversely affected market shares to a similar extent as in other countries. These weaknesses have intensified since 2021. By contrast, supply-side pressures on the market shares of other advanced economies -- with the exception of the United Kingdom due to Brexit -- have eased over time, especially since 2021. Thanks to favourable product-specific and partner-specific demand, France and the euro area excluding Germany were able to stabilise their export position, while the United States even improved its market share. China continued to expand its product-specific competitiveness, but not enough to offset the now dampening demand effects. As a result, Chinese market shares declined slightly between 2021 and 2023.[\[39\]](#_ftn_root_39) However, this is probably due in part to the initially rapid resumption of production -- following the lockdowns, which were early and strict by international standards -- and the normalisation of demand for medical masks and other medical goods.**{#par-ao23ei}
**8 Conclusion** {#tar-9}
-------------------------
****A novel decomposition of the decline in Germany's export market shares shows that the German export industry has suffered considerable global market share losses since 2021 due to a deterioration in their supply-side competitiveness.** More than three-quarters of the export market share losses between 2021 and 2023 were due to the deterioration in German exporters' competitiveness. The deterioration was broad-based across sectors and high by international comparison. This points to fundamental structural problems in the German economy that have weighed on many firms.The machinery industry, electrical industry and energy-intensive sectors such as the chemical industry were hit the hardest. The timing of losses in market share and sector-specific losses in competitiveness suggest that energy price increases and supply chain disruptions also played a significant role.**{#par-a3e19e}
****In addition, weak global demand for motor vehicles, in particular, dampened the development of German export market shares through product-specific demand effects.**As a result, the German automotive sector contributed to the market share losses primarily on account of its significant weight in the German export mix and low global demand. However, up to 2023 (the most recent data available), the competitiveness losses of Germany's automotive industry remained limited compared with those of other countries.**{#par-ie73eo}
****As competitiveness has deteriorated across the board, there is a need to improve supply conditions in Germany.** In particular, a reliable framework that is conducive to employment and investment needs to be established. To this end, incentives to work should be strengthened, barriers to the immigration of skilled workers and unnecessary red tape should be cut back, tax incentives for private investment increased, and conditions for start-ups and research and development improved, to name a few examples. Social security reforms are also essential if increases in costs and social contributions are to be limited. With regard to energy costs, it is vital to press ahead with the energy transition and do so efficiently. Furthermore, it needs to be easier for firms to diversify their supplier networks and thus make them more resilient, for example, through new free trade agreements. Some of the Federal Government's plans are aimed in this direction. However, further reform is required, particularly in light of Germany's demographic challenges.[\[40\]](#_ftn_root_40)**{#par-u8o287}
**9 List of references** {#tar-10}
----------------------------------
**Autor, D. H., D. Dorn and G. H. Hanson (2013), [The China Syndrome: Local Labor Market Effects of Import Competition in the United States](https://doi.org/10.1257/aer.103.6.2121), American Economic Review, Vol. 103(6), pp. 2121‑2168.**{#par-i9i4i1}
**Bricongne, J.-C., L. Fontagné, G. Gaulier, D. Taglioni and V. Vicard (2012), [Firms and the Global Crisis: French Exports in the Turmoil](https://doi.org/10.1016/j.jinteco.2011.07.002), Journal of International Economics, Vol. 87(1), pp. 134‑146.**{#par-e9iei2}
**Cheptea, A., G. Gaulier and S. Zignago (2005), [World Trade Competitiveness: A Disaggregated View by Shift-Share Analysis](https://www.cepii.fr/pdf_pub/wp/2005/wp2005-23.pdf), Working Paper No 2005‑23.**{#par-a1ou95}
**De Backer, K., I. Desnoyers-James and L. Moussiegt (2015), [Manufacturing or Services -- That is (Not) the Question: The Role of Manufacturing and Services in Economies](https://www.oecd.org/en/publications/manufacturing-or-services-that-is-not-the-question_5js64ks09dmn-en.html), Science, Technology and Industry Policy Paper No 19.**{#par-e1a69a}
**Deutsche Bundesbank (2025a), [German balance of payments in 2024](https://publikationen.bundesbank.de/content/952336), in: German Balance of Payments in 2024, Monthly Report, March 2025.**{#par-e7o786}
**Deutsche Bundesbank (2025b), [Financial markets](https://publikationen.bundesbank.de/content/948880), in: Financial markets, Monthly Report, February 2025.**{#par-eoi213}
**Deutsche Bundesbank (2025c), [The German economy](https://publikationen.bundesbank.de/content/957532), Monthly Report, May 2025.**{#par-ioi4ae}
**Deutsche Bundesbank (2024a), [The German economy](https://publikationen.bundesbank.de/content/943838), in: The German economy, Monthly Report, November 2024.**{#par-u68e6o}
**Deutsche Bundesbank (2024b), [Global and European Setting](https://publikationen.bundesbank.de/content/943822), in: Global and European setting, Monthly Report, November 2024.**{#par-uaue59}
**Deutsche Bundesbank (2023a), [Is price competitiveness favourable in Germany and the euro area?](https://www.bundesbank.de/content/918284), Monthly Report, October 2023, pp. 13‑38.**{#par-u7619e}
**Deutsche Bundesbank (2023b), [German enterprises' profitability and financing in 2021](https://www.bundesbank.de/content/906624), in: German enterprises' profitability and financing in 2021, Monthly Report, March 2023, pp. 69‑70.**{#par-e18e23}
**Gaulier, G., G. Santoni, D. Taglioni and S. Zignago (2013), [Market Shares in the Wake of the Global Crisis: The Quarterly Export Competitiveness Database](https://publications.banque-france.fr/en/economic-and-financial-publications-working-papers/market-shares-wake-global-crisis-quarterly-export-competitiveness-database), Banque de France Working Paper No 472.**{#par-i69298}
**Haertel, T., B. Hamburg and V. Kusin (2022), [The macroeconometric model of the Bundesbank revisited](https://www.bundesbank.de/content/888376), Deutsche Bundesbank Technical Paper No 01/2022.**{#par-ao8u29}
**Hüther, M., T. Obst and J. Pimpertz (2025), [Rising social security contributions weigh on competitiveness](https://www.iwkoeln.de/en/studies/michael-huether-thomas-obst-jochen-pimpertz-rising-social-security-contributions-weigh-on-competitiveness.html), -Policy Paper No 3.**{#par-ee4351}
**Pierce, J. R. and P. K. Schott (2016), [The Surprisingly Swift Decline of U.S. Manufacturing Employment](https://doi.org/10.1257/aer.20131578), American Economic Review, Vol. 106(7), pp. 1632‑1662.**{#par-a72378}
**Sauer, S. and K. Wohlrabe (2024), [Wettbewerbsfähigkeit der deutschen Industrie im freien Fall?](https://www.ifo.de/publikationen/2024/aufsatz-zeitschrift/wettbewerbsfaehigkeit-der-deutschen-industrie-im-freien-fall), Schnelldienst digital, 2024, 5, No 9.**{#par-e4146o}
**United Nations Industrial Development Organization (2016), [Industrial Development Report 2016 -- The Role of Technology and Innovation in Inclusive and Sustainable Industrial Development](https://www.unido.org/resources/publications/industrial-development-report-series/industrial-development-report-2016).**{#par-o71648}
{#par-e5891u}
1. **{#_ftn_root_1} The BbkM- is a semi-structural macroeconometric model; see Haertel et al. (2022).**
2. **{#_ftn_root_2} The calculations reveal a slightly positive effect for 2023. Germany's real exports rose only a little that year, but nevertheless outstripped the performance of sales markets, which contracted slightly in 2023.**
3. **{#_ftn_root_3} See Deutsche Bundesbank (2024a, 2025a).**
4. **{#_ftn_root_4} See Deutsche Bundesbank (2024b).**
5. **{#_ftn_root_5} Germany's old-age dependency ratio -- the number of individuals aged 65 or older per 100 people aged between 20 to 64 years old -- is one of the highest in the world. According to the [OECD's database](https://data-explorer.oecd.org/vis?lc=en&df%5bds%5d=DisseminateArchiveDMZ&df%5bid%5d=DF_DP_LIVE&df%5bag%5d=OECD&df%5bvs%5d=&av=true&pd=2005%2C2040&dq=AUS%2BAUT%2BBEL%2BCAN%2BCHL%2BCOL%2BCRI%2BCZE%2BDNK%2BEST%2BFIN%2BFRA%2BDEU%2BGRC%2BHUN%2BISL%2BIRL%2BISR%2BITA%2BJPN%2BKOR%2BLVA%2BLTU%2BLUX%2BMEX%2BNLD%2BNZL%2BNOR%2BPOL%2BPRT%2BSVK%2BSVN%2BESP%2BSWE%2BCHE%2BTUR%2BGBR%2BUSA%2BEU27%2BEU28%2BARG%2BBRA%2BBGR%2BCHN%2BHRV%2BCYP%2BIND%2BIDN%2BMLT%2BROU%2BRUS%2BSAU%2BZAF%2BOECD%2BOAVG.OLDAGEDEP%2BG_POP...A&to%5bTIME_PERIOD%5d=false&vw=tb), it climbed from 35 to over 42 in the ten-year period up to 2024. The average rose from 27 to 34. In addition, Germany's ratio is set to rise more strongly than the average over the next few years.**
6. **{#_ftn_root_6} In the current setting, demographic change is also contributing to rising non-wage labour costs (see Hüther et al., 2025).**
7. **{#_ftn_root_7} See [EIB Investment Survey](https://www.eib.org/en/publications-research/economics/surveys-data/eibis/index.htm?sortColumn=startDate&sortDir=desc&pageNumber=0&itemPerPage=10&pageable=true&la=EN&deLa=EN&tags=5bf8095afa70f13f9d3b51b3&orTags=true&orSubjects=true&orCountries=true).**
8. **{#_ftn_root_8} They were already starting to weaken markedly in the second half of 2023.**
9. **{#_ftn_root_9} This is mainly due to a drop in aerospace exports.**
10. **{#_ftn_root_10} In 2024, deliveries of some energy-intensive goods (chemical, paper, glass and ceramic products) recovered to only a small extent. From 2021, energy exports were also significantly lower, mainly owing to reduced exports of natural gas. Gas exports largely consist of transit imports, which contracted significantly in 2021.**
11. **{#_ftn_root_11} Exports of electronics and electrical equipment had been rising robustly overall from 2017. The same was true of exports of pharmaceutical products and other consumer goods. These product categories have suffered since 2023 insofar as they have lost upward momentum.**
12. **{#_ftn_root_12} The prospect of the end of the post-Brexit transition period, during which reciprocal market access was guaranteed under single market rules, played a particular role here.**
13. **{#_ftn_root_13} This was, amongst other things, a consequence of sanctions and changes in behaviour in response to Russia's war of aggression against Ukraine.**
14. **{#_ftn_root_14} Price-increasing effects in the wake of the energy crisis, supply bottlenecks and catch-up effects following the -19 crisis also played a part. After price adjustment, exports to the euro area and the non-euro area increased only slightly between 2017 and 2022, by 3¼ % and 3½ %, respectively.**
15. **{#_ftn_root_15} This is putting pressure on the German automotive industry, in particular; see Deutsche Bundesbank (2025a, 2024a).**
16. **{#_ftn_root_16} The analysis breaks down the global market shares of nominal goods exports.**
17. **{#_ftn_root_17} The underlying model represents a refinement of the approach of Gaulier et al (2013). Their approach distinguishes only three effects: a supply-side competitiveness effect, a demand-side product effect and a demand-side partner effect. As a result, changes in competitiveness cannot be traced back to developments related to specific products or partner countries.**
18. **{#_ftn_root_18} Changes in competitiveness relative to domestic producers are not separately accounted for in this approach. For example, a broad-based slowdown in exports to China, owing to technological advances by local producers, would therefore be classified as a partner demand effect (rather than a partner supply effect) in the decomposition.**
19. **{#_ftn_root_19} See Deutsche Bundesbank (2023a).**
20. **{#_ftn_root_20} Other indicators also suggest a deterioration in Germany's competitiveness; see Deutsche Bundesbank (2025b) or Sauer and Wohlrabe (2024).**
21. **{#_ftn_root_21} These findings are consistent with our own calculations based on the less granular decomposition used in Gaulier et al. (2013).**
22. **{#_ftn_root_22} The recent changes in Germany's export market shares were exceptionally large. In 2022, Germany lost the largest market shares in the period under review, whilst in 2023 it made the largest gains. This pronounced fluctuation is not at odds with supply-side reasons for the losses, as it could be related, amongst other things, to temporary non-recurring factors on the supply side, such as supply chain problems (see the detailed discussion below).**
23. **{#_ftn_root_23} The sum of selected individual sub-contributions may exceed 100 %, as positive and negative contributions partly offset each other. A slightly positive partner demand effect dampened the losses, whilst all other components amplified them. Accordingly, just under one-third of the overall decline can be attributed to the product demand effect.**
24. **{#_ftn_root_24} Using the method proposed by Gaulier et al. (2013), it appears that price effects contributed around one-quarter of the losses in market share. The remaining results are qualitatively in line with the findings obtained using this method.**
25. **{#_ftn_root_25} This is consistent with the fact that the category "Mineral products (including energy)" was not the key factor in the detailed analysis of product demand and product supply effects.**
26. **{#_ftn_root_26} According to data from the World Trade Organization (), German export prices (measured as unit values) rose by more than one-quarter between 2019 and 2024, while global export prices increased by less than one-fifth. In China and Japan, export prices changed very little during this period according to the , and in the United States they rose at below average rates. Germany's price competitiveness therefore likely deteriorated in relation to these countries in particular.**
27. **{#_ftn_root_27} Since this analysis is based on individual product categories, the results can only be attributed to specific economic sectors in an indirect or approximate manner.**
28. **{#_ftn_root_28} Here, the terms "machinery industry" and "electrical industry" refer primarily to the commodity groups in Chapter 84 ("Nuclear reactors, boilers, machinery and mechanical appliances; parts thereof") and Chapter 85 ("Electrical machinery and equipment and parts thereof; sound recorders and reproducers, television image and sound recorders and reproducers, and parts and accessories of such articles").**
29. **{#_ftn_root_29} See Deutsche Bundesbank (2023b). Additional negative effects stemmed from Chapter 27 "Mineral fuels, mineral oils and products of their distillation; bituminous substances; mineral waxes", particularly the groups "Petroleum gases and other gaseous hydrocarbons; in gaseous state, natural gas" (271121) and "Electrical energy" (271600). However, these effects are likely to be due to one-off factors such as changes in gas transit routes related to the war against Ukraine and the specificities of cross-border electricity trading.**
30. **{#_ftn_root_30} The analysis at the 6-digit code level assumes that the relevant competition takes place within these product groups. By definition, this approach does not consider substitution effects between different product groups -- for example, between cars with internal combustion engines and electric vehicles -- or value chain effects arising from input-output linkages. However, an analysis at the 4-digit code level, at which cars with internal combustion engines and electric motors are recorded together, confirms the key results of the disaggregated analysis. Similar results are also obtained from an analysis at the 4-digit code level of the version 2017, which more precisely delineates the relatively new product group of electric motor vehicles.**
31. **{#_ftn_root_31} If bilateral trading costs between Germany and a trading partner increase, while those between the partner and other countries remain unchanged, this leads to a negative partner supply effect for Germany in the calculations.**
32. **{#_ftn_root_32} The estimation shows that German exporters have had somewhat greater problems in the Chinese market in recent years than exporters from other countries. Developments relative to domestic producers in China are not considered in the analysis.**
33. **{#_ftn_root_33} See Deutsche Bundesbank (2024b). Changes in global demand for certain products can also be structural in nature. For example, demand for vehicles with internal combustion engines is likely to see a permanent future shift in favour of electric vehicles.**
34. **{#_ftn_root_34} Strictly speaking, the decomposition at the global level does not allow for a clear delineation between structural supply and demand effects. It assumes that global developments affecting products in a similar way across all trading partners are driven by the demand side. A global supply shock, such as supply chain disruptions, would therefore be interpreted as a demand effect in the model. By contrast, the product supply effect reflects country-specific deviations from this global pattern (i.e. when individual countries are particularly severely affected).**
35. **{#_ftn_root_35} The partner demand effect consists of average country-specific developments across all product groups as well as country-specific and product-specific combinations (for example, strong demand for motor vehicles in the United States). For Germany, the country-specific component was the dominant factor on average over the 2017 to 2023 period, although country-product effects also played an important role in certain years.**
36. **{#_ftn_root_36} In the absence of comprehensive production statistics at the product level, this analysis is based exclusively on foreign trade data. According to this logic, a broad-based increase in competition from domestic suppliers, which would affect all product groups and trading partners equally, would appear as (seemingly) declining foreign demand.**
37. **{#_ftn_root_37} According to data, France's share of the euro area aggregate excluding Germany was around 17 % in 2023.**
38. **{#_ftn_root_38} For more on the decline in manufacturing value added in advanced economies, see De Backer et al. (2015) and United Nations Industrial Development Organization (2016). See Autor et al. (2013) and Pierce and Schott (2016) for more on the "China shock".**
39. **{#_ftn_root_39} After adjusting for outliers, German and Chinese product supply effects for the period from 2017 to 2023 are negatively correlated. In other words, Germany recorded greater losses in competitiveness in precisely those product groups in which China made gains. This is broadly consistent with the hypothesis that the "China shock 2.0" -- China's advances in technologically sophisticated goods -- has adversely affected Germany's competitiveness. This interpretation is also supported by the fact that, in recent years, China has gained market shares in products that have been important for the German export mix (see Deutsche Bundesbank (2024a)).**
40. **{#_ftn_root_40} See Deutsche Bundesbank (2025c).**
*[DE]: Deutschland
*[COMTRADE]: Commodity Trade Statistics Database
*[HS]: Harmonized Commodity Description and Coding System
*[IW]: German Economic Institute
*[COVID]: coronavirus disease
*[EU]: European Union
*[GDP]: gross domestic product
*[OECD]: Organisation for Economic Co-operation and Development
*[ifo]: economic research institution
*[WTO]: World Trade Organization
*[UN]: United Nations
*[BACI]: Base pour l'Analyse du Commerce International
*[CEPII]: Centre d’études prospectives et d'informations internationales
*[US]: United States