# Does increased concentration in the banking market in the euro area cause a change in interest rate pass-through?
* [*1 Introduction*](#tar-1 "1 Introduction")
* *[*The effect of competition on interest rate pass-through -- a basic model*](#tar-2 "The effect of competition on interest rate pass-through – a basic model")*
* **[*Contestability theory and empirical evidence from the deregulation of US banks*](#tar-3 "Contestability theory and empirical evidence from the deregulation of US banks")**
* ***[*2 How can market concentration be measured, and how has it evolved in the euro area?*](#tar-4 "2 How can market concentration be measured, and how has it evolved in the euro area?")***
* ***[*Regional measures of concentration for the banking market*](#tar-5 "Regional measures of concentration for the banking market")***
* ***[*3 Empirical evidence of the effect of banking market concentration on the interest rate pass-through*](#tar-6 "3 Empirical evidence of the effect of banking market concentration on the interest rate pass-through")
* *[*3.1 Evidence of the direct effect of concentration on the interest rate pass-through*](#tar-7 "3.1 Evidence of the direct effect of concentration on the interest rate pass-through")****
* ***[*Competition and interest rate pass-through at small and medium-sized banks: an analysis based on a supervisory survey*](#tar-8 "Competition and interest rate pass-through at small and medium-sized banks: an analysis based on a supervisory survey")***
* ***[*Regional market concentration and interest rate pass-through: an analysis based on loan-level data*](#tar-9 "Regional market concentration and interest rate pass-through: an analysis based on loan-level data")
* *[*3.2 Evidence of how market concentration affects competition and how competition affects the interest rate pass-through*](#tar-10 "3.2 Evidence of how market concentration affects competition and how competition affects the interest rate pass-through")****
* ***[*4 Conclusion and outlook*](#tar-11 "4 Conclusion and outlook")***
* ***[*List of references*](#tar-12 "List of references")***
****The number of banks in the euro area has dropped significantly since the start of monetary union. This decline is associated with an increased concentration in the market for loans to non-financial corporations (). From a monetary policy perspective, this raises the question whether increased market concentration could have caused a weakening of monetary policy transmission. In this context, the focus is on the pass-through of interest rates. This describes how monetary policy measures and the associated changes in money and capital market rates are transmitted to lending rates.****{#par-a998e8}
****The effects on interest rate pass-through depend crucially on how higher concentration in the banking market impacts the intensity of competition: model-based theoretical considerations show that increased market concentration weakens the interest rate pass-through, especially when it reduces the intensity of competition. However, in theory, there is no clear link between market concentration and competition. Therefore, this question must be addressed in an empirical manner.****{#par-u45315}
****To date, the empirical literature has not provided a clear answer for the euro area: although empirical research suggests that more intense competition does, as expected, reinforce the interest rate pass-through, to date, the findings on the relationship between concentration and the intensity of competition have been inconsistent.****{#par-i34798}
****Unlike these earlier analyses, since highly detailed AnaCredit data statistics have become available, it is now possible to also obtain an accurate picture of the banking market at regional level in the euro area. In the case of loans to , empirical analysis concludes that increased concentration has not diminished the intensity of competition at the regional level. Based on current information, it follows that the question posed in the title of this article must be answered in the negative for this category of loans. However, the intensity of competition should continue to be monitored in the future, particularly if market concentration increases further, so that any potential effects on the interest rate pass-through can be identified at an early stage.****{#par-o56771}
***1 Introduction*** {#tar-1}
-----------------------------
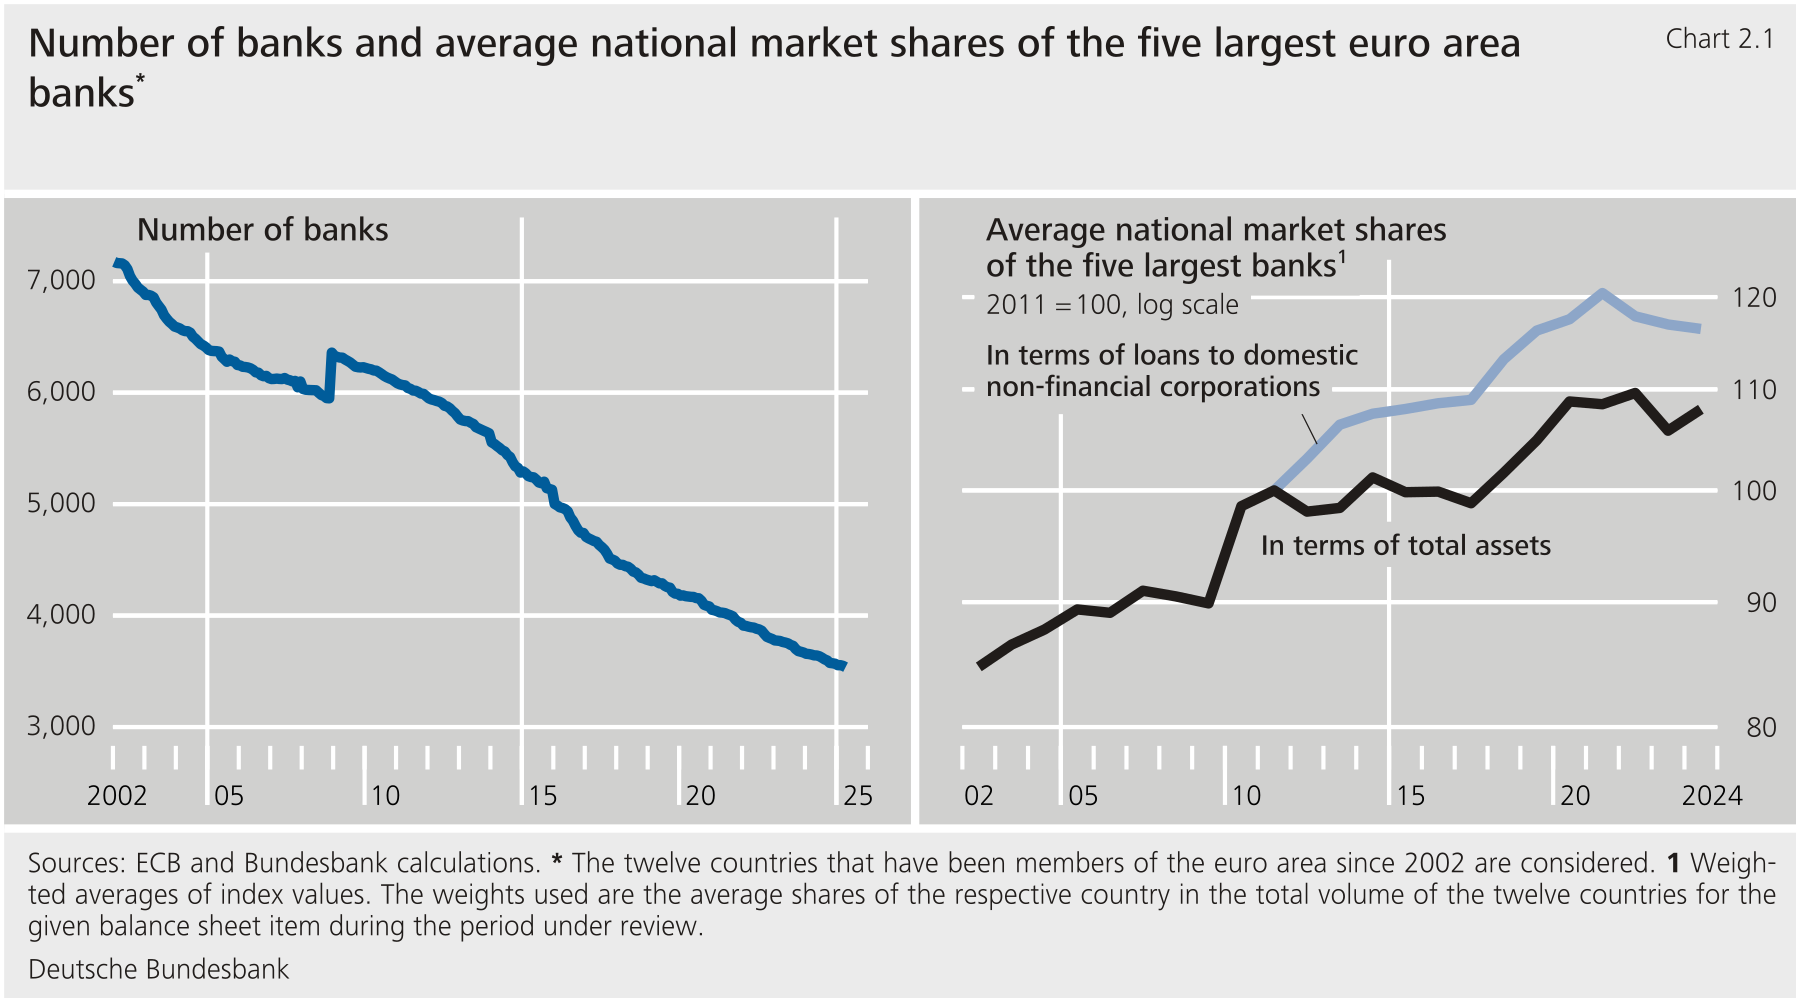
*****The consolidation of the European banking sector has been ongoing since the start of the period under review in 2002 and has led to an increasing concentration of the market.** The number of banks in the euro area has fallen more or less continuously, having roughly halved since 2002 (see Chart 2.1, left-hand side).[\[1\]](#_ftn_root_1) This decline can be attributed largely to bank mergers and acquisitions within the member states. Cross-border transactions were less significant.[\[2\]](#_ftn_root_2) In Europe, the trend has been for larger, more cost-efficient banks to acquire smaller, less efficient banks.[\[3\]](#_ftn_root_3) Consequently, the average market share of the five largest banks in the countries under review rose significantly -- both in terms of their total assets and their share of the market for loans to (see Chart 2.1, right-hand side).***{#par-i584o7}
{#par-a568ae}
****
****Does increased concentration in the banking market influence the effect of monetary policy on banks' lending rates?** The transmission of monetary policy via the banking sector is a key link in the chain of effects of monetary policy measures: a change in monetary policy affects banks' funding costs, for example because deposit rates or interest rates on the debt securities they issue change.[\[4\]](#_ftn_root_4) Banks, in turn, calculate their lending rates with a mark-up on their funding costs. In this way, changes in monetary policy are transmitted to lending rates.[\[5\]](#_ftn_root_5) This aspect of transmission is referred to as interest rate pass-through.[\[6\]](#_ftn_root_6) For monetary policy, the passing through of interest rates on loans to is of particular interest because the financing conditions for affect their investment behaviour, and this in turn has a significant impact on the economy overall.[\[7\]](#_ftn_root_7) One of the factors the Eurosystem uses to calibrate its monetary policy is historical patterns of the interest rate pass-through. However, these patterns may change over time, for instance due to an increase in concentration in the banking market. In this case, the monetary policy stimulus would require adjustment if the desired effect on bank interest rates and ultimately on inflation is to be realised. Therefore, a thorough understanding of how increased concentration in the banking sector affects the interest rate pass-through is critical for monetary policy.**{#par-au1364}
****The chain of effects that runs from concentration in the banking market to the pass-through of interest rates can be divided into two stages.**The division is based on the idea that concentration is likely to influence the interest rate pass-through primarily via the intensity of competition in the banking market:**{#par-a54ua6}
***Concentration → Competition → Interest rate pass-through***{#par-uae4i6}
**This raises two analytical sub-questions: How do changes in market concentration affect competition between banks? And how do changes in the intensity of competition affect the interest rate pass-through?**{#par-o21177}
****Less competition clearly weakens the interest rate pass-through.** Weaker competition means banks have more power to set prices. This means they can set their interest rates more independently of other banks and market conditions, including the general interest rate level. Consequently, the interest rate pass-through is lower in a less competitive environment. This applies in the context of both increasing and decreasing interest rates. It may come as a surprise that banks are expected to pass on interest rate increases to borrowers to a lesser extent when competition is weaker. However, since banks can act more like monopolists, i.e. they can weigh up price and quantity effects against each other, a symmetry emerges with regard to falling and rising interest rates (see also the supplementary information "[The effect of competition on interest rate pass-through -- a basic model](#The-effect-of-competition-on-interest-rate-pass-through---a-basic-model)"). This means that increased market concentration alone would have contributed to a reduction in interest rate pass-through since the beginning of monetary union if it had resulted in lower competition.**{#par-a7u492}
**The effect of competition on interest rate pass-through -- a basic model** {#tar-2}
-------------------------------------------------------------------------------------
****The effect of competition on interest rate pass-through can be illustrated using a basic theoretical model whereby banks operate subject to the conditions of monopolistic competition.** In this context, demand \\( x_1 \\) for the loans of a specific bank \\( i \\) depends on that bank's lending rate \\( r_i \\) compared to other offers on the market. The average lending rate on the market \\( \\bar{r} \\) is used as a benchmark for these comparative offers. Customers react with a certain degree of sensitivity \\( \\beta \> 0 \\) when a bank's lending rate deviates from the market average. If borrowers' sensitivity to interest rates is low, competition between banks for customers is weak. This means that each individual bank has the power to set its own prices to a certain degree. In other words, individual banks have some scope to raise their lending rates above those of their competitors without losing all of their customers.[\[1\]](#_ftn_4a79b971_1) A bank's pricing power can be expressed as \\( \\frac{1}{\\beta} \\): the lower the value of \\( \\beta \\), the greater the pricing power and the lower the competitive pressure. That said, in line with the structure-conduct-performance paradigm, \\( \\beta \\) could also depend on market concentration (see main article).**{#par-oi173a}
****Apart from competition with other banks, the demand for loans for an individual bank also depends on the extent to which the aggregate demand for loans responds to the average lending rate.** The sensitivity of customers with regard to the average lending rate is denoted by \\( \\gamma \\). This value is irrespective of the bank at which this demand occurs. In mathematical terms, demand for loans \\( x_i \\) for bank \\( i \\) can be expressed as follows:**{#par-ioae2u}
**$$ x_i = \\alpha -- \\beta (r_i -- \\bar{r}) -- \\gamma \\bar{r} \\tag{1} $$**{#par-oe3179}
**In this context, the constant \\( \\alpha \\) represents the non-interest portion of aggregate loan demand, which is the same for all banks. The second term denotes how loan demand changes in response to the difference between bank \\( i \\)'s lending rate and the average market rate \\( \\bar{r} \\). The third term shows that loan demand negatively depends on the average lending rate: the higher the average lending rate, the lower -- given the difference \\( r_i -- \\bar{r} \\) -- the demand. In addition, it is assumed that \\( \\beta \> \\gamma \\). This assumption ensures that demand for loans for bank \\( i \\) increases if all other banks raise their lending rates but bank \\( i \\) does not.[\[2\]](#_ftn_4a79b971_2) In this case, the lending rate of bank \\( i \\) is more attractive than the lending rates offered by other banks.[\[3\]](#_ftn_4a79b971_3)**{#par-i2ee67}
****By assumption, a bank cannot influence the interest charged on its liabilities.** It is assumed that bank \\( i \\) refinances its lending at the money market rate \\( f \\) set by the central bank. Therefore, the bank's cost function is \\( C_i=x_i \\cdot f \\). The profit of bank \\( i \\) is derived as follows:**{#par-ao9397}
**$$ \\begin{align} G_i \&= x_i r_i -- x_i f = x_i (r_i -- f) \\\\ \&= ( \\alpha -- \\beta (r_i -- \\bar{r}) -- \\gamma \\bar{r} ) \\cdot (r_i -- f) \\tag{2} \\end{align} $$**{#par-i1oo12}
**In this context, it should be noted that the profit function now no longer includes loan demand as a variable. Rather, the bank sets a lending rate that is linked to a specific demand for loans. Therefore, its lending rate implicitly determines the lending amount. Moreover, the profit function shows that the profit per unit of lending volume amounts to (\\( r_i-f \\)).**{#par-oo24e9}
**When the bank increases its lending rate, two opposing effects occur.[\[4\]](#_ftn_4a79b971_4) A change in the lending rate is described by \\( dr_i \\):**{#par-ai1oa3}
1. ****Increase in revenue per****unit of lending:** revenue per unit of lending increases by \\( dr_i \\). As a result, revenue generated from the entire lending business increases by \\( dr_ix_i \\). Therefore, when the demand function is used, revenue increases by \\( dr_i (\\alpha -- \\beta (r_i -- \\bar{r}) -- \\gamma \\bar{r} \\)).**
{#par-i852i2}
2. ****Decline in lending volume:** demand for loans and, consequently, the lending volume decline by \\( \\beta dr_ib \\), leading to a reduction in profits of \\( dr_i \\beta (r_i -- f) \\).**
{#par-i78ai9}
****To maximise its profit, the bank raises its lending rate until the additional revenue generated by the rate increase corresponds exactly to the decline in profits caused by the decline in lending volume.** [\[5\]](#_ftn_4a79b971_5)Consequently, maximum profit is attained when the following criterion is fulfilled:[\[6\]](#_ftn_4a79b971_6)**{#par-ia249a}
**$$ \\beta (r_i\^\* -- f) = \\alpha -- \\beta (r_i\^\* -- \\bar{r}) -- \\gamma \\bar{r} \\tag{3} $$**{#par-i43eau}
**In this context, \\( r_i\^\* \\) refers to the optimal lending rate at which bank \\( i \\) maximises its profit. Rearranging the equation yields the bank's lending rate equation:**{#par-uoe486}
**$$ r_i\^\* = \\frac{\\alpha}{2\\beta} + \\left( \\frac{1}{2} -- \\frac{\\gamma}{2\\beta} \\right) \\bar{r} + \\frac{1}{2} f \\tag{4} $$**{#par-o524ai}
**This equation shows how the bank's optimal lending rate depends on its pricing power \\( \\frac{1}{\\beta} \\). The greater a bank's pricing power, the higher the first term that is not dependent on the average lending rate or the money market rate. At the same time, the bank is less sensitive to changes in the average interest rate in the credit market (second term). This means that the bank's pricing power gives it the flexibility to set its lending rate more independently of comparable offers by competitors.**{#par-e35o6i}
****When a bank has greater pricing power, its lending rate is less dependent on the average interest rate, resulting in weaker interest rate pass-through.** A more detailed analysis of equation (4) demonstrates how the transmission of changes in the monetary policy rate \\( f \\) to lending rates is influenced by banks' pricing power. If the central bank raises the monetary policy rate and hence the money market rate by one unit, bank \\( i \\) responds initially by raising its lending rate by \\( \\frac{1}{2} \\) (third term in equation (4)). All other banks simultaneously raise their lending rates by \\( \\frac{1}{2} \\). Consequently, the average lending rate \\( \\bar{r} \\) also increases by \\( \\frac{1}{2} \\). The extent to which bank \\( i \\) responds to the increased average lending rate in the second step depends on how strong competition is. Precisely speaking, the increase in the second step amounts to \\( \\left( \\frac{1}{2} -- \\frac{\\gamma}{2\\beta} \\right) \\cdot \\frac{1}{2} \\). All other things being equal, an increase in the lending rates of competitor banks, expressed as a higher average lending rate \\( \\bar{r} \\), raises the demand for loans at bank \\( i \\) (second term in equation (1)). However, the increase in demand is less pronounced the lower the interest rate sensitivity \\( \\beta \\) and thus the intensity of competition. For bank \\( i \\), when its interest rate sensitivity is low, the optimal strategy is therefore to raise its lending rate less sharply in the second step than it would do if its sensitivity were higher. If the bank were to increase its lending rate more sharply, the resulting decline in demand would more than offset the additional revenue per lending unit, with the result that profits would be lower than the optimum level. A mirror-image situation arises where the central bank reduces interest rates: bank \\( i \\) responds sluggishly to interest rate cuts by all other banks when competition is low because the cuts only cause a relatively minimal decline in demand for bank \\( i \\). The average lending rate \\( \\bar{r} \\) also changes again because all banks also adjust their lending rates in the second step. This process continues and results in a feedback loop between the lending rates set by individual banks and the changes in the average lending rate. In mathematical terms, this feedback loop can be expressed as a geometric series. Taking into account the entire feedback loop between the lending rates of individual banks and the market average, it can be demonstrated that the transmission of monetary policy rate changes to lending rates can be described as follows:**{#par-o44199}
**$$ \\frac{1}{1 + \\frac{\\gamma}{\\beta}} \\tag{5} $$**{#par-e8i2ae}
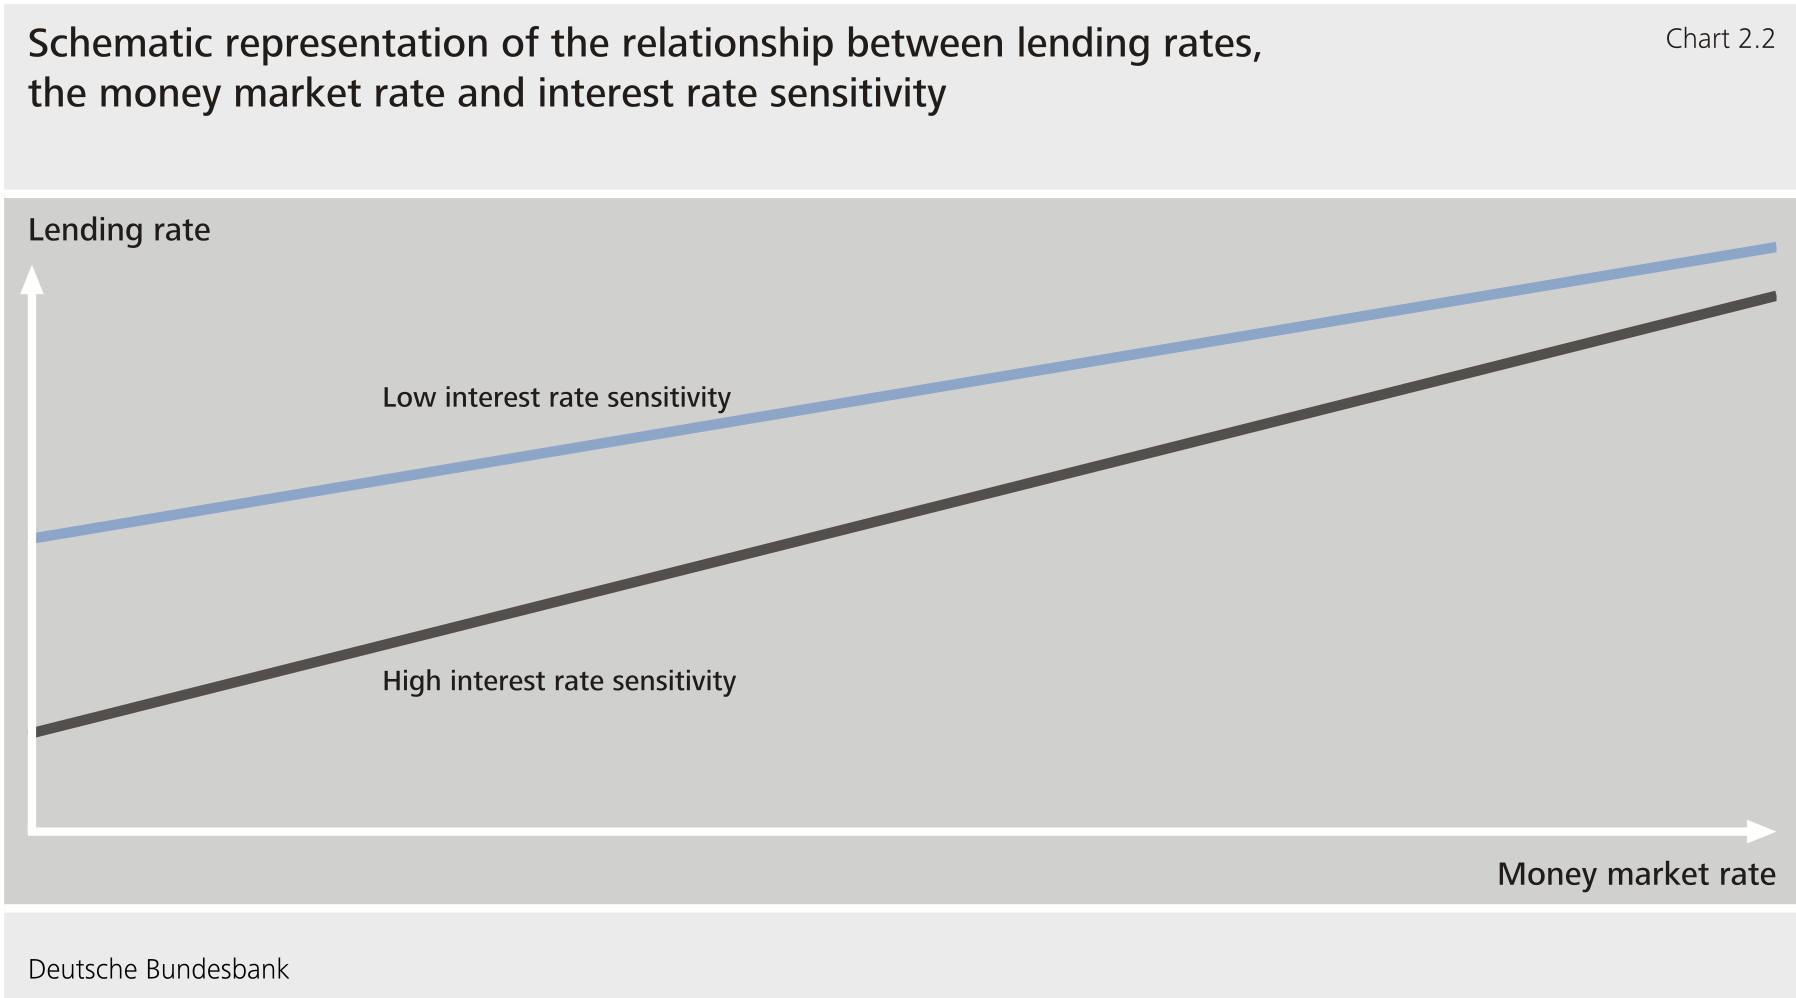
**It can be seen once again from equation (5) that the greater banks' pricing power \\( \\frac{1}{\\beta} \\), the lower the interest rate pass-through. As before, the intuition is similar to that used to respond to the average lending rate: the greater a profit-oriented bank's pricing power (i.e. the weaker the competition) the less it will respond to general market conditions, and therefore also to changes in the monetary policy rate. This also implies that the effect of higher pricing power on lending rates diminishes as the money market rate \\( f \\) increases (see Chart 2.2).[\[7\]](#_ftn_4a79b971_7)**{#par-o2ooa1}
****These results do not apply for certain demand functions.** In these cases, interest rate pass-through increases in line with the banks' pricing power.[\[8\]](#_ftn_4a79b971_8) Moreover, the mark-up on funding costs reflects the degree to which interest rates are transmitted, meaning it is always greater than one. When competition is weaker, the mark-up increases, as does the lending rate for a given level of funding cost. In these models, weaker competition therefore also results in higher lending rates; however, in contrast to the above model, it leads to a stronger transmission of monetary policy rate changes. Consequently, they present a conflicting prediction. Therefore, without knowing the demand function, the effect of competition on interest rate pass-through is unclear from a purely theoretical point of view. However, in empirical terms, interest rate pass-through is lower than one.[\[9\]](#_ftn_4a79b971_9) This outcome argues against this alternative type of demand function and supports the linear function assumed in equation (1). Therefore, theoretical models that imply an interest rate pass-through of less than one have a certain empirical validity, which lends greater weight to their broader theoretical implications.[\[10\]](#_ftn_4a79b971_10)**{#par-o1ii55}
{#par-io6i38}
****
1. **{#_ftn_4a79b971_1} One reason why customers accept differences in lending rates between banks to a certain extent could be that they incur costs when obtaining and comparing loan offers. It may also be that customers value the physical proximity of a bank or have a relationship of trust with their principal bank and therefore are less inclined to consider alternative offers.**
{#par-oi2769}
2. **{#_ftn_4a79b971_2} The implicit assumption here is that there are enough banks for the lending rate charged by an individual bank to have virtually no effect on the market average.**
{#par-ei385a}
3. **{#_ftn_4a79b971_3} In equilibrium, the bank sets its lending rate such that it can actually meet the demand for loans. This means that \\( x_i \\) is not only the demand for loans, but also the actual volume of lending provided.**
{#par-o8o844}
4. **{#_ftn_4a79b971_4} Conversely, this also applies to reductions in the lending rate.**
{#par-i4451e}
5. **{#_ftn_4a79b971_5} A further increase in the lending rate would cause profits to fall again because the impact of declining demand for lending would now outstrip the additional revenue.**
{#par-i55o48}
6. **{#_ftn_4a79b971_6} Equation (3) can formally be derived by calculating the derivative of the profit function from equation (2) with respect to the lending rate \\( r_i \\) and determining the zero of the derivative: \\( \\frac{dG_i}{dr_i} = -\\beta (r_i -- f) + \\alpha -- \\beta (r_i -- \\bar{r}) -- \\gamma \\bar{r} = 0 \\). Rearranging this equation yields equation (3).**
{#par-o222ae}
7. **{#_ftn_4a79b971_7} In fact, there is also a value for the money market rate at which the effect disappears completely, i.e. where the two lines intersect in Chart 2.2. However, this value is so high that, at the lending rate that banks would then choose, there would be no more demand for loans. The linear demand function assumed here can be considered an approximation of a "true" non-linear function. This linear approximation would be highly inaccurate at the point where the two lines intersect, rendering it unsuitable for analysis in this area.**
{#par-e343ou}
8. **{#_ftn_4a79b971_8} See, for example, Gerali et al. (2010) and Gödl-Hanisch (2022).**
{#par-e19i7i}
9. **{#_ftn_4a79b971_9} See Deutsche Bundesbank (2023) and Wang et. al (2022).**
{#par-u59372}
10. **{#_ftn_4a79b971_10} The intensity of competition in the deposit market also affects interest rate pass-through for loans. This is discussed, for example, in Drechsler et al. (2017) and in Wang et al. (2022). Due to their pricing power, banks transmit monetary policy rate changes to deposit rates at a ratio of less than one-to-one. This has an impact on their funding costs and, consequently, on the pricing of loans.**
{#par-oa9e47}
****On the face of it, it may seem obvious to equate higher market concentration with lower competition, but this is not necessarily the case: the relationship between concentration and competition is more complex.** The causal relationship between increased market concentration and lower competition is postulated by the structure-conduct-performance paradigm, which posits that increased concentration within the banking sector, leading to monopolistic tendencies, results in less competitive behaviour by banks.[\[8\]](#_ftn_root_8) This can be explained by the fact that in a more concentrated market, potential borrowers tend to be confronted with banks that have a higher share of the market. According to the theory, these factors lead to customers being more willing to accept a loan offer from a bank rather than rejecting it in the hope of securing a more attractive offer from another bank. An alternative motivation for the structure-conduct-performance paradigm is that collusive behaviour, such as implicit price collusion, is easier for banks in more concentrated markets. Collusive behaviour also reduces the intensity of competition and allows banks to impose higher lending rates. However, intense competition is in principle also conceivable in markets with only a few banks.**{#par-o747ee}
****Moreover, there are alternative hypotheses.** The efficient structure hypothesis posits that consolidation in the banking sector is also the consequence of intense competition, with more efficient banks increasing their market share.[\[9\]](#_ftn_root_9) According to the theory of contestable markets, the actual degree of market concentration is of less importance. Rather, it depends on the extent to which other banks have the opportunity to enter a market (see the supplementary information "[Contestability theory and empirical evidence from the deregulation of banks](#Contestability-theory-and-empirical-evidence-from-the-deregulation-of-US-banks)"). These considerations show that the relationship between market concentration and competition is not clear a priori, i.e. on the basis of economic theory.**{#par-o86eo8}
****Consequently, this article looks at previous empirical studies examining the effect of concentration on the interest rate pass-through at the country level and supplements them with new research findings by the Bundesbank.** [\[10\]](#_ftn_root_10)The latter are based on much more detailed data than previous studies, in particular, AnaCredit data statistics, which contain millions of observations at the level of individual loans in the euro area. This extensive data set makes it possible, for instance, to calculate precise concentration measures for regional banking markets.**{#par-o967ue}
**Contestability theory and empirical evidence from the deregulation of banks** {#tar-3}
----------------------------------------------------------------------------------------
****The theory of contestable markets developed by Baumol et al. (1982) argues that it is not the number of firms or the concentration of competitors in a market that determines competitive intensity.** Rather, the possibility of new firms entering the market is already enough to shape competition in that market. If no barriers to market entry exist whatsoever, new competitors can enter without much effort and compete with firms already operating in the market. The absence of market entry barriers does not necessarily have to result in new competitors entering the market: the mere possibility of this happening forces incumbent firms to contend with potential competition. This means that, from a theoretical point of view, even a monopolist behaves as if it were operating in a fully competitive market. However, if market entry barriers exist, lowering them leads to falling prices, a reduction in any abnormally high profits or monopoly rents, and the elimination of allocative and productive inefficiencies. Determining the degree of competition empirically on the basis of this theory is not straightforward as it is difficult to measure the absolute cost of (potential) market entry.**{#par-o77265}
****To determine how competition impacts market behaviour, we can thus examine how changes in market entry barriers impact firms' behaviour.** For this type of investigation, the gradual deregulation of legal barriers to market entry for banks in states between the 1970s and 1990s constitutes an ideal experiment, particularly since changes in market entry barriers are not attributable to changes in banking competition but rather to (exogenous) changes in the legal framework.**{#par-e49852}
****Prior to deregulation, the federal political structure in the United States meant that licences (also known as charters) to engage in banking business were not issued at federal level, but by the individual states where the charter holders sought to operate.** Consequently, banks were only permitted to open branches in the state in which they were chartered. Moreover, to prevent banking monopolies from forming, the ability to expand geographically within a state was also heavily restricted, meaning that banks were only permitted to establish branches within a certain radius (e.g. 30 miles, or roughly 50 kilometres) of their main office. These regulations created barriers to market entry for potential competitors from other states and resulted in a largely fragmented, state-specific banking market in the United States.**{#par-e6iu8i}
****As technology progressed and a range of financial innovations were developed, these market entry barriers increasingly became less relevant.** In the mid-1970s, some states began to implement legislation that gradually eliminated these barriers to both intrastate and interstate market entry. The wave of deregulation culminated in the Interstate Banking and Branching Efficiency Act of 1994, a federal law applicable nationwide that lifted all remaining restrictions on banking activities across state lines. The elimination of these entry barriers resulted in the consolidation of the locally fragmented banking market in the United States and paved the way for the emergence of major regional banks.**{#par-i58a67}
****Many empirical studies examine the elimination of market entry barriers as described above and conclude that it has a positive impact on economic growth, the establishment of new firms, macroeconomic risk sharing and income inequality.** [\[1\]](#_ftn_4286ad74_1)An analysis of the banking sector also indicates that the increased competitiveness of local banking markets boosted banks' profitability and loan quality and enhanced the stability of the entire banking system.[\[2\]](#_ftn_4286ad74_2)**{#par-e66e85}
****It is not surprising that the elimination of entry barriers enabled more efficient banks to expand geographically and to increase their market share.** Bank acquisitions and mergers not only reduced the number of existing banks but also brought about economies of scale and created larger, more efficient banks.[\[3\]](#_ftn_4286ad74_3) Geographic diversification also contributed to reducing cluster risks in the banking sector.[\[4\]](#_ftn_4286ad74_4)**{#par-io375e}
****In addition to creating more efficient regional banks, the deregulation of market entry restrictions also forced existing banks to optimise their operations in order to remain competitive.** Empirical evidence suggests that the removal of market entry barriers increased the efficiency of existing banks by lowering costs and improving profitability. As a result, bank customers were able to secure loans on more favourable terms and increase the profitability of their investment options in the face of increased competition for deposits. It is worth noting that the improvements observed (1) occurred very quickly after the entry barriers were removed and (2) were more pronounced when banks were more exposed to the potential entry of new competitors (because of their geographical location, for instance). These developments suggest that the deregulation of market entry barriers led to a rapid increase in competition.[\[5\]](#_ftn_4286ad74_5)**{#par-e97i6a}
****As previously explained, the theory of contestable markets does not address the question of whether easier market access for potential competitors will also lead to a specific market structure (such as, for instance, more market participants, lower concentration of firms).** The mere possibility of entering a market is sufficient to strengthen competition, and removing barriers to entry does not necessarily bring about changes to the local market structure. This can also be illustrated by the example of the deregulation of entry barriers in the banking market: market concentration rose across regions (e.g. concentration of banks in all northeastern states, measured using the Herfindahl-Hirschman Index). By contrast, the market structure of local banking markets (e.g. within a metropolitan area) did not change significantly after the entry barriers were removed.[\[6\]](#_ftn_4286ad74_6)**{#par-i376ea}
1. **{#_ftn_4286ad74_1} See Jayaratne and Strahan (1996), Goetz and Gozzi (2022) and Beck et al. (2010).**
{#par-e1uu44}
2. **{#_ftn_4286ad74_2} See Jayaratne and Strahan (1998) and Goetz (2018).**
{#par-a58aeo}
3. **{#_ftn_4286ad74_3} See Stiroh and Strahan (2003).**
{#par-i25o89}
4. **{#_ftn_4286ad74_4} See Goetz et al. (2016).**
{#par-aa23ie}
5. **{#_ftn_4286ad74_5} See Goetz (2018).**
{#par-i3auu6}
6. **{#_ftn_4286ad74_6} See Dick (2006).**
{#par-iai22e}
**2 How can market concentration be measured, and how has it evolved in the euro area?** {#tar-4}
-------------------------------------------------------------------------------------------------
****The theoretical concept of measuring concentration in the banking market is simpler than its empirical implementation.** Concentration in a market is usually calculated on the basis of market share, which is then aggregated to obtain measures of market concentration. A simple approach is to add up the combined market share of the largest banks, typically three or five. This measure is referred to as the concentration ratio (concentration ratio 3 or concentration ratio 5, or ). Squaring the market shares of all banks and then adding them together yields the Herfindahl-Hirschman Index ().[\[11\]](#_ftn_root_11) Higher concentration in terms of these measures occurs when the number of banks decreases as a result of mergers or acquisitions, or when market share shifts from smaller to larger banks. Conversely, the increase in market concentration brought about by a decline in the number of banks can be offset by a transfer of market share from larger to smaller banks. When calculating the concentration measures, the question arises of how to appropriately define the market to which the shares relate. Ideally, the market would be defined according to the question being asked. In reality, however, this is often limited by the availability of data.**{#par-iu8a22}
****The spatial boundary of the market corresponds to the geographical units for which market share is calculated.** Market share is often calculated at a national level because the necessary data is readily available. However, there are many banks for which the entire national market is not relevant because they operate only in geographically confined regional markets. This particularly applies in Germany and, given the principle of regionalism, above all to savings banks and cooperative banks. In this case, it makes sense to define the relevant market at regional rather than national level.[\[12\]](#_ftn_root_12) More detailed data, ideally at individual loan level, is required to calculate market share at regional level accurately.**{#par-o54ieo}
****AnaCredit now provides a source of data based on loan-level data, which makes it possible to calculate measures of concentration for loans to** **at a detailed level in the euro area.** This allows the market share to be calculated at regional level based on loan-level data. The data can also be used to determine subcategories of the lending business with , such as business with small enterprises. Both can be used to good effect in the empirical analysis of the link between concentration and the interest rate pass-through (see [section 3](#3-Empirical-evidence-of-the-effect-of-banking-market-concentration-on-the-interest-rate-pass-through)). Based on AnaCredit data, the banking market in Germany appears to be significantly more concentrated when regional market share figures are used than when national market shares are used (see supplementary information "[Regional measures of concentration for the banking market](#Regional-measures-of-concentration-for-the-banking-market)"). This result is hardly surprising given that savings banks and cooperative banks, which have a market share of just under 50 % in Germany of loans to , have traditionally had a strong regional focus.**{#par-e21898}
**Regional measures of concentration for the banking market** {#tar-5}
----------------------------------------------------------------------
****Measures of market concentration can be calculated for different spatial units.** In this context, the spatial unit selected determines the geographical boundaries of the market shares used. For instance, this method can be used to determine measures of concentration at the national or regional level. Where necessary, regional measures can be aggregated by calculating weighted averages for a higher geographical level.[\[1\]](#_ftn_48b3b361_1) A comparison of the measures of concentration at the national and regional level is presented below. 3 regions were used as regional units for this purpose.[\[2\]](#_ftn_48b3b361_2) In Germany, these regions comprise administrative districts and independently administered cities.**{#par-u74622}
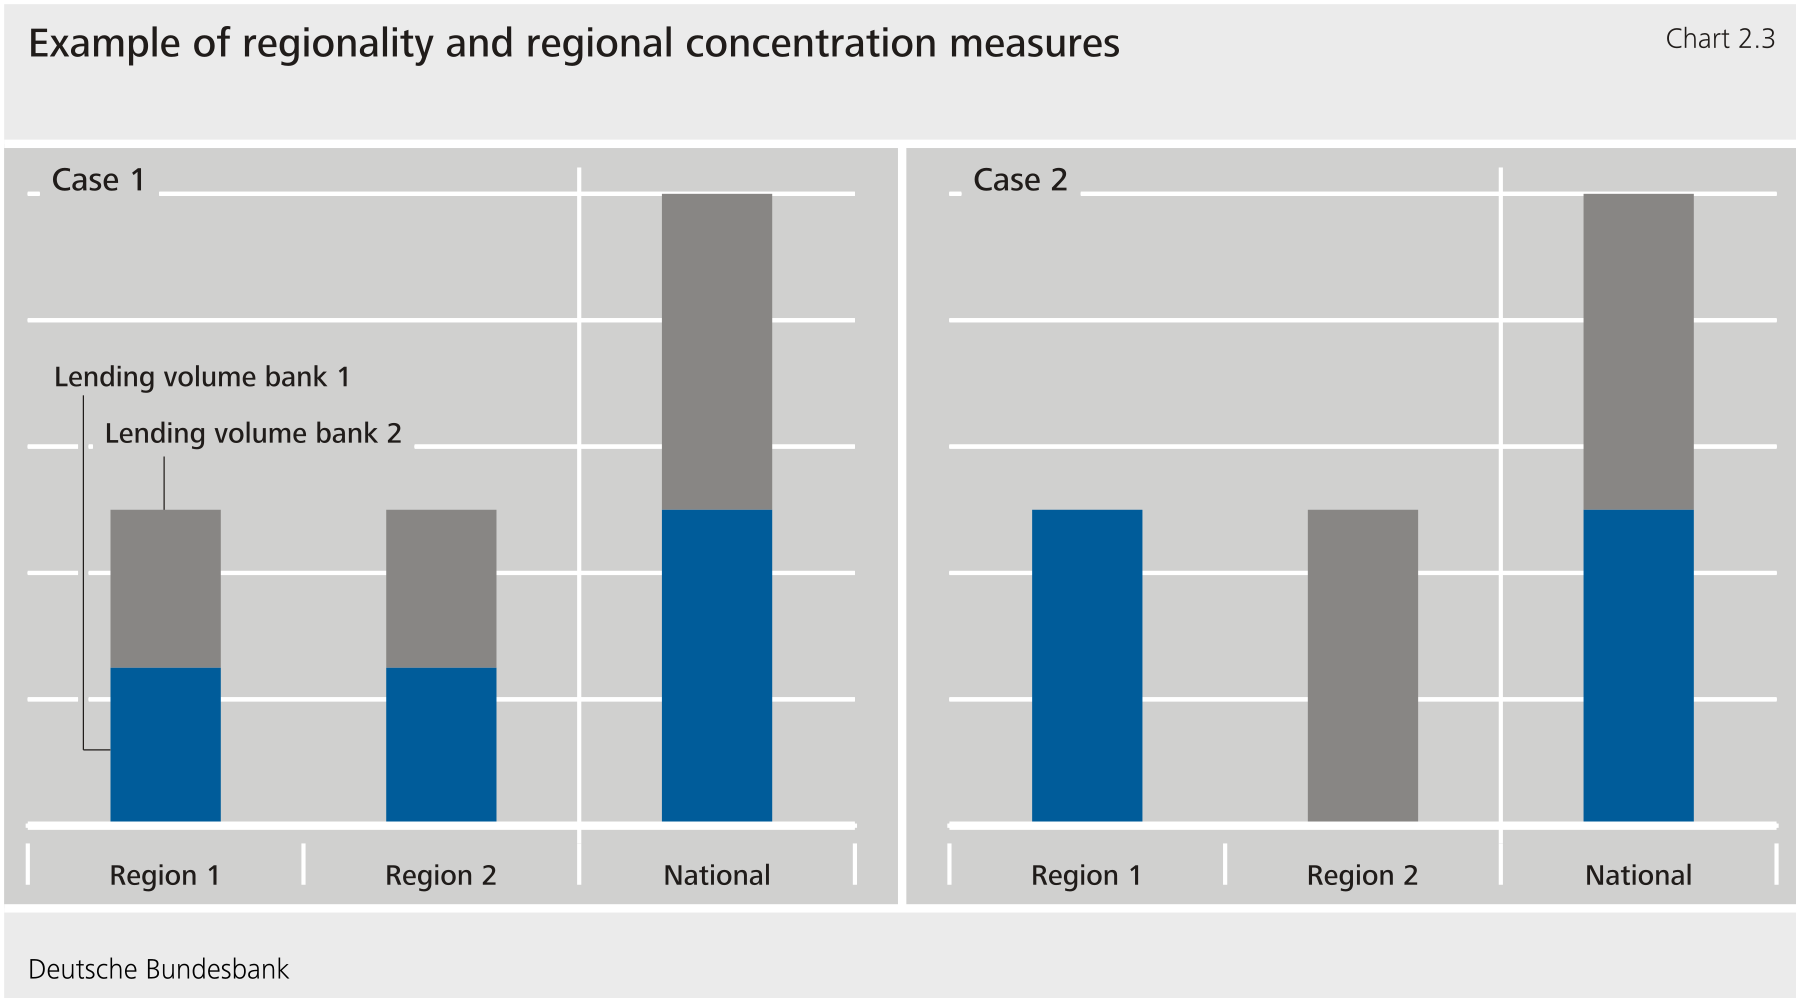
****Where individual banks have a strong regional focus, measures of concentration at the regional level yield different results to those at the national level.** This can be demonstrated using a basic illustrative example: take a country that has two regions and two banks operating within them. The two banks and the two regions are identical in terms of lending volumes. In the first case, each bank has a 50 % market share in each region. In the second case, one of the banks covers the entire market in one region and the other bank covers the entire market of the other region (see Chart 2.3). In both cases, based on national market shares, the Herfindahl-Hirschman Index () at the national level is 0.5² + 0.5² = 0.5. Thus, the market shares at the national level are the only relevant factor for the at the national level. The extent to which these shares are distributed at a lower regional level is immaterial in this context. By contrast, if one considers regional , both regions have a of 0.5² + 0.5² = 0.5 in the first case (each bank covers one half of the two markets) and a of 1² = 1 in the second case (each market is covered in its entirety by one bank). Calculating the national aggregate as the average of the regional and weighting these with the regional lending volumes yields the following result: 0.5 x 0.5 + 0.5 x 0.5 = 0.5 in case one and 0.5 x 1 + 0.5 x 1 = 1 in case two. This example also shows that the difference between average regional and national represents an indicator of the regionality of the banking market.**{#par-uaa73i}
{#par-u54872}
****
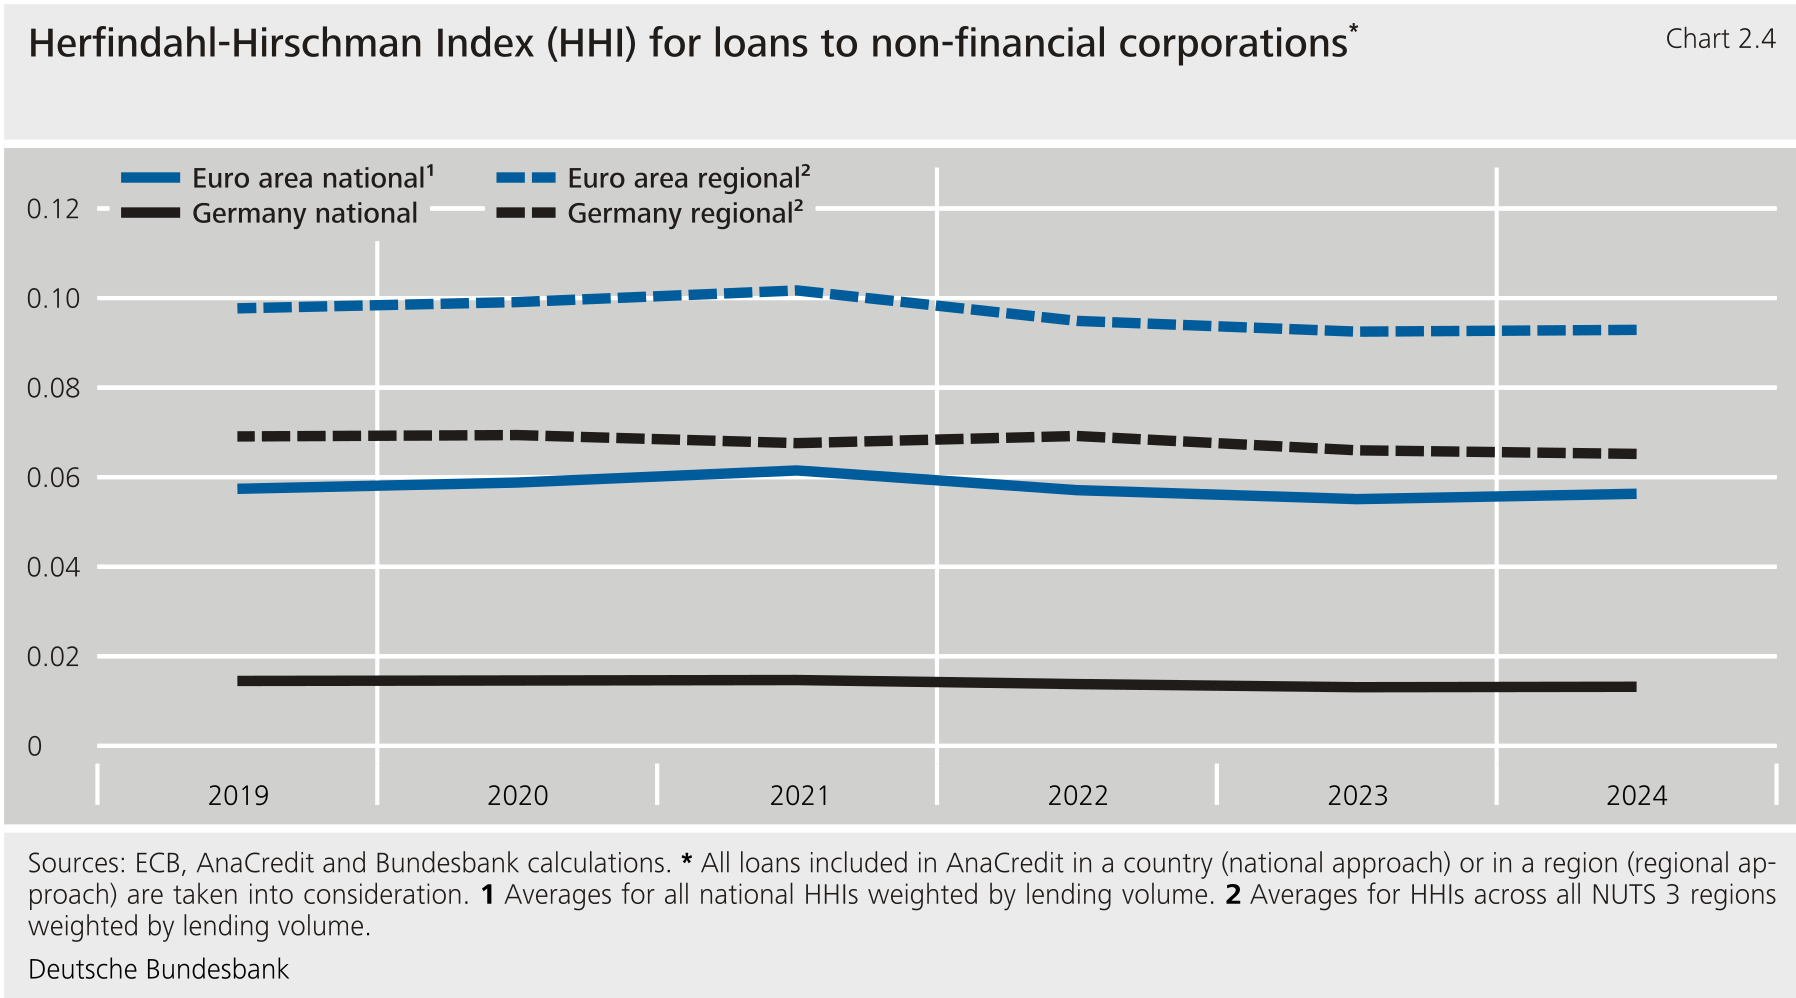
****Detailed data are required to calculate regional measures of market concentration.** The data must provide information on the volumes of the relevant balance sheet item at bank-region level. The relevant information on loans to non-financial corporations () for all euro area countries can be found in AnaCredit.[\[3\]](#_ftn_48b3b361_3) The data demonstrate that the average regional in both Germany and the euro area as a whole is higher than the average national (see Chart 2.4).[\[4\]](#_ftn_48b3b361_4) However, the corresponding difference is greater for Germany. This suggests that, as a whole, the banking market in Germany is more regional in nature than the banking market in the euro area overall. Furthermore, the level of concentration is higher in the euro area than in Germany, both nationally and regionally. In this context, it should, however, be noted that the spatial area of 3 regions can differ systematically between countries.**{#par-a82618}
{#par-aa5749}
****
1. **{#_ftn_48b3b361_1}This type of aggregation is also used in the analyses in the main text when measures of market concentration at the national level are aggregated at the euro area level.**
{#par-e9785u}
2. **{#_ftn_48b3b361_2} is an abbreviation of "nomenclature des unités territoriales statistiques".**
{#par-o13978}
3. **{#_ftn_48b3b361_3} Loans to only have to be reported in AnaCredit if the sum of all outstanding loans at the bank-borrower level is equal to or greater than €25,000 (see European Central Bank (2019)).**
{#par-eo673u}
4. **{#_ftn_48b3b361_4} The regional for the euro area is a weighted average of the in all 3 regions in the euro area, whereas, as stated in the main text, the national is a weighted average of all member countries. However, by contrast to the main text, the calculations include all euro area member countries. In addition, the loans of all banks reported in the AnaCredit European dataset are taken into account. This also includes loans granted by foreign banks.**
{#par-uii2oa}
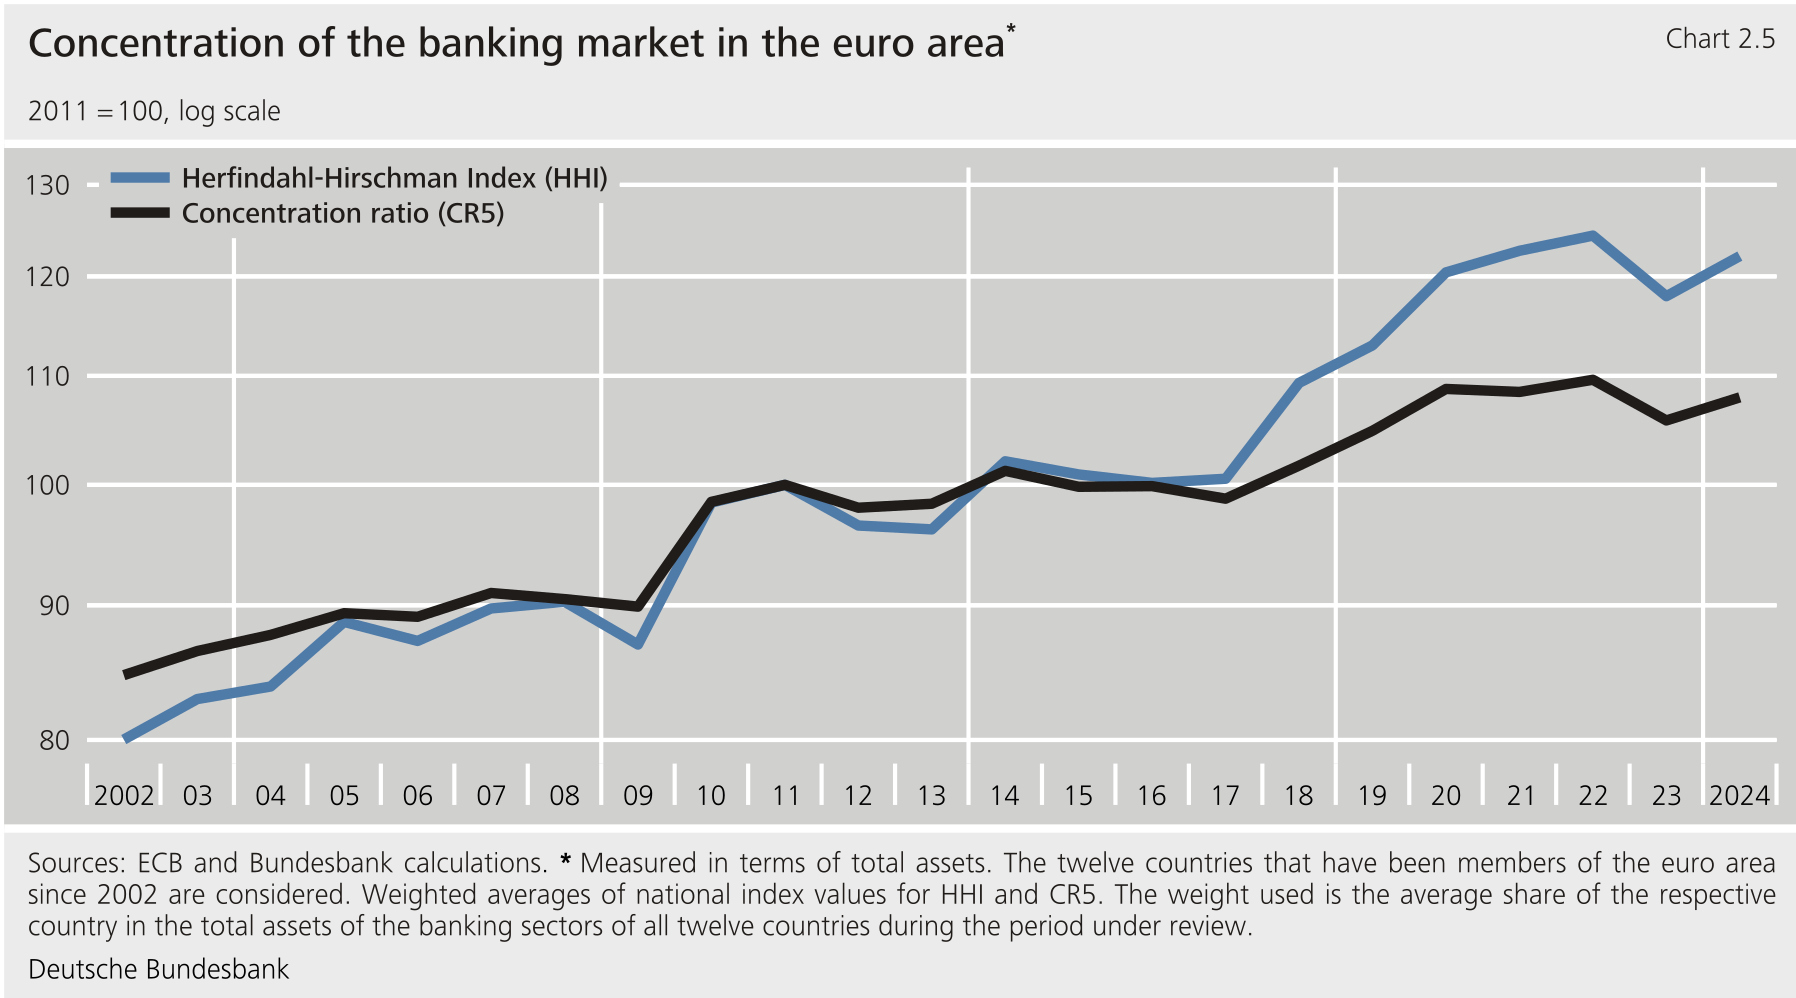
****In the period under review from 2002 to the present, the concentration of banking markets in euro area member states increased when viewed on a national basis.** As explained in the introduction using as an example, this applies to both loans to and total assets. It also applies to total assets when concentration is calculated using the (see Chart 2.5, which also includes the concentration for total assets based on the presented in Chart 2.1 for reference).[\[13\]](#_ftn_root_13)**{#par-io3ia6}
{#par-a8o877}
****
**3 Empirical evidence of the effect of banking market concentration on the interest rate pass-through** {#tar-6}
-----------------------------------------------------------------------------------------------------------------
****In view of the considerations outlined above, two approaches are taken to perform an empirical analysis of how concentration in the banking market affects the interest rate pass-through.**The first approach examines the effect of market concentration on the interest rate pass-through directly, without taking "detours" via intensity of competition. The second approach looks at both stages of the chain of effects separately: the effect of concentration on the intensity of competition, and the effect of intensity of competition on the interest rate pass-through. The following literature overview begins by presenting studies that examine the direct effect of market concentration on interest rate pass-through. This is followed by an examination of approaches that address both stages of the chain of effects separately. Table 2.1 contains an overview of all studies that were taken into account.**{#par-o8187o}
{#par-o4u58a}{#par-o4o271}{#par-u76a91}{#par-eoo55u}{#par-a443a6}{#par-u8859e}{#par-uai48o}{#par-ie59i5}{#par-ee811u}{#par-i6aa47}{#par-a2a973}{#par-oo12a5}{#par-e91i8i}{#par-oau6o9}{#par-i9496e}{#par-o8oi7i}{#par-eu1389}{#par-o2u5ii}
| **Table 3.1: Overview of relevant empirical research** ||||||
| Study | Country/group of countries | Measure of concentration/competition | Geographical definition | Loan category^1^ | Results consistent with working hypothesis?^2^ |
|-------------------------------------|----------------------------|--------------------------------------|----------------------------|-----------------------------------------------------|------------------------------------------------|
| **Concentration** →**interest rate pass-through** ||||||
| Sander and Kleimeier (2004) | Euro area | , | National | Short-term and long-term loans to | Partially |
| Kok Sørensen and Werner (2006) | Euro area | , | National | Loans to , loans to households | Partially |
| Heckmann-Draisbach and Hardt (2024) | Germany | | Regional (bank microdata) | Loans to , loans to households, loans to government | Yes |
| Bredl (2025) | Euro area | | Regional (loan-level data) | Loans to small | No |
| **Concentration** →**competition** ||||||
| Bikker and Haaf (2002) | Industrial countries | , , , , H statistic | National | Not relevant^3^ | Yes |
| Hempell (2002) | Germany | , , , , H statistic | National | Not relevant^3^ | No |
| Claessens and Laeven (2004) | Countries worldwide | , H statistic | National | Not relevant^3^ | No |
| Corvoisier and Gropp (2002) | Euro area | | National | Customer loans | Yes |
| Heckmann-Draisbach and Hardt (2024) | Germany | | Regional (bank microdata) | Loans to , loans to households, loans to government | Yes |
| Bredl (2025) | Euro area | | Regional (loan-level data) | Loans to small | No |
| **Competition** →**interest rate pass-through** ||||||
| van Leuvensteijn et. al (2013) | Euro area | Boone indicator | National | Loans to | Yes |
| Leroy and Lucotte (2015) | Euro area | Lerner index | National | Loans to | Yes |
| Heckmann-Draisbach and Hardt (2024) | Germany | Lerner index | Bank microdata | Loans to , loans to households, loans to government | Yes |
{#par-uu6au1}
### **3.1 Evidence of the direct effect of concentration on the interest rate pass-through** {#tar-7}
****Studies at country level provide only limited evidence of an effect of concentration in the banking market on the transmission of interest rates for loans to** .Although Sander and Kleimeier (2004) along with Kok Sørensen and Werner (2006) find evidence of a weaker interest rate pass-through in euro area member states with more concentrated banking markets, it remains limited to loans with specific maturities or the interest rate pass-through in the short term. However, in the case of other maturities or the long term, there is no evidence of a relationship between concentration and the interest rate pass-through.**{#par-ie1144}
****More recent studies examine how market concentration influences interest rate pass-through at the regional level.** This level is especially relevant for banking markets that are very regionally structured (see [section 2](#2-How-can-market-concentration-be-measured-and-how-has-it-evolved-in-the-euro-area-)) and where competition is therefore limited in geographical terms. This is because national measures of market concentration provide an insufficient approximation of the actual relevant regional concentration levels for this type of banking market.**{#par-ui7o51}
****Heckmann-Draisbach and Hardt (2024) find that regional market concentration in the banking market influences the interest rate pass-through in Germany.** Their analysis is based on data obtained from a supervisory survey. The survey gives an indication of the lending rates that banks assume in two scenarios for loans to private households, and government (for details, see the supplementary information "[Competition and interest rate pass-through at small and medium-sized banks: an analysis based on a supervisory survey](#Competition-and-interest-rate-pass-through-at-small-and-medium-sized-banks-an-analysis-based-on-a-supervisory-survey)"). Since the analysis is based on bank-level data -- and not on loan-level data -- it is assumed that a bank's entire operations are allocated to the region where it maintains its head office. Using these data, the authors investigate the effect of increased regional market concentration, as measured by the regional , on interest rate pass-through in the lending and deposits business at small and medium-sized banks. The results show that the interest rate pass-through is weaker in regions with a high degree of market concentration than in regions with a lower degree of concentration.**{#par-ua69i6}
**Competition and interest rate pass-through at small and medium-sized banks: an analysis based on a supervisory survey** {#tar-8}
----------------------------------------------------------------------------------------------------------------------------------
****The study by Heckmann-Draisbach and Hardt (2024) examines the interest rate pass-through by small and medium-sized banks in Germany for sight deposits and loans under various competitive conditions.** To this end, the authors draw on information from the 2017 low-interest-rate survey,[\[1\]](#_ftn_4db594b3_1) whereby banks provided forecasts for interest rates on overnight deposits from, and loans to non-banks in two scenarios: it is assumed that (1) reference interest rates will increase by 200 basis points across all maturities, or (2) there will be no change in reference interest rates. Given that the scenarios differ only in terms of the assumptions made regarding reference interest rates and that individual bank information is available for all participating banks[\[2\]](#_ftn_4db594b3_2) in both scenarios, these data are particularly well suited to analysing interest rate pass-through and to isolating supply-side effects.**{#par-o12u9i}
****The Herfindahl-Hirschman Index** ()**is used as a measure of market concentration.** When calculating it, a bank's lending and deposit activities are attributed to its head office. Based on this, the concentration of business in the regional unit selected (for instance, administrative district or federal state) is determined. The Lerner Index () as a direct measure of competition compares a bank's revenues with its marginal costs, which are derived by estimating a cost function, and provides a measure of an individual bank's pricing power. Whereas the thus describes the market concentration in a region, the is an indicator of the pricing power of individual banks.**{#par-e29144}
****First, the effect of market concentration on lending rates is estimated.** The regression equation is as follows:**{#par-a3ao11}
**$$ r_j\^p = \\alpha_0 + \\alpha_1 HHI_c\^p + \\sum_{m=2}\^{M} \\alpha_m X_{jm} + \\varepsilon_j $$**{#par-u6i3i6}
**where \\( r_j\^p \\) stands for the interest rate of bank \\( j \\) in portfolio \\( p \\) (loans or deposits), \\( HHI_c\^p \\) denotes the for the portfolio in region \\( c \\) and the vector \\( X_{jm} \\) comprises various bank-specific control variables such as measures of a bank's leverage or liquidity. In line with the structure-conduct-performance paradigm, it can be seen that lending rates are higher in more concentrated regions. Therefore, these empirical findings mean that market concentration can also be interpreted as an indicator of market power.**{#par-a67354}
****This is followed by an estimation of the effect of the** **and** **on banks' interest rate pass-through.** [\[3\]](#_ftn_4db594b3_3)**{#par-ea844o}
**$$ PT \\ r_j\^p = \\alpha_0 + \\alpha_1 HHI_d\^p + \\varepsilon_j $$**{#par-o13817}
**$$ PT \\ r_j\^p = \\alpha_0 + \\alpha_1 LI_j + \\varepsilon_j $$**{#par-ie9o5o}
**In this case, \\( PT \\ r_j\^p \\) stands for the interest rate pass-through of a bank \\( j \\) in portfolio \\( p \\), in other words the difference between the interest rates in scenarios (1) and (2). This analysis shows that banks with greater market power (i.e. banks in regions with a higher or banks with a higher ) plan to pass on interest rate changes to a lesser extent in their lending and deposit business, i.e. on both the assets and liabilities side. More precisely: on the whole, banks with greater market power charge higher lending rates, yet pass on only a smaller proportion of interest rate increases. This seems to indicate that customer relationships are an essential part of these banks' business model and that their business operations are less susceptible to market influences. With regard to deposits, interest rate pass-through is also less pronounced at banks with greater market power. Customer relationships could also be a factor here, given that customers in this constellation appear to maintain their business relationship with the bank even in the face of less favourable interest rates.**{#par-eu7641}
****Heckmann-Draisbach and Hardt (2024) analyse the effect of market concentration, also by drawing on alternative approaches to the** **described above.** First, in robustness analyses, large banks[\[4\]](#_ftn_4db594b3_4) that do not have a regional focus are either included or excluded. It appears that excluding major banks does not significantly alter the results. Second, regional population density is used as a measure instead of the . The assumption behind this is that densely populated regions (like cities) have better access to information (for example through more advertising) and that, as a result, population density may correlate negatively with market concentration. The study shows that population density can be used to explain the varying extent to which interest rates are passed on.**{#par-ia2i38}
****The findings suggest that the pass-through of interest rate changes is limited by low competition and/or a high concentration of banks.** The study demonstrates that supply-side factors are a relevant driver in this regard.**{#par-o8eae5}
1. **{#_ftn_4db594b3_1} See Deutsche Bundesbank and Federal Financial Supervisory Authority (2017).**
{#par-i8ue8e}
2. **{#_ftn_4db594b3_2} Participation in the survey was mandatory for all 1,555 small and medium-sized banks, accounting for approximately 88 % of all banks in Germany.**
{#par-u9u7o9}
3. **{#_ftn_4db594b3_3} Given that the data for all banks are available for two scenarios that differ only in terms of interest rate level, other factors can be excluded. Heckmann-Draisbach and Hardt demonstrate in robustness analyses that this is supported by the data.**
{#par-e9uie4}
4. **{#_ftn_4db594b3_4} Significant institutions subject to supervision by the European Central Bank did not participate in the survey. Nevertheless, they were taken into account when determining market concentration (and subsequently omitted from the robustness analyses).**
{#par-u2e429}
****Based on the comprehensive loan-level database AnaCredit for the euro area, Bredl (2025) finds regional concentration on the interest rate pass-through.** The author uses loan-level data to calculate measures of concentration at the regional level (for details, see the supplementary information "[Regional market concentration and interest rate pass-through: an analysis based on loan-level data](#Regional-market-concentration-and-interest-rate-pass-through-an-analysis-based-on-loan-level-data)"). This data basis is particularly suitable for the subject matter under investigation. This is because, unlike bank-level data, for example, it enables an exact regional allocation and therefore precise measurement of market concentration at the regional level. Second, it enables a focus on loans to small , i.e. the market segment for corporate loans in which the regional pricing power of banks is most relevant. By contrast, the funding conditions of large enterprises are likely to be less influenced by concentration in the regional banking market. Bredl (2025) examines whether regional market concentration influenced the interest rate pass-through during the monetary tightening phase in 2022 and 2023 but finds no significant relationship.**{#par-ao2i8i}
****While the older empirical literature on the relationship between market concentration and interest rate pass-through has come to inconsistent conclusions, more recent approaches based on higher-quality data for the euro area find no such relationship.** The question of whether the inconsistency of the findings (see Table 2.1) is attributable to differences in the data used and methodologies employed in the studies, or to the fact that different types of loans, countries and time periods were examined, lies outside the focus of this article. However, the fact that the quality and scope of the AnaCredit data used in the study by Bredl (2025) are so high is an indication that this analysis can be given more weight than the other studies. This means that, for the euro area as a whole, market concentration does not currently play a significant role in interest rate pass-through in business with . This is all the more true given that a) the regional level was selected as a geographical demarcation that is likely to be particularly relevant to the intensity of competition; b) it was possible to calculate the concentration at this level exactly using the data available; and c) the focus was placed on small , i.e. the group of borrowers for whom the regional market structure is most relevant.**{#par-a2e5a4}
**Regional market concentration and interest rate pass-through: an analysis based on loan-level data** {#tar-9}
---------------------------------------------------------------------------------------------------------------
****The relationship between market concentration and interest rate pass-through can be examined in particularly great detail using loan-level data, in other words data based on individual loan agreements.** These data can be used to calculate measures of market concentration for individual regions and, simultaneously, to analyse the pricing of individual loans. This means that the relevance of regional market concentration in the pricing of loans can be examined in regression models that take into account a range of additional factors at loan, borrower, bank and regional level. In addition, this approach makes it possible to focus the analysis on a well-defined submarket in a targeted manner.**{#par-o77887}
****The study by Bredl (2025) examines how regional market concentration affects the pricing of loans to small and micro-enterprises in the euro area.**[\[1\]](#_ftn_4ec99bdc_1) Regional market concentration effects are more likely to be seen in business with these firms than in business with large corporations. AnaCredit credit data statistics are used as the data basis.**{#par-u7623o}
****The first step is to calculate measures of regional concentration.**The calculation is carried out at the 3 region level,[\[2\]](#_ftn_4ec99bdc_2) based on data for December 2021. To this end, the volumes of all outstanding loans to small and micro-enterprises in December 2021 are aggregated. Aggregation is carried out at the level of the lending bank and the region where the borrowing enterprise is located. The market share of each bank in each region is subsequently calculated on the basis of these aggregated volumes. The market shares of individual banks can be monitored for each region where companies are located to which the bank has granted loans recorded in AnaCredit. The Herfindahl-Hirschman Index () is then derived by totalling the squared market shares of all banks within a region.**{#par-o472a4}
****The next step is to examine the explanatory power of regional**,**regional bank-specific market shares and the interaction of both variables for lending rates.** In this context, the analysis focuses on new loans granted to small and micro-enterprises in the euro area in 2022 and 2023. The sample comprises approximately one million loans. This period is of particular interest since it covers a phase of exceptionally intense monetary tightening. The underlying regression equation can be simplified as follows:**{#par-e56811}
**$$ r_{i,b,j,t}=\\beta_1 HHI_{reg(j)}+\\beta_2 MA_{reg(j),b}+\\beta_3 HHI_{reg(j)}MA_{reg(j),b}+\\gamma 'x_{i,b,j,reg(j),t}+\\varepsilon_{i.b,j,t} $$**{#par-e192aa}
**In this equation, \\( r_{i,b,j,t} \\) refers to the interest rate on the loan \\( i \\) granted by bank \\( b \\) at period \\( t \\) to firm \\( j \\), whose registered office is in region \\( reg(j) \\). Moreover, \\( HHI_{reg(j)} \\) stands for the in region \\( reg(j) \\), while \\( MA_{reg(j),b} \\)is the market share of bank \\( b \\) in region \\( reg(j) \\). The vector \\( x_{i,b,j,reg(j),t} \\) comprises many control variables: loan-specific parameters such as original maturity, loan volume or degree of collateralisation, regional variables such as regional population density or regional income per capita, as well as bank-specific variables such as (the logarithm of) total assets. This is supplemented by a varying set of fixed effects that encompass, at a minimum, all factors at the level of time, country, sector and firm size. Finally, \\( \\varepsilon_{i,b,j,t} \\) stands for the error term, which reflects the unexplained portion of the lending rate.**{#par-oo365a}
****The examination first focuses on how regional measures of market concentration affect the level of lending rates.**It turns out that the bank-specific market share, in particular, exerts an effect on the lending rate: a larger market share for a bank is associated with a higher lending rate for that bank in the respective region. Though the effect of the concentration of the regional market, as measured by the , is also positive, it is significantly weaker than that of the bank-specific market share. Using the estimated parameters \\( \\beta_1 \\), \\( \\beta_2 \\) and \\( \\beta_3 \\) as a basis, the effect of concentration measures on the region's average interest rate can also be calculated. This depends on the regional , and not the market shares of individual banks. This is because of the way the is structured: it consolidates the market shares of all banks in a region, with the result that bank-specific market shares are absorbed by the aggregate. Taking an aggregate view, the effect of the regional on the regional average interest rate is non-linear. This is because the impact of an increase in the depends on its initial level. The effect of an increase in the is positive as long as it is below 0.2. For most regions, the is between 0.1 and 0.2, i.e. within the range at which the effect is positive. A positive effect is consistent with the structure-conduct-performance paradigm, according to which a higher concentration of the banking market correlates to banks having greater pricing power. However, the relationship between concentration and lending rates disappears when bank-specific factors are taken into account via fixed effects at bank level. This suggests that individual banks do not align their lending rates with regional or regional market share. Rather, the measured effects of regional concentration on lending rates appear to be due to differences between banks -- and not to differences across lending rates within an individual bank. Effects based on differences within banks would constitute conclusive evidence of the impact that concentration has on lending rates. By contrast, it seems reasonable to assume that effects due exclusively to differences between banks are not, in fact, driven by market structure, but by unobserved bank-specific characteristics. This means that the empirical evidence overall tends to suggest that regional concentration in the banking market does not have an influence on the level of lending rates.**{#par-uu8ea7}
****This is followed by an analysis of the impact of regional market concentration on interest rate pass-through.**For this analysis, the model outlined above is first extended by interacting all variables with the three-month . This market interest rate has in the past proved a suitable reference rate for loans to non-financial corporations in the euro area.[\[3\]](#_ftn_4ec99bdc_3) By interacting the concentration variables with the three-month , it can be determined whether these variables have an impact on interest rate pass-through.**{#par-eeao23}
****In addition, it is examined how regional market concentration affects the way monetary policy surprises are transmitted to lending rates.**Monetary policy surprises refer to changes in market interest rates that occur within a narrow time frame around the announcement of a monetary policy decision.[\[4\]](#_ftn_4ec99bdc_4) The advantage of these surprises is that they can be attributed relatively clearly to the corresponding monetary policy decision. By contrast, general market interest rate movements can also be driven by other factors, such as broader macroeconomic developments. In such cases, the extent to which potential reactions of lending rates are actually attributable to monetary policy or to these other factors remains unclear. By examining the interaction between monetary policy surprises and concentration measures, it is possible to determine the extent to which their transmission depends on market concentration.**{#par-uio2e4}
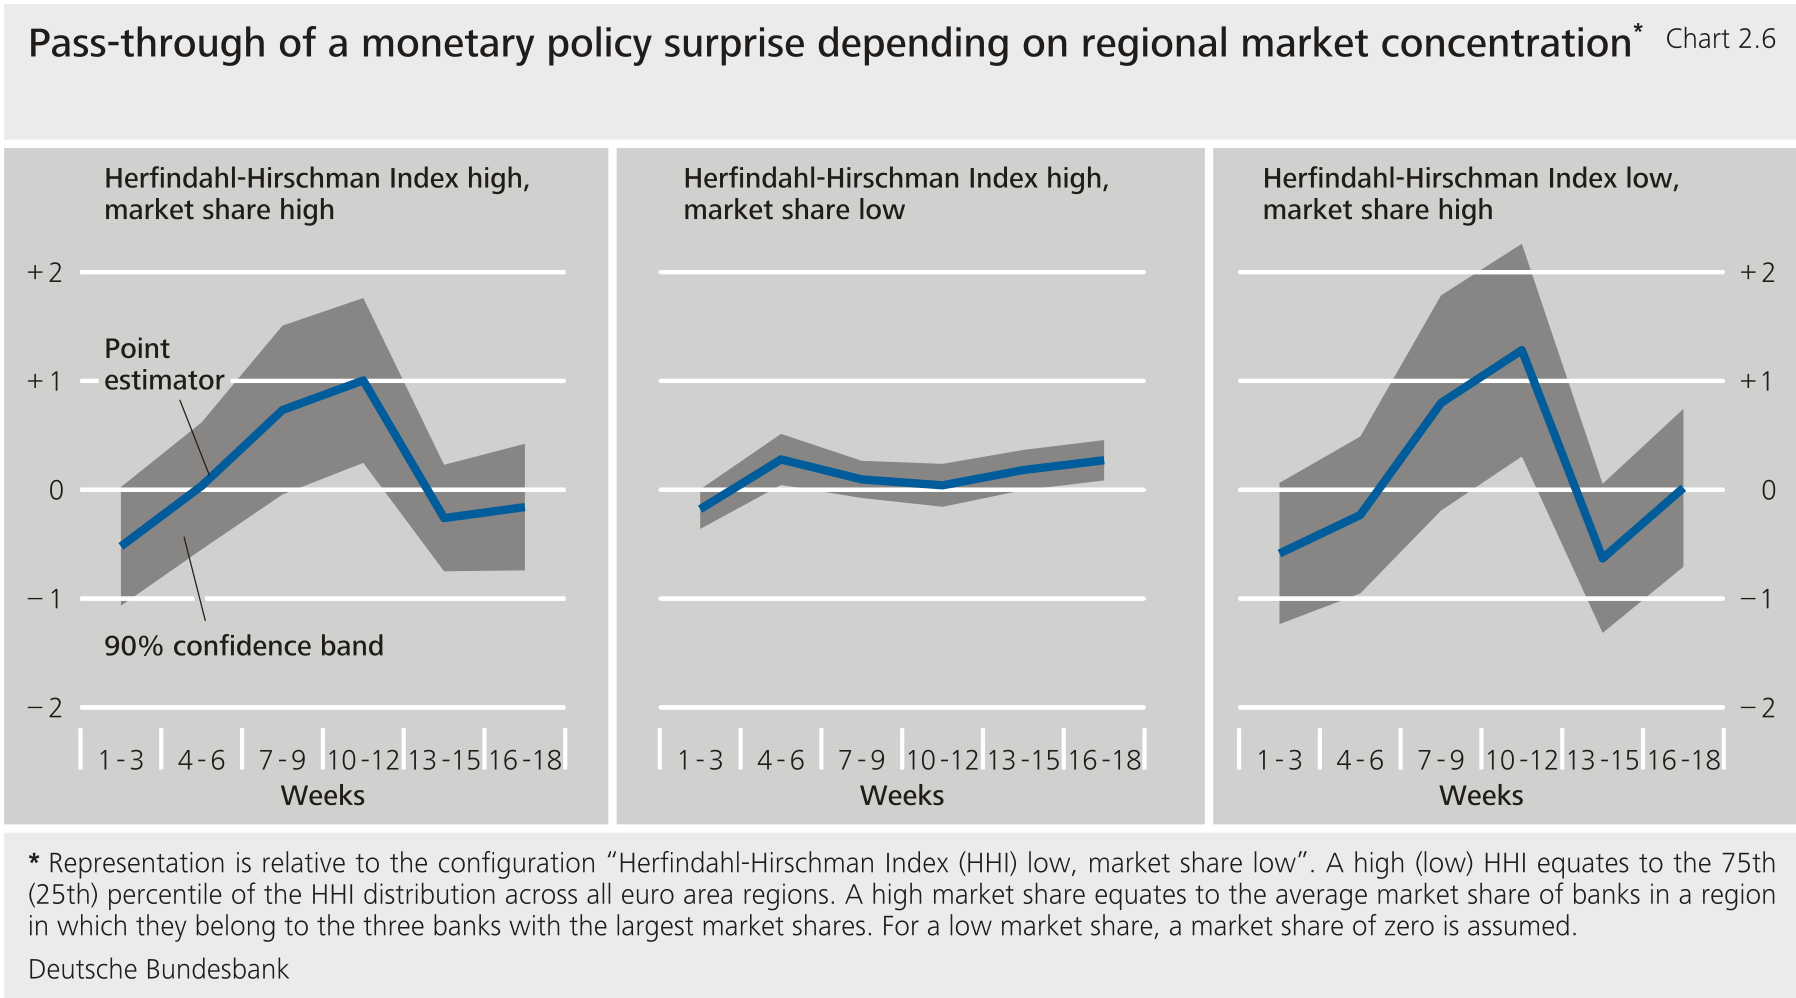
****It turns out that regional market concentration has no definite effect on the transmission of changes in the three-month****or monetary policy surprises.**Although a larger bank-specific market share does appear to be associated with a weaker transmission of monetary policy surprises in the immediate term, this relationship reverts after a few weeks and eventually disappears almost entirely (see Chart 2.6).[\[5\]](#_ftn_4ec99bdc_5) All in all, the study therefore provides no evidence of a significant relationship between regional market concentration and the extent of interest rate pass-through.**{#par-a58u35}
{#par-ouiai6}
****
1. **{#_ftn_4ec99bdc_1} The sample is narrowed down further by applying additional criteria to ensure a higher degree of homogeneity across the loans in the sample. See Bredl (2025) for details.**
{#par-o75u38}
2. **{#_ftn_4ec99bdc_2} In Germany, 3 regions correspond to administrative districts and independently administered cities.**
{#par-ee4ei8}
3. **{#_ftn_4ec99bdc_3} See Deutsche Bundesbank (2023).**
{#par-a8u2e5}
4. **{#_ftn_4ec99bdc_4} See Altavilla et al. (2019).**
{#par-a8ua1o}
5. **{#_ftn_4ec99bdc_5} A positive (negative) estimator in the chart implies stronger (weaker) pass-through for the respective configuration relative to the configuration "Herfindahl-Hirschman Index low, market share low."**
{#par-i78419}
### **3.2 Evidence of how market concentration affects competition and how competition affects the interest rate pass-through** {#tar-10}
****A separate empirical analysis for both stages of the chain of effects aims to produce additional findings.**Its purpose is to clarify, in particular, if the inconsistent findings on the effect of concentration in the banking market on the interest rate pass-through can be attributed to how market concentration affects competition or to the relationship between the degree of competition and the interest rate pass-through. To this end, a measure of the intensity of competition is required.**{#par-au6e87}
****Measures of competition based on observable market results have become established in the literature.** The measures commonly used are the H statistic developed by Panzar and Rosse (1987), the Lerner Index (see also the supplementary information "[Competition and interest rate pass-through at small and medium-sized banks: an analysis based on a supervisory survey](#Competition-and-interest-rate-pass-through-at-small-and-medium-sized-banks-an-analysis-based-on-a-supervisory-survey)") and the Boone indicator.[\[14\]](#_ftn_root_14) None of these measures of competition are based on market concentration.[\[15\]](#_ftn_root_15) As such, examining the influence of market concentration on these measures is, in principle, a valid test of the influence of market concentration on competition. However, using these measures is not without its issues. This is especially true of the H statistic.[\[16\]](#_ftn_root_16) The calculation of the Lerner Index or the Boone indicator requires relevant variables to be estimated using complex econometric methods, which again leads to inaccuracies.**{#par-i1271e}
****As an alternative to measures of competition, the level of lending rates can be used as an indicator of competition.** This is because the intensity of competition is reflected directly in product pricing, which, in the case of loans, means lending rates.[\[17\]](#_ftn_root_17) Comparatively high lending rates in a country or region are therefore an indicator of weak competition. However, it is also important to bear in mind other factors of relevance to interest rates. If, for example, the creditworthiness of firms in a region is very poor, high lending rates in this region are not necessarily the result of weak competition in the banking market. They may also result from the high mark-ups that banks charge to offset the high risk of borrower default. If empirical evidence still indicates that concentration in the banking market has a positive effect on lending rates, even when these other relevant factors are taken into account, this would support the structure-conduct-performance paradigm (see Introduction). After all, this posits that a higher concentration means weaker competition.[\[18\]](#_ftn_root_18)**{#par-aee82e}
****Empirical studies at country level paint a mixed picture with regard to the first stage, the relationship between market concentration and intensity of competition.** Based on the H statistic as a measure of the intensity of competition, Bikker and Haaf (2002) find that competition tends to be weaker in countries with more concentrated banking markets. This result is compatible with the structure-conduct-performance paradigm. This also applies for the studies by Corvoisier and Gropp (2002) and Heckmann-Draisbach and Hardt (2025). They demonstrate that, in the euro area and Germany, lending rates tend to be higher when the banking market is more concentrated. By contrast, Claessens and Laeven (2004) find no evidence, based on the H statistic, for weaker competition in countries with greater banking market concentration. Hempell (2002), too, concludes that increased market concentration in Germany's banking sector during the 1990s did not result in weaker competition, as measured by the H statistic.**{#par-i1745o}
****Bredl's (2025) study, based on loan-level data drawn from AnaCredit, also provides no evidence to support the structure-conduct-performance paradigm.** Although interest rates on loans to are higher on average in regions with a higher concentration of banks, this difference is caused solely by variations in pricing between banks. However, banks operating in multiple regions do not seem to adjust their pricing to the respective regional concentration, i.e. they do not charge higher interest rates in regions where they have a larger market share. This casts doubt on the issue as to whether the effects identified between banks are actually attributable to the concentration of regional banking markets. They could instead be driven by other unobserved bank-specific characteristics. One such characteristic may be a bank's efficiency, which, according to the efficient structure hypothesis, is a key factor in the relationship between market structure and competition. All in all, the findings of Bredl's (2025) study refute the negative relationship between concentration and intensity of competition.**{#par-i3ue4o}
****With regard to the second stage, empirical studies predominantly suggest a clear correlation between intensity of competition and the degree of interest rate pass-through.**With regard to the euro area, van Leuvensteijn et al. (2013) and Leroy and Lucotte (2015) use measures of competition to demonstrate that weaker competition results in a weaker interest rate pass-through. Van Leuvensteijn et al. (2013) employ the Boone indicator for this purpose, while Leroy and Lucotte (2015) use the Lerner Index. Therefore, the findings of these studies are consistent with the theoretical considerations presented in the introduction and in the supplementary information on competition and interest rate pass-through. Moreover, Heckmann-Draisbach and Hardt (2024) also provide corresponding evidence at the individual bank level for Germany. The findings of their study suggest that interest rate pass-through is weaker for banks in Germany for which the Lerner Index signals an environment with weaker competition.**{#par-oo1u8o}
**The findings on the lack of an overall effect of increased market concentration on the interest rate pass-through are due to the fact that increased concentration is not synonymous with reduced intensity of competition.**{#par-i1a317}
**4 Conclusion and outlook** {#tar-11}
--------------------------------------
****Theoretical considerations do not provide a conclusive answer to the question whether increased concentration in the banking market in the euro area gives rise to changes in the interest rate pass-through.** This is because the effect of concentration on the intensity of competition in the banking market is not clear. By contrast, it is easier to establish, both theoretically and empirically, that the intensity of competition has a positive effect on the interest rate pass-through.**{#par-u93894}
****Empirical evidence reflects the ambiguity at the theoretical level.** The findings of empirical studies do not provide a consistent picture of the relationship between market concentration and intensity of competition. By contrast, a consistent picture emerges for the effect of intensity of competition on interest rate pass-through: increased competition clearly correlates with a stronger interest rate pass-through, in line with theoretical considerations.**{#par-e9io7u}
****The use of detailed loan-level data indicates that market concentration does not have a significant effect on the pass-through of interest rates for loans to** . The advantage of loan-level data drawn from AnaCredit is first and foremost that they allow for a precise measurement of market concentration at the regional level. In addition, they enable the focus to be placed on business with small enterprises. It is for these enterprises that the regional concentration of the banking market should be most relevant. Therefore, it seems reasonable to place greater weight on empirical findings on this basis. Analysis using this database leads to the conclusion that, to date, increased concentration in the banking market in the euro area has not had a significant effect on the interest rate pass-through for loans to . The reason for this seems to be that increased concentration has not, thus far, led to a reduction in the intensity of competition.**{#par-o6816u}
****The effect of concentration on the interest rate pass-through in the banking market should continue to be monitored.** In this context, the unclear relationship between market concentration and intensity of competition should be addressed in particular. Further investigation seems to be advisable, especially if the concentration process continues apace. In fact, the motives underlying mergers in the banking market may change over time. To date, it appears that varying levels of efficiency between banks have been the main driver of consolidation in the euro area (see introduction). Furthermore, should future mergers between banks be driven more by an intention to increase the pricing power of the banks involved, this could also have an effect on the intensity of competition. The intensity of this effect may also be non-linear and only take effect once concentration exceeds a certain threshold. It is also conceivable that greater competition from non-bank financial intermediaries () could mitigate any dampening effect on competition resulting from increased concentration in the banking market.[\[19\]](#_ftn_root_19) The extent to which competition from may affect the interest rate pass-through is expected to depend largely on the types of financial intermediaries that are the primary source of such competition.[\[20\]](#_ftn_root_20) For example, investment funds, money market funds and insurers differ significantly in terms of their business models and refinancing structures.**{#par-u54671}
****It may also be worthwhile examining the role of asymmetries during phases of interest rate increases and decreases for the short-term interest rate pass-through in more detail.** The effect of market concentration on this short-term adjustment may differ in phases of rising and falling interest rates. The theoretical considerations presented above refer to the long-term pass-through of interest rates and are abstracted from a model of the adjustment process. However, it is entirely conceivable that the pass-through will be faster in markets with a high degree of concentration during phases of increasing interest rates, and slower during phases of decreasing interest rates than in markets with a low degree of concentration. Evidence of such an asymmetry can be found in the euro area in the interest rate pass-through for deposits.[\[21\]](#_ftn_root_21) Where the interest rate pass-through for deposits also impacts the interest rate pass-through for loans, concentration in the deposit market could also have an indirect effect on the interest rate pass-through for loans.**{#par-aa5e16}
****Furthermore, the effect of concentration on the intensity of competition may differ between countries and loan categories.** Evidence for the United States suggests that the structure-conduct-performance paradigm is more relevant in the housing loan market than in lending to small businesses.[\[22\]](#_ftn_root_22) Therefore, the effect of concentration on the interest rate pass-through may be clearer in the euro area for other loan categories than for loans to , which are the focus of this article.**{#par-o7au53}
**List of references** {#tar-12}
--------------------------------
**Altavilla, C., L. Brugnolini, R. S. Gürkaynak, R. Motto and G. Ragusa (2019), [Measuring euro area monetary policy](https://doi.org/10.1016/j.jmoneco.2019.08.016), Journal of Monetary Economics, Vol. 108, pp. 162‑179.**{#par-o8ouu9}
**Bain, J. S. (1951), [Relation of Profit Rate to Industry Concentration: American Manufacturing, 1936‑1940](https://doi.org/10.2307/1882217), The Quarterly Journal of Economics, Vol. 65(3), pp. 293‑32.**{#par-uaui1u}
**Baumol, W. J., J. C. Panzar and R. D. Willig (1982), Contestable Markets and the Theory of Industry Structure, New York: Harcourt Brace Jovanovich, Inc.**{#par-ai31a6}
**Beccalli, E. and P. Frantz (2013), [The determinants of mergers and acquisitions in banking](https://doi.org/10.1007/s10693-012-0138-y), Journal of Financial Services Research, Vol. 43(3), pp. 265‑291.**{#par-u95iuu}
**Beck, T., R. Levine and A. Levkov (2010), [Big bad banks? The winners and losers from bank deregulation in the United States](https://doi.org/10.1111/j.1540-6261.2010.01589.x), The Journal of Finance, Vol. 65(5), pp. 1637‑1667.**{#par-o5813e}
**Berger, A. N. and T. H. Hannan (1989), [The Price-Concentration Relationship in Banking](https://doi.org/10.2307/1926975), The Review of Economics and Statistics, Vol. 71(2), pp. 291‑299.**{#par-ao162a}
**Bikker, J. A. and K. Haaf (2002), [Competition, concentration and their relationship: An empirical analysis of the banking industry](https://doi.org/10.1016/S0378-4266(02)00205-4), Journal of Banking \& Finance, Vol. 26, pp. 2191‑2214.**{#par-ea4ue4}
**Bikker, J. A., S. Shaffer and L. Spierdijk (2012), [Assessing competition with the Panzar-Rosse model: the role of scale, costs and equilibrium](https://www.jstor.org/stable/23355338), The Review of Economics and Statistics, Vol. 94(4), pp. 1025‑1044.**{#par-e241u5}
**Boone, J. (2008), [A new way to measure competition](https://doi.org/10.1111/j.1468-0297.2008.02168.x), Economic Journal, Vol. 118(531), pp. 1245‑1261.**{#par-o489u2}
**Bredl, S. (2025), [Regional loan market structure, bank lending rates and monetary transmission](https://www.bundesbank.de/content/968132), Deutsche Bundesbank Discussion Paper No 30/2025.**{#par-ea45i8}
**Claessens, S. and L. Laeven (2004), [What Drives Bank Competition? Some International Evidence](https://www.jstor.org/stable/3838954), Journal of Money, Credit and Banking 36(3,2) pp. 563‑583.**{#par-e76139}
**Corvoisier, S. and R. Gropp (2002), [Bank concentration and retail interest rates](https://doi.org/10.1016/S0378-4266(02)00204-2), Journal of Banking \& Finance, Vol. 26, pp. 2155‑2189.**{#par-i8eo13}
**Demsetz, H. (1973), [Industry Structure, Market Rivalry, and Public Policy](https://www.jstor.org/stable/724822), The Journal of Law \& Economics, Vol. 16(1), pp. 1‑9.**{#par-u3634i}
**Deutsche Bundesbank (2025), [Financial Stability Review 2025](https://publikationen.bundesbank.de/content/969016).**{#par-a23e4i}
**Deutsche Bundesbank (2024), [Financing costs for banks in Germany in the monetary policy interest rate cycle](https://publikationen.bundesbank.de/content/947286), Monthly Report, December 2024.**{#par-a7a7a4}
**Deutsche Bundesbank (2023), [Developments in bank interest rates in Germany during the period of monetary policy tightening](https://www.bundesbank.de/content/912874), Monthly Report, June 2023, pp. 39‑62.**{#par-e6a4i6}
**Deutsche Bundesbank (2018), [Developments in corporate financing in the euro area since the financial and economiccrisis](https://www.bundesbank.de/content/707690), Monthly Report, January 2018, pp. 53‑72.**{#par-u89i29}
**Deutsche Bundesbank (2011), [The performance of German credit institutions in 2010](https://www.bundesbank.de/content/622282), Monthly Report, September 2011, pp. 15‑57.**{#par-uua7e5}
**Deutsche Bundesbank (2001), [Bank balance sheets, bank competition and monetary policy transemission](https://www.bundesbank.de/content/706102), Monthly Report, September 2001, pp. 51‑70.**{#par-e3o7a2}
**Deutsche Bundesbank and Federal Financial Supervisory Authority (2017), [Results of the 2017 low-interest-rate survey](https://www.bundesbank.de/content/667444).**{#par-u8a7o6}
**Dick, A. A. (2006), [Nationwide Branching and Its Impact on Market Structure, Quality, and Bank Performance](https://doi.org/10.1086/499131), The Journal of Business, Vol. 79(2), pp. 567‑592.**{#par-ooie73}
**Drechsler, I., A. Savov and P. Schnabl (2017), [The deposits channel of monetary policy](https://doi.org/10.1093/qje/qjx019), Quarterly Journal of Economics, Vol. 132(4), pp. 1819‑1876.**{#par-e4a6o4}
**European Central Bank (2020), Financial Integration and Structure in the Euro Area.**{#par-iiu77i}
**European Central Bank (2019), AnaCredit Reporting Manual, [Part I -- General Methodology](https://www.ecb.europa.eu/pub/pdf/other/AnaCredit_Manual_Part_I_General_Methodology_201905~e4b471a87e.en.pdf).**{#par-oi8o51}
**European Central Bank (2017), Financial Integration in Europe.**{#par-ieoou4}
**European Central Bank (2009), [Number of Monetary Financial Institutions in the Euro area and the European Union -- 2009](https://www.ecb.europa.eu/press/pr/date/2009/html/pr090113.ro.html).**{#par-a53ao7}
**Gerali, A., S. Neri, L. Sessa, and F. M. Signoretti (2010), [Credit and Banking in a Model of the Euro Area](https://doi.org/10.1111/j.1538-4616.2010.00331.x), Journal of Money, Credit and Banking, Vol. 42, pp. 107‑141.**{#par-ae1o25}
**Gödl-Hanisch, I. (2022), [Bank concentration and monetary policy pass-through](https://dx.doi.org/10.2139/ssrn.4149637), Center for Financial Research Paper No 2022‑06.**{#par-e69554}
**Goetz, M. R. (2018), [Competition and bank stability](https://doi.org/10.1016/j.jfi.2017.06.001), Journal of Financial Intermediation, Vol. 35, pp. 57‑69.**{#par-e1264a}
**Goetz, M. R. and J. C. Gozzi, (2022), [Financial integration and the co-movement of economic activity: Evidence from states](https://doi.org/10.1016/j.jinteco.2021.103561), Journal of International Economics, Vol. 135, 103561.**{#par-a74548}
**Goetz, M. R., L. Laeven and R. Levine (2016), [Does the geographic expansion of banks reduce risk?](https://doi.org/10.1016/j.jfineco.2016.01.020), Journal of Financial Economics, Vol. 120(2), pp. 346‑362.**{#par-ei6u1e}
**Heckmann-Draisbach, L. and J. Hardt (2024), [Hampered Monetary Policy Transmission -- A Supply Side Story?](https://doi.org/10.1111/jmcb.13216), Journal of Money, Credit and Banking, forthcoming.**{#par-o56ii6}
**Hempell, H. (2002), [Testing for Competition Among German Banks](https://www.bundesbank.de/content/618130), Deutsche Bundesbank Discussion Paper No 04/2002.**{#par-o5553a}
**Jayaratne, J. and P. E. Strahan (1998), [Entry Restrictions, Industry Evolution, and Dynamic Efficiency: Evidence From Commercial Banking](https://doi.org/10.1086/467390), The Journal of Law \& Economics, Vol. 41(1), pp. 239‑274.**{#par-ee1974}
**Jayaratne, J. and P. E. Strahan (1996), [The finance-growth nexus: Evidence from bank branch deregulation](https://doi.org/10.2307/2946668), The Quarterly Journal of Economics, Vol. 111(3), pp. 639‑670.**{#par-i91867}
**Kho, S. (2025), [Deposit market concentration and monetary transmission: Evidence from the euro area](https://doi.org/10.1016/j.euroecorev.2024.104933), European Economic Review, Vol. 173, 104933.**{#par-o7e63i}
**Kok Sørensen, C. and T. Werner (2006), [Bank interest rate pass-through in the euro area: a cross country comparison](https://www.ecb.europa.eu/pub/pdf/scpwps/ecbwp580.pdf), Working Paper Series, No 580.**{#par-e72o99}
**Leroy, A. and Y. Lucotte (2015), [Heterogeneous monetary transmission process in the eurozone: Does banking competition matter?](https://doi.org/10.1016/j.inteco.2015.01.006), International Economics, Vol. 141, pp. 115‑134.**{#par-o95296}
**Liebersohn, J. (2024), [How does competition affect retail banking? Quasi-experimental evidence from bank mergers](https://doi.org/10.1016/j.jfineco.2024.103797), Journal of Financial Economics, Vol. 154, 103797.**{#par-i74616}
**Morandi, G. and P. Bojaruniec (2016), [Setting-up the transmission of individual statistics on balance sheet items and interest rates across the Eurosystem](https://www.bis.org/ifc/publ/ifcb41i.pdf), Bulletins chapters, in: Bank for International Settlements (ed.), Combining micro and macro data for financial stability analysis, No 41, Bank for International Settlements.**{#par-e67a95}
**Panzar, J. C. and J. N. Rosse (1987), [Testing For "Monopoly" Equilibrium](https://doi.org/10.2307/2098582), The Journal of Industrial Economics, Vol. 35(4), pp. 443‑456.**{#par-uaaaio}
**Sander, H. and S. Kleimeier (2004), [Convergence in euro-zone retail banking?What interest rate pass-through tells us about monetary policy transmission, competition and integration](https://doi.org/10.1016/j.jimonfin.2004.02.001), Journal of International Money and Finance, Vol. 23(23), pp. 461‑492.**{#par-e38u25}
**Stiroh, K. J. and P. E. Strahan (2003), [Competitive Dynamics of Deregulation: Evidence from U.S. Banking](https://www.jstor.org/stable/3649829), Journal of Money, Credit and Banking, Vol. 35(5), pp. 801‑828.**{#par-aae137}
**Tiza Mimun, A., G. Fukker and M. Sydow (2025), [The effects of monetary policy on banks and non-banks in times of stress](https://www.ecb.europa.eu/pub/pdf/scpwps/ecb.wp3114~53f9ad5281.en.pdf), Working Paper Series, No 3114.**{#par-o174e2}
**Van Leuvensteijn, M., C. Kok Sørensen, J. A. Bikker and A. A. R. J. M. van Rixtel (2013), [Impact of bank competition on the interest rate pass-through in the euro area](https://doi.org/10.1080/00036846.2011.617697), Applied Economics, Vol. 45, pp. 1359‑1380.**{#par-o6uo91}
**Wang, Y., T. M. Whited, Y. Wu and K Xiao. (2022), [Bank Market Power and Monetary Policy Transmission: Evidence from a Structural Estimation](https://doi.org/10.1111/jofi.13159), The Journal of Finance, Vol. 77(4), pp. 2093‑2141.**{#par-ai3185}
1. **{#_ftn_root_1} The number of banks jumped at the end of 2008 due to a reclassification of certain financial institutions as banks, see European Central Bank (2009).**
{#par-e4u7uo}
2. **{#_ftn_root_2} See European Central Bank (2017, 2020).**
{#par-i19o23}
3. **{#_ftn_root_3} See Beccalli and Frantz (2013).**
{#par-o27675}
4. **{#_ftn_root_4} See Deutsche Bundesbank (2024).**
{#par-aa83i3}
5. **{#_ftn_root_5} See Deutsche Bundesbank (2023).**
{#par-e3833o}
6. **{#_ftn_root_6} Interest rate pass-through also encompasses the transmission of monetary policy adjustments to deposit interest rates. However, this article does not discuss the pass-through of interest rates to deposits.**
{#par-u99381}
7. **{#_ftn_root_7} See Deutsche Bundesbank (2018).**
{#par-e436i2}
8. **{#_ftn_root_8} See Bain (1951) and Deutsche Bundesbank (2001).**
{#par-a35472}
9. **{#_ftn_root_9} See Demsetz (1973) and Deutsche Bundesbank (2001).**
{#par-ue7ae3}
10. **{#_ftn_root_10} See Bredl (2025).**
{#par-u39247}
11. **{#_ftn_root_11} The individual market shares are squared before being added together because the sum of the market shares across all banks always equals one (or 100 %), whereas the sum of the squared values only equals one in a highly concentrated market, i.e. where one bank has a market share of 100 %.**
{#par-u96516}
12. **{#_ftn_root_12} See Deutsche Bundesbank (2001).**
{#par-aoa98u}
13. **{#_ftn_root_13} Owing to the data available, the for loans to cannot be calculated for the euro area over a longer period. Therefore, the for loans to is not taken into account for the euro area.**
{#par-a689u3}
14. **{#_ftn_root_14} See Boone (2008).**
{#par-u53iiu}
15. **{#_ftn_root_15} The H statistic measures how a bank's revenues respond to changes in factor prices, such as wages. As can be demonstrated, under certain assumptions, the intensity and direction of this response can be an indicator of the intensity of competition. The Lerner Index measures the percentage mark-up that banks can apply to the prices of their products in relation to their marginal costs. A lower mark-up is an indicator of strong competition. The Boone indicator is a measure of how much a bank's market share or profit is dependent on its efficiency.**
{#par-a9u1o5}
16. **{#_ftn_root_16} See Bikker et al. (2012).**
{#par-a4oe8i}
17. **{#_ftn_root_17} See Berger and Hannan (1989) for corresponding considerations in respect of the deposit market.**
{#par-o289u8}
18. **{#_ftn_root_18} At this juncture, it is important to differentiate between the level of lending rates and the interest rate pass-through -- in other words, the way lending rates respond to changes in market interest rates. As explained in this paragraph, an empirical study of how concentration affects the level of lending rates provides evidence with regard to the first stage of the chain of effects. This should not be mistaken for the empirical analysis of how concentration affects the interest rate pass-through, which is discussed in the first part of this chapter.**
{#par-oi3a5o}
19. **{#_ftn_root_19} On the growing importance of see Deutsche Bundesbank (2025).**
{#par-ie2o68}
20. **{#_ftn_root_20} For example, Tiza Mimun et al. (2025) find that in the euro area, the response of to a monetary policy measure varies greatly across various types of these intermediaries.**
{#par-o5ao43}
21. **{#_ftn_root_21} See Kho (2025).**
{#par-oo3a3o}
22. **{#_ftn_root_22} See Liebersohn (2024).**
{#par-uoe246}
*[**HHI**]: Herfindahl-Hirschman Index
*[EURIBOR]: euro interbank offered rate
*[**EURIBOR**]: euro interbank offered rate
*[NUTS]: Nomenclature des Unités territoriales statistiques
*[**LI**]: Lerner Index
*[**NFCs**]: non-financial corporations
*[CR3]: concentration ratio 3
*[ECB]: European Central Bank
*[CR5]: concentration ratio 5
*[**HHIs**]: Herfindahl-Hirschman-Index
*[IFC]: Irving Fisher Committee on Central Bank Statistics
*[HHI]: Herfindahl-Hirschman Index
*[HHIs]: Herfindahl-Hirschman-Index
*[NFCs]: non-financial corporations
*[DSGE]: dynamic stochastic general equilibrium
*[CR10]: concentration ratio 10
*[MFI]: monetary financial institution
*[NBFIs]: non-bank financial intermediaries
*[FDIC]: Federal Deposit Insurance Corporation
*[LI]: Lerner Index
*[US]: United States