# Forecast for Germany: Economy gradually returns to recovery path
* [*1 Key aspects of the macroeconomic outlook*](#tar-1 "1 Key aspects of the macroeconomic outlook")
* *[*Impact of additional government infrastructure spending on German potential output*](#tar-2 "Impact of additional government infrastructure spending on German potential output")*
* **[*2 Risk assessment*](#tar-3 "2 Risk assessment")**
* ***[*Emissions Trading System 2 on consumer prices*](#tar-4 "Emissions Trading System 2 on consumer prices")***
* ***[*3 More detailed information on the Forecast for Germany*](#tar-5 "3 More detailed information on the Forecast for Germany")
* *[*3.1 Assumptions regarding the international environment, exchange rates, commodity prices and interest rates*](#tar-6 "3.1 Assumptions regarding the international environment, exchange rates, commodity prices and interest rates")*
* **[*3.2 Fiscal assumptions*](#tar-7 "3.2 Fiscal assumptions")**
* ***[*3.3 Outlook for public finances*](#tar-8 "3.3 Outlook for public finances")***
* ***[*3.4 Details of the short-term GDP forecast*](#tar-9 "3.4 Details of the short-term GDP forecast")***
* ***[*3.5 Forecasts of expenditure components of GDP*](#tar-10 "3.5 Forecasts of expenditure components of GDP")***
* ***[*3.6 The short-term forecast for the labour market*](#tar-11 "3.6 The short-term forecast for the labour market")***
* ***[*3.7 The forecast for negotiated wages in this year and the next*](#tar-12 "3.7 The forecast for negotiated wages in this year and the next")***
* ***[*3.8 Inflation forecast up to 2026*](#tar-13 "3.8 Inflation forecast up to 2026")******
* ***[*Key figures of the macroeconomic forecast*](#tar-14 "Key figures of the macroeconomic forecast")***
* ***[*List of references*](#tar-15 "List of references")***
****The Bundesbank's new Forecast for Germany still expects the German economy to pick up over the course of next year.****{#par-oau33e}
****The expansionary fiscal stance will then begin to clearly support growth and private demand will also slowly regain momentum.****{#par-iu3351}
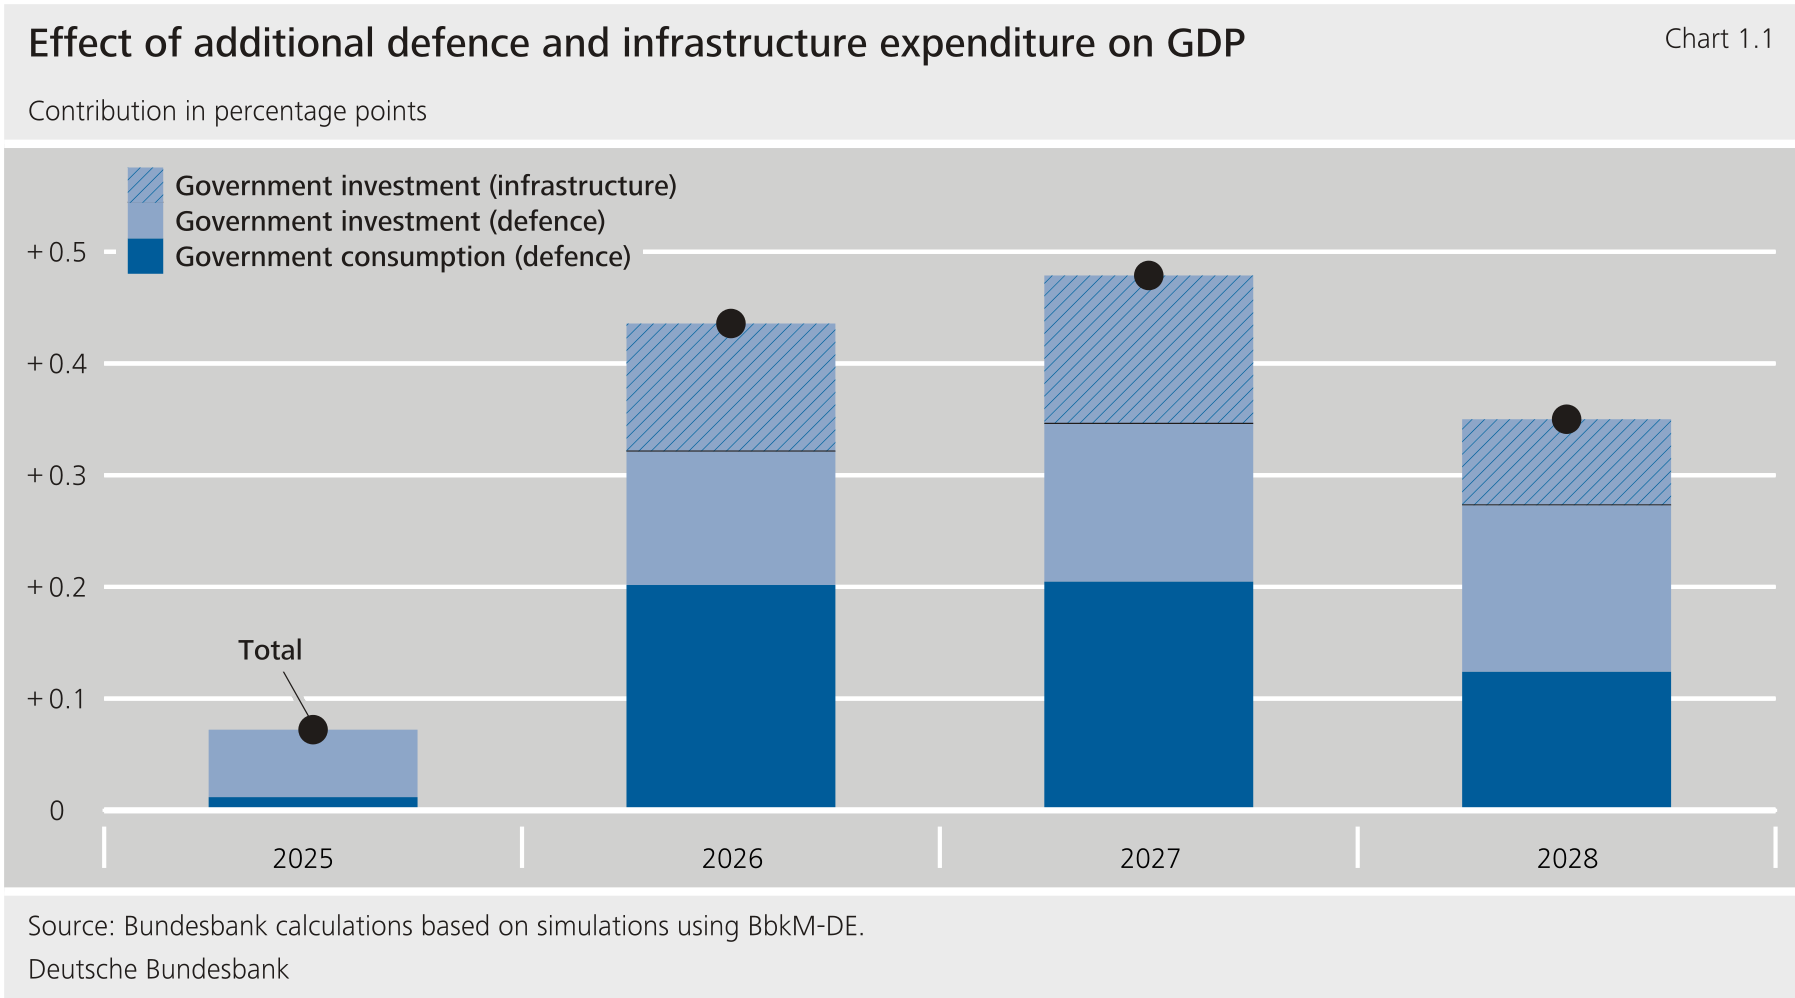
****It is estimated that additional government spending on defence and infrastructure will contribute 1.3 percentage points to growth by 2028. Furthermore, transfers and tax cuts will boost the incomes of households and firms.****{#par-o6iei9}
****Social security funds will see a sharp rise in expenditure alongside substantially higher contribution rates.****{#par-i78482}
****Exports will gradually embark on a recovery path next year but owing to reduced competitiveness will reap only limited benefits from a return to a more vibrant global economy. Businesses will also increase their investment again somewhat later.****{#par-a5e7o3}
****Overall, the German economy will grow slightly this year by 0.2 % (calendar-adjusted), somewhat more strongly by 0.6 % next year and by a substantial 1.3 % in 2027. As the number of working days will increase over the next two years, unadjusted rates will then be somewhat higher at 0.9 % and 1.4 %.****{#par-a8o493}
****It will continue to grow in 2028, but will lose some momentum, with growing at a rate of 1.1 % in calendar-adjusted terms. Capacity utilisation in the German economy will then be high again and the labour market will become tighter.****{#par-oue8a2}
****Expansionary fiscal policy will have hardly any impact on potential output over the forecast horizon. Given the persistence of structural barriers to growth, its growth rate is estimated to be only 0.4 % per year over the forecast horizon.****{#par-ou8ue1}
****The inflation rate will continue to decline over the forecast horizon, but at a slower pace than previously expected. One factor here is that strong wage growth will ease only slowly.****{#par-u15515}
****The rate is expected to decrease from 2.3 % this year to 2.2 % next year, reaching around 2 % in 2027 and 2028.****{#par-a4537u}
****Given the expected macroeconomic environment, inflation would be expected to rise somewhat in 2028. However, this will be dampened by the switch from national CO₂ emissions trading to the system, as a lower carbon price is assumed here for a time.****{#par-u87678}
****The general government deficit ratio will rise sharply overall, from 2.5 % in 2025 to 4.8 % in 2028. The debt ratio will increase to 68 %.****{#par-a9i69a}
****The risks to the forecast tend to be tilted to the downside for and to the upside for inflation.****{#par-ouo764}
{#par-eu7e89}{#par-o5i295}{#par-i1e23i}{#par-o7eua2}
| **Table 1.1: December 2025 forecast** Year-on-year percentage change |||||
| Item | **2025** | **2026** | **2027** | **2028** |
| Real , calendar adjusted | 0.2 | 0.6 | 1.3 | 1.1 |
| Real , unadjusted | 0.1 | 0.9 | 1.4 | 0.9 |
| Harmonised Index of Consumer Prices | 2.3 | 2.2 | 2.1 | 1.9 |
| Excluding energy and food | 2.8 | 2.4 | 2.1 | 2.2 |
|-------------------------------------|---------:|---------:|---------:|---------:|
{#par-ou9u8a}
***1 Key aspects of the macroeconomic outlook*** {#tar-1}
---------------------------------------------------------
*****Economic output in Germany declined somewhat in the preceding summer half-year.** In seasonally adjusted terms, real fell by a cumulative 0.2 % in the second and third quarters, slightly more strongly than expected in the Bundesbank's June 2025 Forecast for Germany.[\[1\]](#_ftn_root_1) The German economy thus suffered a further setback. According to national accounts data, which were revised in the third quarter, it has clearly been in a recession since the end of 2022 but has recovered somewhat since mid-2024, however.[\[2\]](#_ftn_root_2) As a result of trade policy and the introduction of far-reaching tariffs, exports to the United States dropped sharply in the third half of the year, but the overall decline in exports was significantly less than expected. Business investment was also somewhat more robust. Uncertainty stemming from trade policy is likely to have had less of a dampening effect than feared.[\[3\]](#_ftn_root_3) Nevertheless, industrial output fell markedly. Construction, in particular, was weaker than expected in the June forecast, as housing investment suffered a further sharp decline. Private consumption also fell short of the forecast, even though the labour market proved somewhat more stable. Gains among service providers almost offset a further reduction in jobs in the manufacturing industry. At the same time, there was a surprisingly sharp rise in actual wages. This is particularly true of some services sectors with comparatively robust economic and labour market conditions. This is likely to have contributed to the fact that inflation rates were also well above the June forecast recently. Core inflation (excluding energy and food), in particular, surprised to the upside.***{#par-a523o9}
****The German economy is gradually returning to a recovery path.** [\[4\]](#_ftn_root_4) GDP is initially expected to rise only slightly in the 2025/26 winter half-year. Exports are therefore likely to pick up somewhat after the tariff-related burdens and industry is likely to stabilise. Some service providers will probably see further growth, too. There are also some initial signs of an increase in government orders. However, according to the available leading indicators, the expected fiscal easing is not set to already provide any significant boost to the economy as a whole in the short term (see the section "[Details of the short-term forecast](#3.4-Details-of-the-short-term-GDP-forecast)"). The expansionary fiscal policy will only play a significant role later in the forecast horizon. Additional defence and infrastructure spending will strongly drive up government investment and additional defence spending will also be reflected in higher government consumption.[\[5\]](#_ftn_root_5) The cumulative overall effect of this spending on annual growth is estimated to be + 1.3 percentage points between 2025 and 2028.[\[6\]](#_ftn_root_6) Fiscal policy will also support economic activity through further measures (see the section "[Fiscal assumptions](#3.2-Fiscal-assumptions)"). From the second quarter of 2026, growth will accelerate markedly. Fiscal stimulus is a key prerequisite here but a revival in household demand is important, too. Exports will slowly return to an expansion path over the course of next year. Global trade and foreign demand will then see significant growth again (see the section "[Assumptions regarding the international environment, exchange rates, commodity prices and interest rates](#3.1-Assumptions-regarding-the-international-environment-exchange-rates-commodity-prices-and-interest-rates)"). Given the deterioration in its competitiveness, the German export industry will see only limited benefits from this. Private residential investment will also start to recover in 2026. Strongly rising wages and a gradual improvement in the labour market will underpin households' real disposable income and thus moderate growth in their consumption. With increased capacity utilisation, businesses will also invest more again. However, this will not be noticeable until 2027. The pace of the annual average expansion will then accelerate significantly. Momentum will decline towards the end of the forecast horizon, however, mainly as domestic household demand loses impetus. Higher interest rates will then curb investment and a sharp rise in social contribution rates will dampen disposable income and private consumption (see the section "[Forecasts of expenditure components of](#3.5-Forecasts-of-expenditure-components-of-GDP)").**{#par-oe34ii}
{#par-a64146}
****
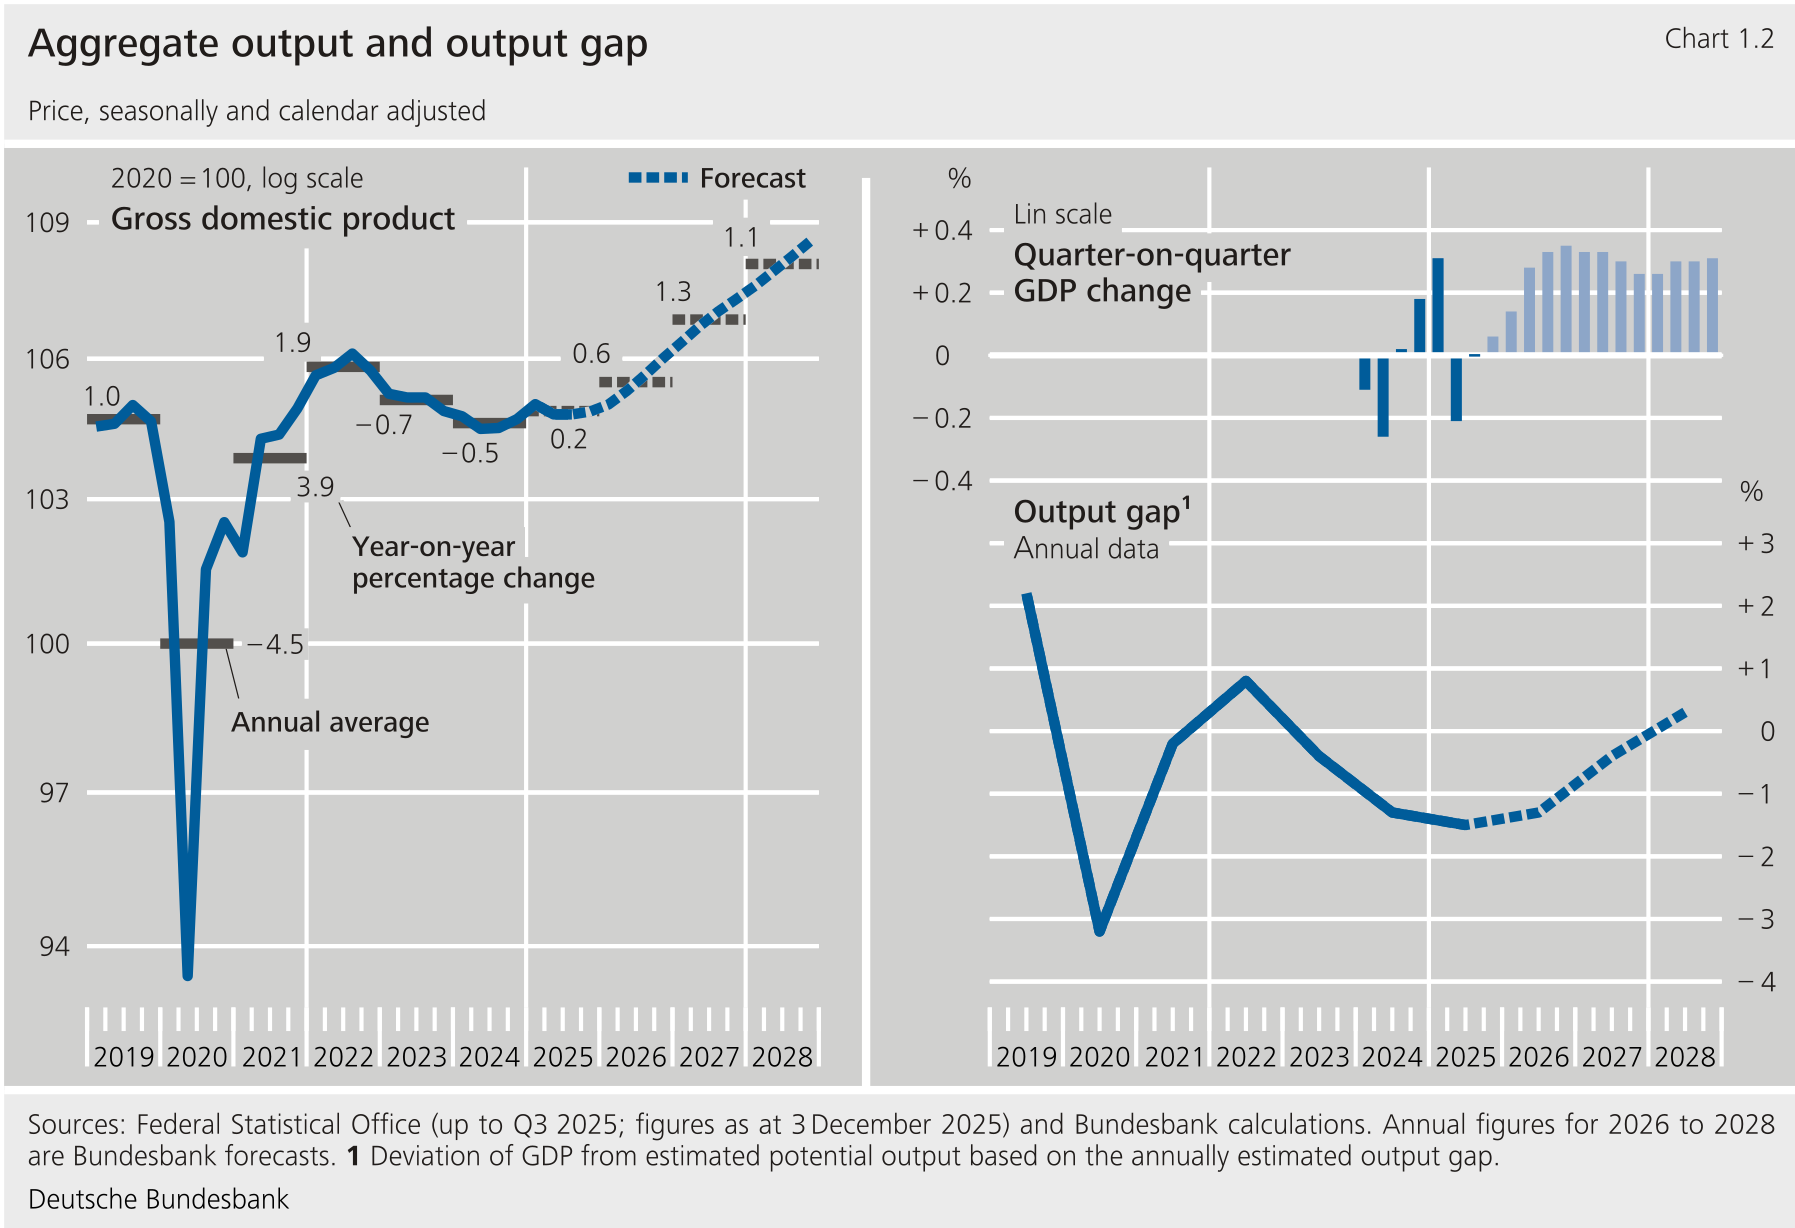
****The German economy will therefore see increasingly stronger growth by 2027 before losing momentum slightly in 2028.** Calendar-adjusted real will rise by 0.2 % this year, by 0.6 % in 2026, by 1.3 % in 2027 and by 1.1 % in 2028. With regard to quarterly growth rates, note that these are fairly steady over the forecast horizon. However, as expected investment in defence will play an important role in growth, actual growth may be significantly more volatile. This is because investment in defence is recorded in the national accounts at the time of delivery. It is difficult to make a precise on-the-quarter forecast here, especially in the case of armaments, and significant fluctuations across quarters are possible if deliveries are not evenly distributed over time.**{#par-oi82a1}
****Compared with the June Forecast for Germany,** **growth has been revised slightly upwards for 2025 and 2027 and slightly downwards for 2026.** This year, this is due to the more favourable start to the year as a result of the upward revision of data at the end of 2024 and the beginning of 2025. For one thing, the export forecast has been revised somewhat downwards for 2026. This reflects the stronger euro and slightly weaker expansion in foreign demand. For another, private housing construction will see somewhat less growth. By contrast, real government demand will grow somewhat more strongly in 2026 and 2027 than expected in June.**{#par-i31u64}
{#par-e4ie89}{#par-u8898e}{#par-u38113}{#par-o715e6}{#par-u377io}
| **Table 1.2: Technical components of the** **growth forecast** % or percentage points |||||
| Item | **2025** | **2026** | **2027** | **2028** |
| Statistical carry-over at the end of the previous year^1^ | 0.1 | 0.0 | 0.5 | 0.4 |
| Fourth-quarter rate^2^ | 0.2 | 1.1 | 1.2 | 1.2 |
| Average annual growth rate, calendar adjusted | 0.2 | 0.6 | 1.3 | 1.1 |
| Calendar effect^3^ | -- 0.1 | 0.3 | 0.1 | -- 0.2 |
| Annual average growth rate^4^ | 0.1 | 0.9 | 1.4 | 0.9 |
|-----------------------------------------------------------|---------:|---------:|---------:|---------:|
{#par-o9i446}{#par-ie98ea}{#par-a9uiie}{#par-a556o5}
| **Table 1.3a: Revisions since the June 2025 forecast** Year-on-year percentage change ||||
| Item | **2025** | **2026** | **2027** |
| (real, calendar adjusted) | |||
| December 2025 forecast | 0.2 | 0.6 | 1.3 |
| June 2025 forecast | 0.0 | 0.7 | 1.2 |
| Difference (in percentage points) | 0.2 | -- 0.1 | 0.1 |
|-----------------------------------|---------:|---------:|---------:|
{#par-u1413a}
****Aggregate production capacity utilisation will improve again.** The German economy will grow significantly more strongly than its potential output, for which, as in June, a growth rate of only 0.4 % per year is estimated over the forecast horizon. The currently still significantly negative aggregate output gap will thus close over the forecast horizon and production capacity utilisation will be at a favourable level again in 2028. Potential growth will remain subdued owing to varied structural barriers to growth at home and abroad. It will be hampered, amongst other things, by the shortage of skilled workers and rising unit labour costs in the context of demographic change, higher bureaucratic burdens or increased international competition faced by the German export industry, especially from China, as well as the growing fragmentation of the international environment. Many of these factors are also expected to weigh on potential output growth beyond the forecast horizon. The additional government investment in infrastructure will probably continue to have an impact on the economy as a whole across the forecast horizon. This is because it will be financed from the new Infrastructure and Climate Neutrality Fund, which will provide a total of €500 billion over a period of 12 years. However, only around half of this is likely to be used for additional infrastructure investment. The long-term growth effects, i.e. the impact on the potential output of the German economy, are therefore very limited up to 2028 and modest beyond the forecast horizon as well (see the supplementary information "[Impact of additional government infrastructure spending on German potential output](#Impact-of-additional-government-infrastructure-spending-on-German-potential-output)").[\[7\]](#_ftn_root_7) The Bundesbank's estimates assume that the level of potential output in 2035 will be 0.35 % to 0.5 % higher owing to additional infrastructure investment. Additional defence spending is likewise not yet expected to increase potential output growth over the forecast horizon.[\[8\]](#_ftn_root_8)**{#par-u9212a}
{#par-o33o2a}
****
****The government deficit and debt ratios will rise significantly as a result of additional defence spending and non-military investment as well as other fiscal measures.** The deficit ratio will still fall slightly this year, however. The steep rise in social contribution rates and perceptible growth in tax revenue will more than offset expenditure growth. From 2026 onwards, the more accommodative fiscal stance will then lead to a significant increase in the deficit ratio. This is not only due to additional spending on defence and non-military investment, especially in infrastructure, including digitalisation. In addition, there will be revenue shortfalls due to various tax cuts and additional expenditure as a result of transfers (see the section "[Fiscal assumptions](#3.2-Fiscal-assumptions)"). Social security spending will also go up steeply, but this will be largely offset by additional revenue from a significant rise in contribution rates. Overall, the deficit ratio will increase from 2.5 % this year to 4.8 % in 2028. Particularly in 2028, the borrowing limit under the national debt rule will be significantly exceeded, leaving a need for action. The Maastricht debt ratio will grow from 63 % in 2025 to 68 % in 2028 (see the section "[Outlook for public finances](#3.3-Outlook-for-public-finances)").**{#par-a36i44}
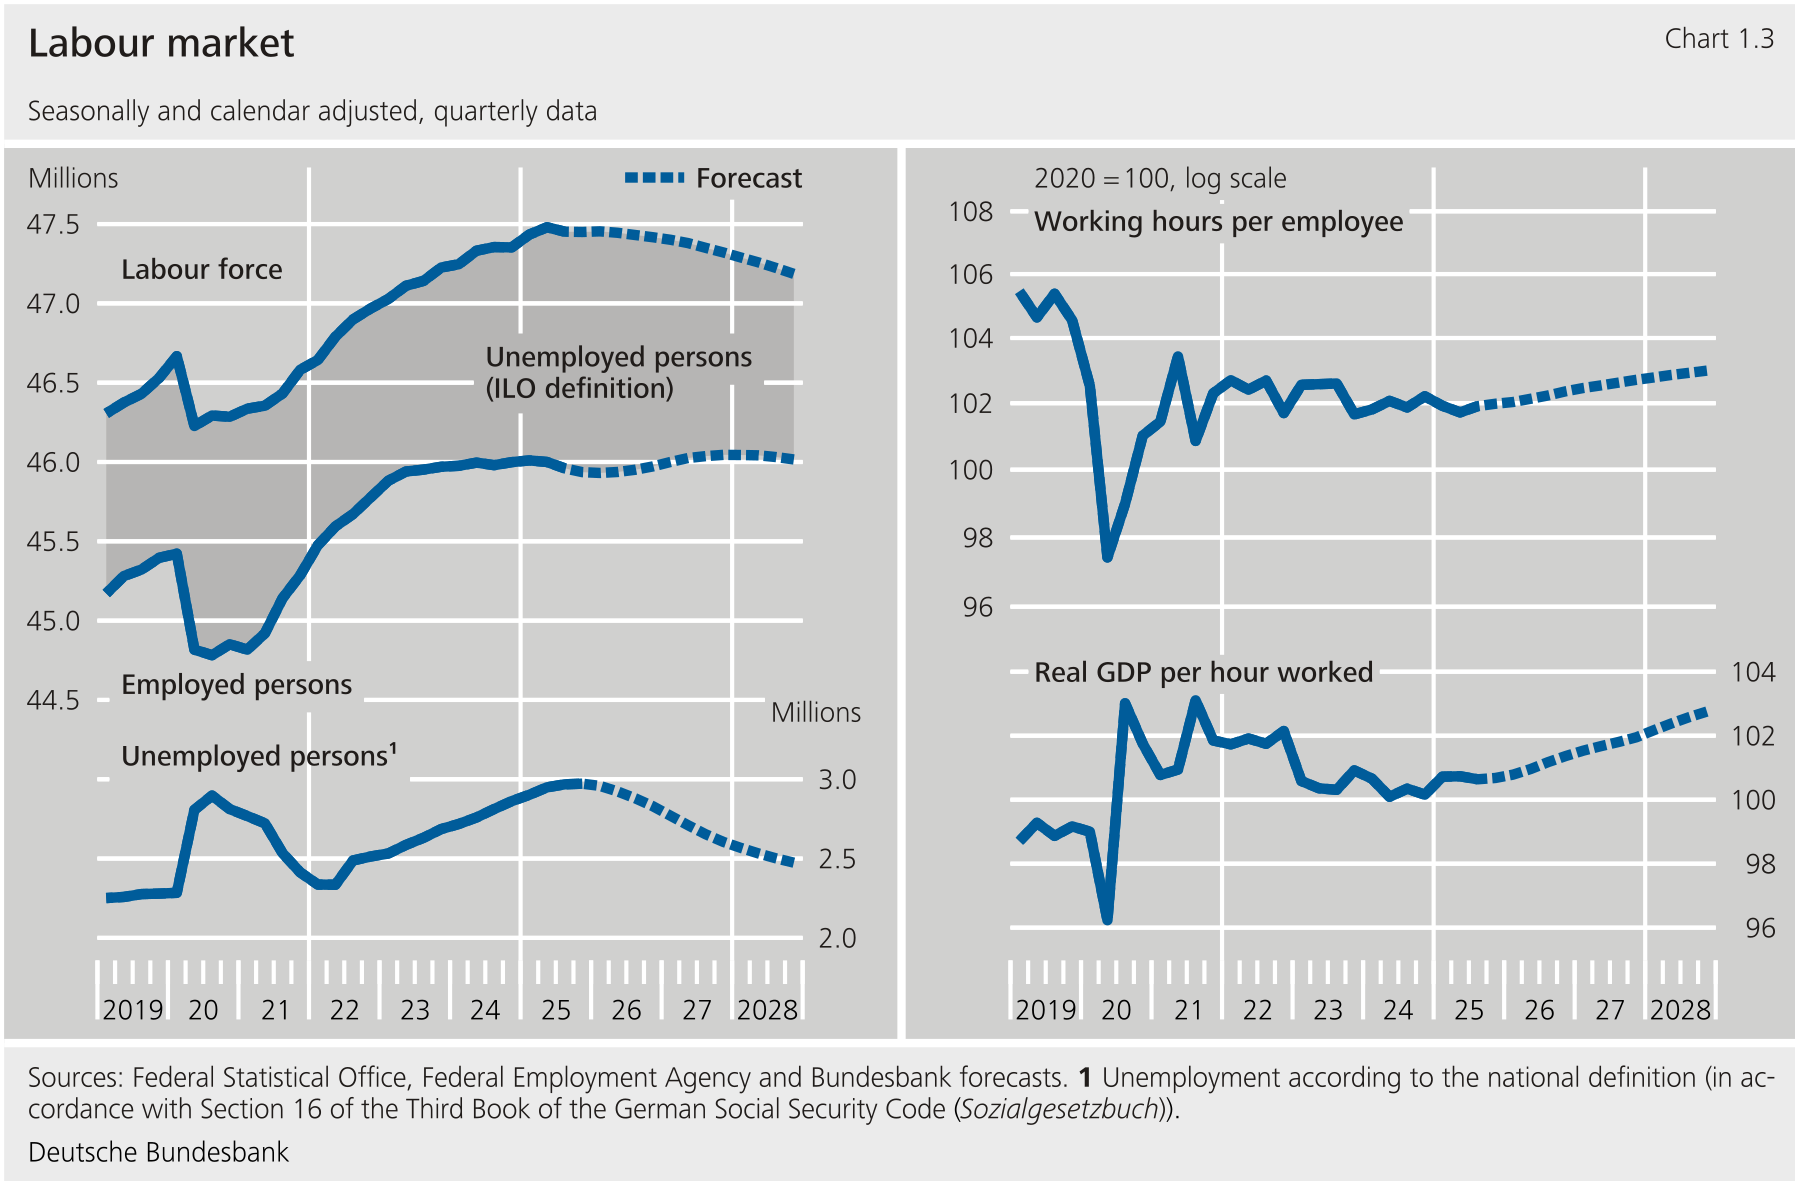
****The labour market will gradually improve over the forecast horizon, with only limited growth in employment but a marked decline in unemployment.** The labour market is not expected to strengthen in the short term. The divergence between the fairly robust services sectors and the manufacturing sector, which is experiencing structural challenges, will initially persist (see the section "[The short-term forecast for the labour market](#3.6-The-short-term-forecast-for-the-labour-market)"). As the economic recovery takes hold, existing staff will initially be put to greater use in 2026. Working hours and labour productivity will rise again. Employment will remain at the same level for the time being. At the same time, unemployment will begin to decline, as the labour supply will then already be receding for demographic reasons. The increasing participation rate and -- now considerably reduced -- immigration will no longer be able to offset the negative demographic impact.[\[9\]](#_ftn_root_9) Only in 2027 will demand for labour be so high that employment grows as well. However, the decline in labour supply will then be so strong that the scope for higher employment remains tightly limited. Unemployment will then fall faster than the labour supply. However, ongoing structural changes will change professional and qualification-related requirements. This will make it more difficult to align the skills supply and demand. Unemployment will therefore fall markedly in 2027 and 2028 but will not yet return to its low pre-pandemic level by the end of the forecast horizon. As a result, the shortage of skilled workers and the labour market tightness will intensify again significantly.**{#par-e253o2}
{#par-o9u8i6}
****
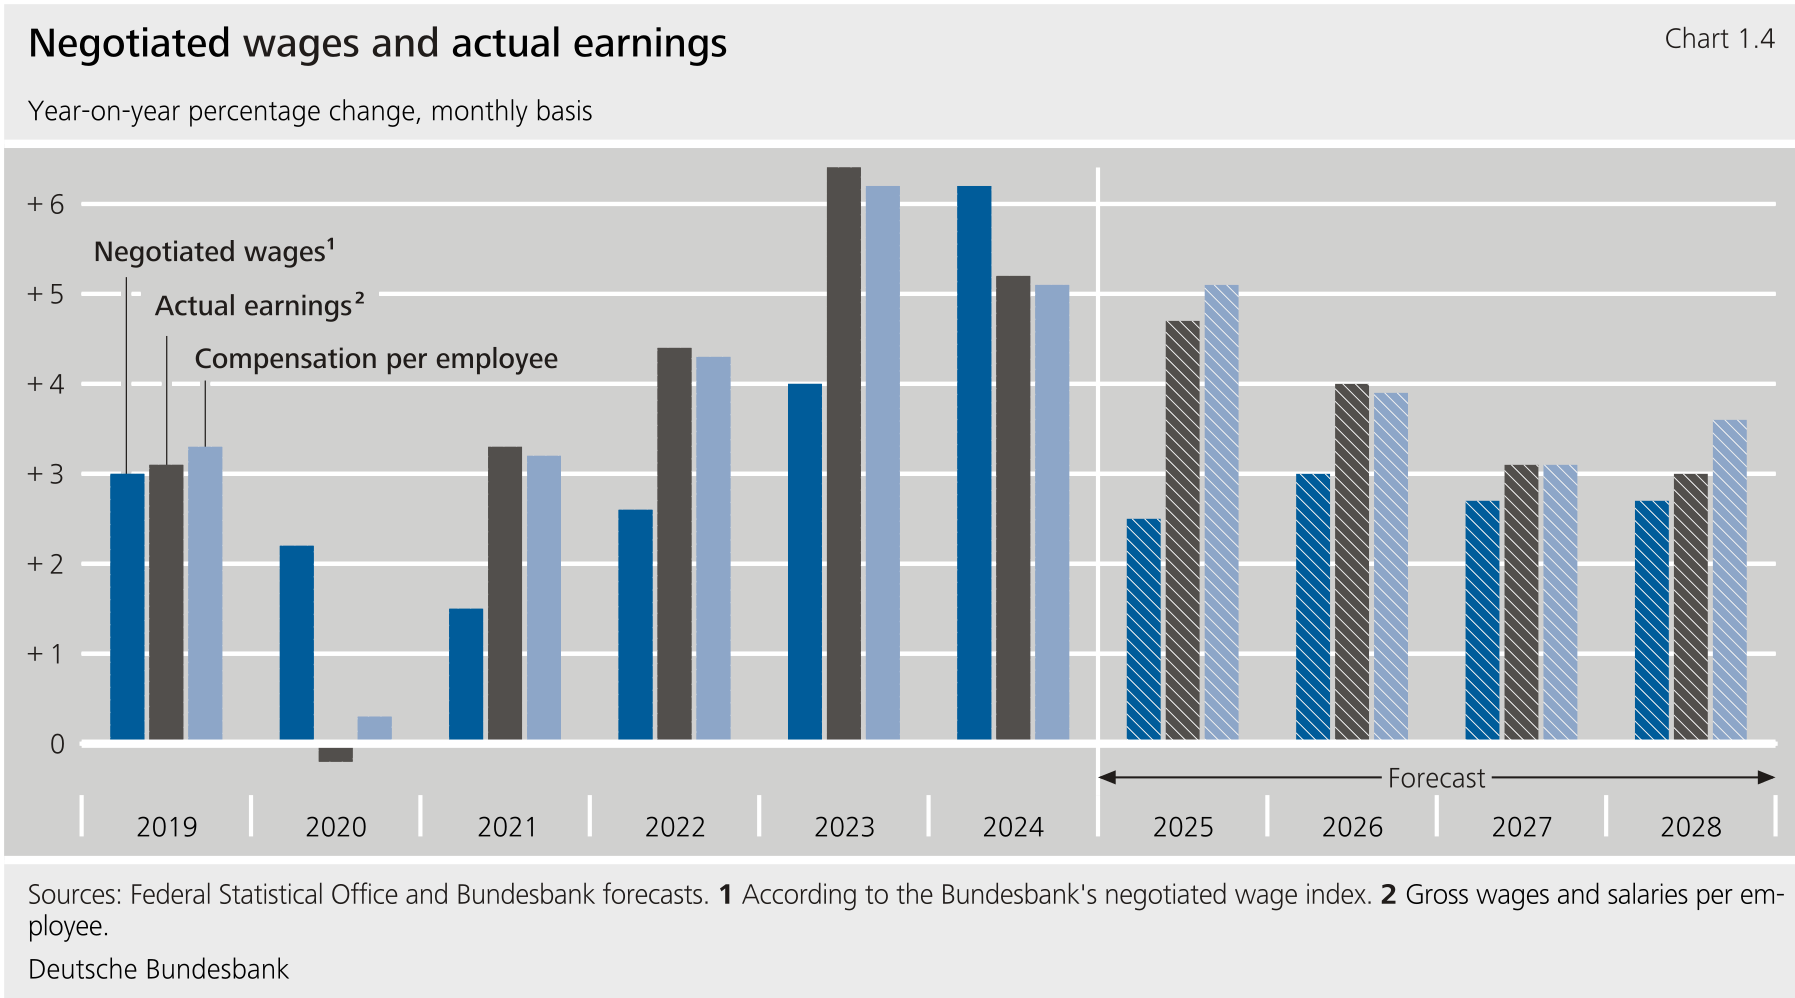
****Actual earnings will initially continue to rise steeply and decelerate much more slowly than previously expected.** The rise in negotiated wages will decline sharply this year at a rate of 2.5 % and increase again somewhat temporarily to 3 % in 2026 (see "[The forecast for negotiated wages in this year and the next](#3.7-The-forecast-for-negotiated-wages-in-this-year-and-the-next)"). In 2025, the weak economic activity and, in some cases, a significant deterioration in the labour market as well as the discontinuation of inflation compensation bonuses are impacting on the economic sectors included here.[\[10\]](#_ftn_root_10) By contrast, the growth rates of actual earnings did not decline in the past summer half-year as had been expected. Wages grew steeply, especially in some of the services sectors with comparatively robust economic activity and persistent shortages of skilled workers. Moreover, these areas are not included in the negotiated wage statistics, or only partially, as fewer workers are covered by collective bargaining.[\[11\]](#_ftn_root_11) In addition, there were other one-off factors.[\[12\]](#_ftn_root_12) Wages in these services sectors are likely to rise much more strongly next year than in sectors bound by collective agreements. The sharp increase in the minimum wage will also contribute to a positive wage drift.[\[13\]](#_ftn_root_13) However, the one-off factors will not continue to the same extent. Actual wages will rise by 4.7 % in 2025 and by 4.0 % in 2026 overall. The forecast has thus been revised upwards unusually sharply since June.[\[14\]](#_ftn_root_14) In 2027 and 2028, negotiated wage growth, at 2.7 %, will likewise be well above the long-term average. With around 3 % per year, the rise in actual wages will be even stronger. This is due to lower unemployment, the increasingly widespread shortage of labour and the associated rise in working hours for employees.[\[15\]](#_ftn_root_15) Compensation per employee will rise significantly more substantially than actual earnings in 2028. This is due to the substantially higher social contribution rates, which also increase employers' non-wage costs even further (see the section "[Fiscal assumptions](#3.2-Fiscal-assumptions)").**{#par-ue846i}
{#par-uu5oee}
****
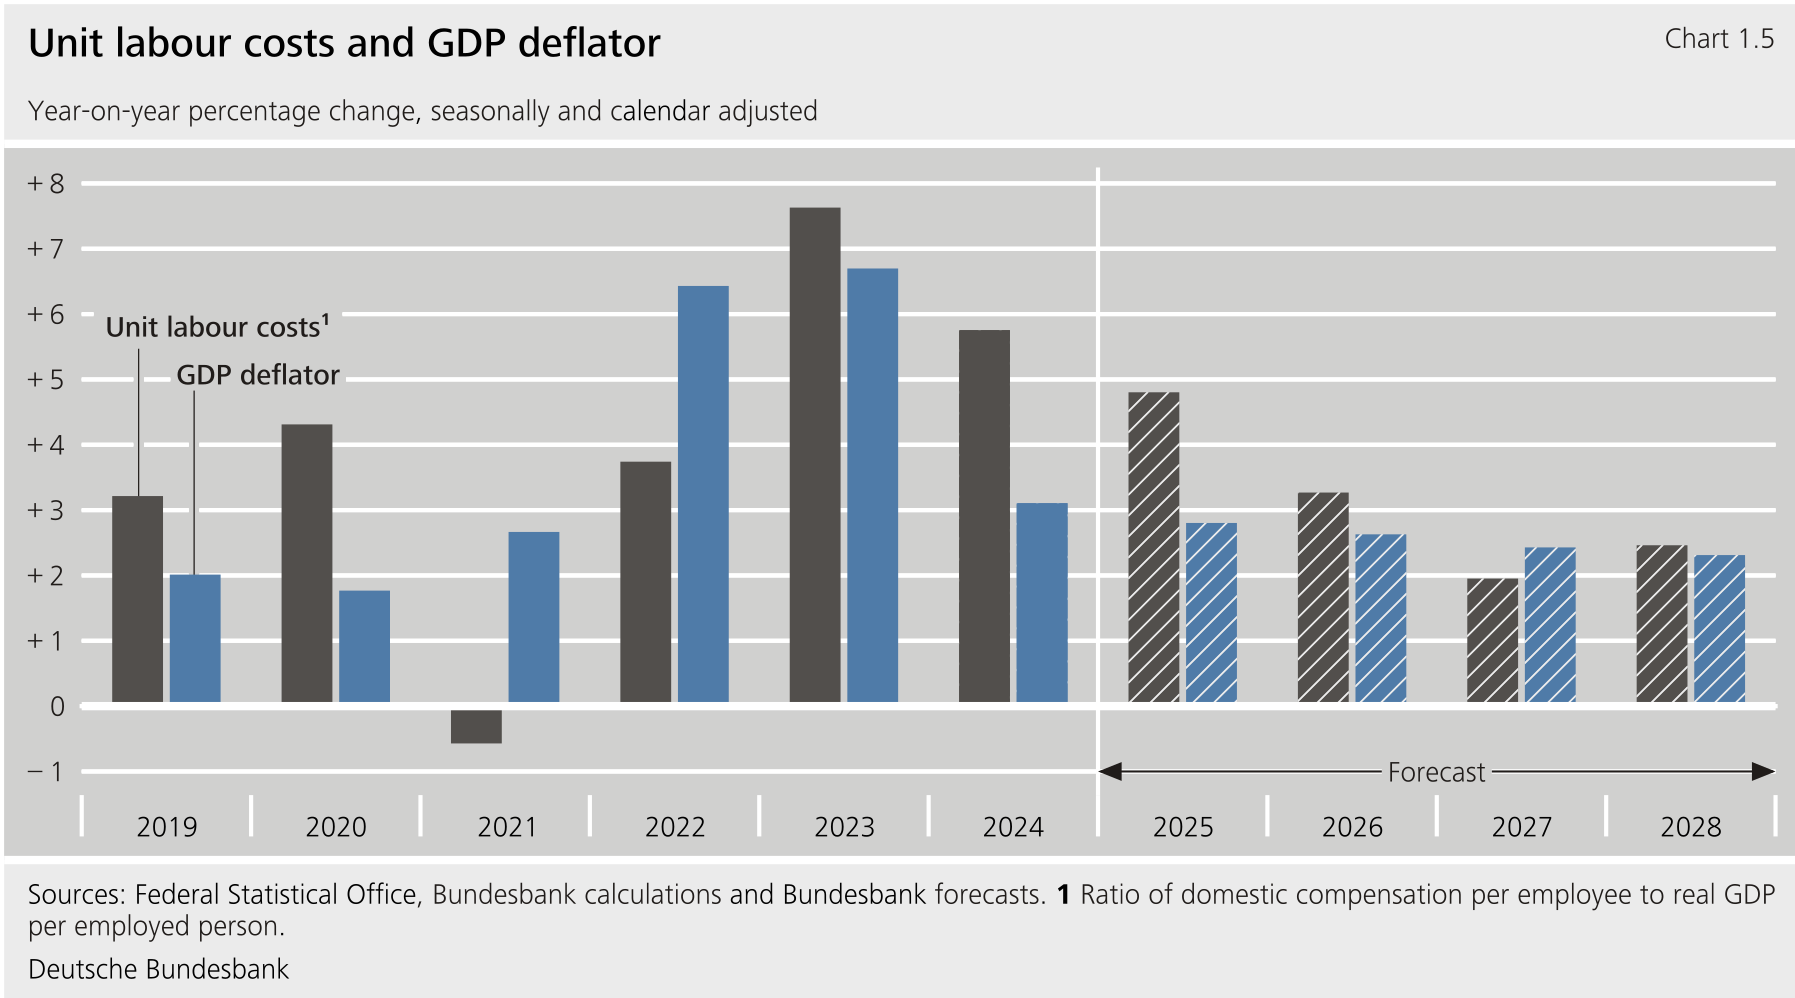
****Unit labour costs will rise sharply over the forecast horizon and weigh on firms' profit margins.** The sharp rise in unit labour costs will ease from 4.8 % this year to 2.0 % in 2027, as wage growth calms and labour productivity rebounds markedly. Aggregate profit margins will partly cushion the cost surge at first. However, this does not apply to sectors that are benefiting to a particularly large extent from higher government spending. Some of these are already well utilised and additional demand is likely to be accompanied by significant price increases, especially in the defence industry, but also -- to a lesser extent -- in some parts of the construction sector. Profit margins will therefore recover somewhat in 2027. However, unit labour costs will pick up again in 2028 owing to the sharp rise in social contribution rates. Enterprises will partly compensate for these by reducing profit margins. Overall, domestic inflation as measured by the deflator will decline only gradually over the forecast horizon, from 2.8 % in 2025 to 2.3 % in 2028. This means that it will remain somewhat elevated throughout.**{#par-a3ueo8}
****
****Inflation is set to fall more slowly than previously expected, reaching around 2 % in 2027 and 2028.** Annual inflation will gradually decline from a projected 2.3 % this year to 2.2 % in 2026. At the same time, core inflation ( inflation excluding the volatile components energy and food) will sink from 2.8 % to 2.4 % (see the section "[Inflation forecast up to 2026](#3.8-Inflation-forecast-up-to-2026)"). In 2027, it will decline further to 2.1 % as growth in labour cost dwindles and weak aggregate demand continues to have an impact. As aggregate capacity utilisation increases and unit labour costs rise more sharply once more, it will pick up again slightly to 2.2 % in 2028. Wage growth, which is still strong, is set to contribute to marked increases in food prices over the forecast horizon. The decline in energy prices will slow by 2027, mainly because the downward pressure on energy commodity prices is expected to ease. The transition from the national emissions trading system (nETS) to the in 2028 will be accompanied by another significant decline in energy prices in Germany. This is because, according to the Eurosystem's harmonised assumption, the European carbon price will be lower in 2028 -- the year it is introduced -- than the national carbon price in Germany in 2027 (see the supplementary information "[Impact of the introduction of the Emissions Trading System 2 on consumer prices](#Impact-of-the-introduction-of-the-EU-Emissions-Trading-System-2-on-consumer-prices)"). Overall, headline inflation is forecast to drop to 2.1 % in 2027 and 1.9 % in 2028. Without the effect of the changeover to the , it would be roughly as high in 2028 as in 2027.**{#par-i31u2i}
{#par-e9i7ua}
**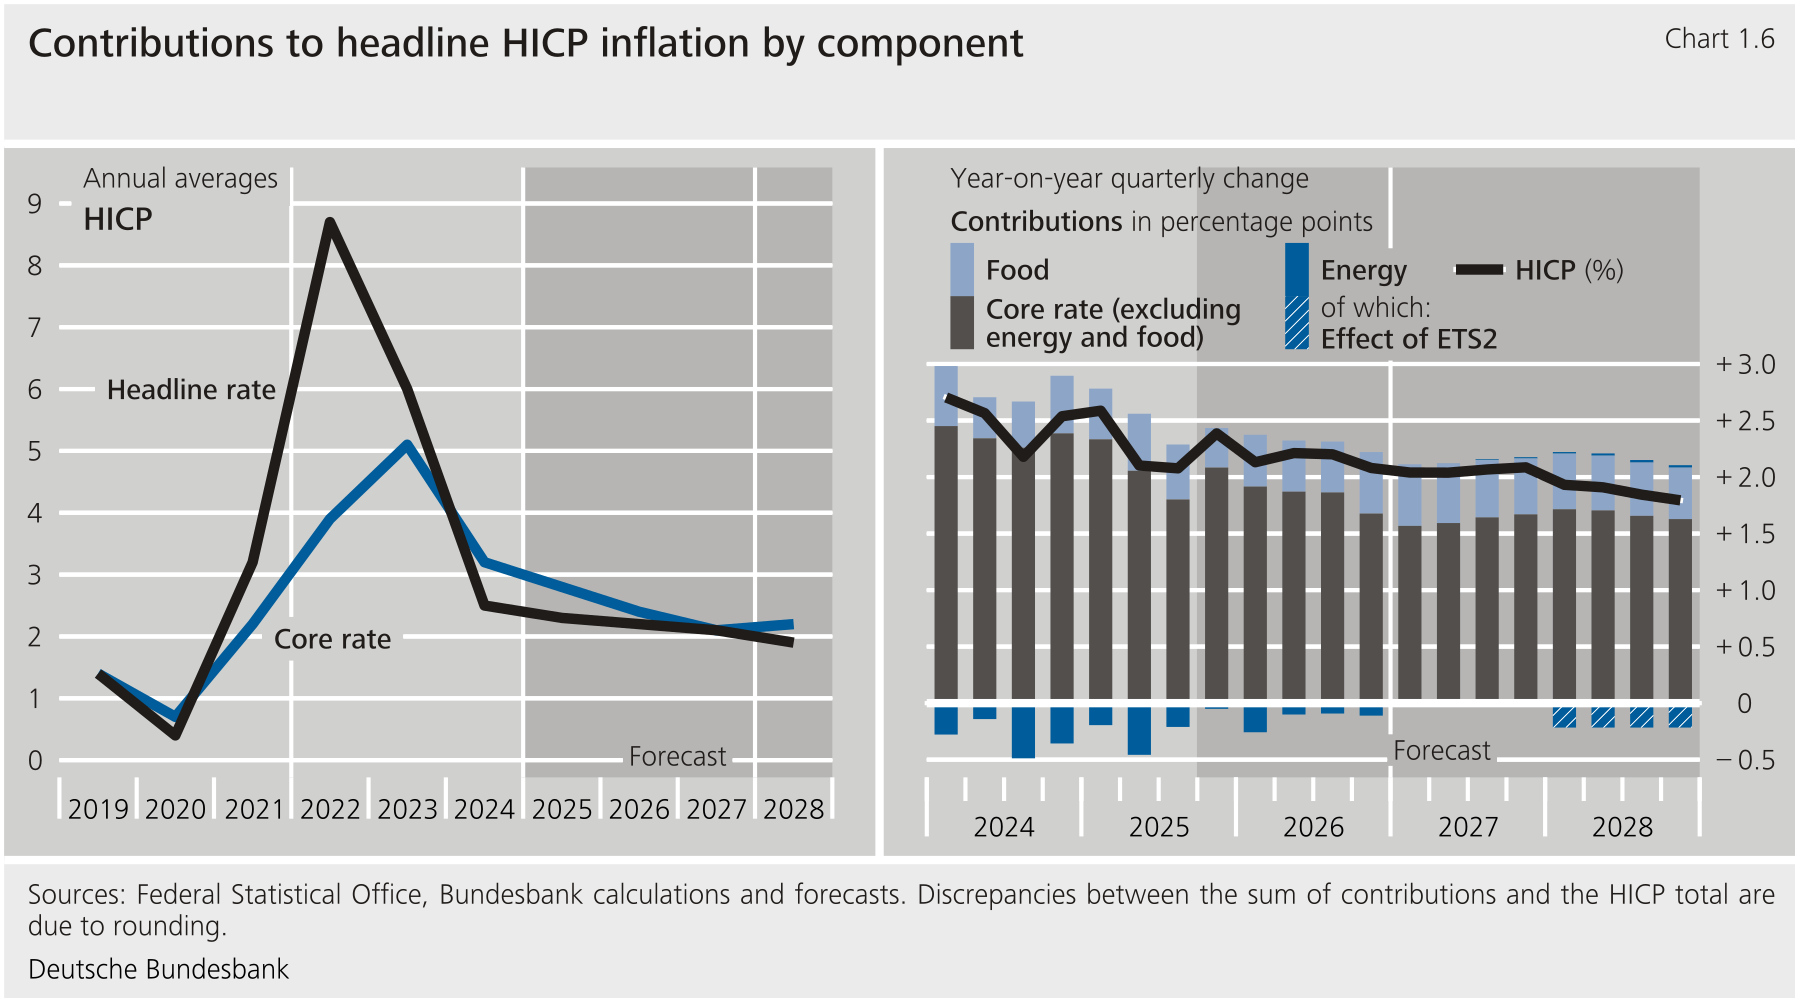**
****Compared with the June forecast, the forecast for headline** **inflation has been revised upwards, especially for 2026.** This is mainly because energy prices have fallen less sharply since, contrary to the assumption in the June forecast, the electricity tax cuts for households announced in the coalition agreement are not being implemented; moreover, subsidies for grid charges are smaller. In addition, underlying inflation was unexpectedly strong, partly owing to the surprisingly sharp rise in wages and the associated upside surprise in the core components of the (see the section "[Inflation forecast up to 2026](#3.8-Inflation-forecast-up-to-2026)").**{#par-ie6o81}
{#par-e2ia68}{#par-uao651}{#par-e4ue6o}
| **Table 1.3b: Revisions since the June 2025 forecast** Year-on-year percentage change ||||
| Item | **2025** | **2026** | **2027** |
|-----------------------------------|----------|----------|----------|
| Harmonised Index of Consumer Prices ||||
| December 2025 forecast | 2.3 | 2.2 | 2.1 |
| June 2025 forecast | 2.2 | 1.5 | 1.9 |
| Difference (in percentage points) | 0.1 | 0.7 | 0.2 |
{#par-a85o28}
**Impact of additional government infrastructure spending on German potential output** {#tar-2}
-----------------------------------------------------------------------------------------------
****Effects of government investment on potential output according to the empirical literature****{#par-ii3e9o}
****With the Infrastructure and Climate Neutrality Fund, policymakers are aiming, amongst other things, to strengthen German potential growth through additional government investment.** According to the empirical literature, government investment can indeed have a positive impact on potential output.[\[1\]](#_ftn_4da6b8eb_1) Government investment in infrastructure and research and development () can increase long-term growth by strengthening the physical capital stock or total factor productivity (). The extent of the effect on potential growth depends on the exact nature of the investment. According to the , for example, the effects of spending on are typically above average.[\[2\]](#_ftn_4da6b8eb_2) Apart from that, the starting level of the public capital stock matters for increased growth. As marginal returns decline, growth gains are lower beginning from an already high level of public capital stock. How investment expenditure is financed, and through which measures, is also likely to be relevant.**{#par-u384i1}
****Modelling the impact of additional infrastructure investment on potential output in Germany** [\[3\]](#_ftn_4da6b8eb_3)**{#par-i234a3}
****The extent to which government investment in infrastructure can strengthen potential output can be simulated using models.** There are various ways to model the relationship between government investment and potential growth. An important parameter in many model analyses is the (short-term) output elasticity of the public capital stock. It indicates the percentage by which potential output grows if the public capital stock increases by 1 % (in the same period). There are various estimates of the magnitude of this elasticity in the literature; according to a review of the literature, it is between 0.07 and 0.12.[\[4\]](#_ftn_4da6b8eb_4) The following section presents model approaches that are used to estimate effects on potential output based on government infrastructure investment expected in Germany. These models assume elasticities that fit this range.**{#par-eea16i}
****A partial parametric production function approach based on Suresh et al. (2024) serves to quantify the direct and immediate impact of government investment on potential output.** The aggregate production function contains the public capital stock as an independent input factor. This can be seen as a public good in the broader sense.[\[5\]](#_ftn_4da6b8eb_5) In this model, general government provides firms with infrastructure for productive purposes, such as transport infrastructure. Potential output also depends on , the private capital stock and total hours worked.[\[6\]](#_ftn_4da6b8eb_6)In this simulation, the public capital stock is assumed to have a real output elasticity of 0.1 %, in line with the literature. One advantage of the partial model approach is that the lagged supply-side effects of government infrastructure investment can be taken into account.[\[7\]](#_ftn_4da6b8eb_7) This is because it sometimes takes several years to complete an infrastructure project (e.g. the refurbishment or construction of large bridges).[\[8\]](#_ftn_4da6b8eb_8) After completion, it usually takes some time for the improved or new infrastructure to be fully utilised, e.g. until companies incorporate a new railway line or road into their itineraries.[\[9\]](#_ftn_4da6b8eb_9)**{#par-u6eieu}
****The results of the partial analysis do not include feedback effects or general equilibrium effects.**On the one hand, government investment can jump-start the economy, thereby promoting private investment or employment. On the other hand, additional government investment can cause interest rates or wages to rise, thus crowding out private investment. Other model categories can at least partially capture these aspects.**{#par-o92ae2}
****In addition to the direct effects of government infrastructure investment on potential output, semi-structural macroeconometric models provide information on the spillover effects on private investment and employment.** The Bundesbank's macroeconometric model (BbkM-DE) captures these relationships.[\[10\]](#_ftn_4da6b8eb_10) In the macroeconomic production function, government investment increases potential output through direct effects on the aggregate capital stock. In contrast to the partial production function approach, the model can also capture spillover effects on private investment and employment based on estimated elasticities. Delays in government investment are also taken into account in the BBkM-DE model in the analysis presented here.[\[11\]](#_ftn_4da6b8eb_11)**{#par-u7i958}
****General equilibrium effects in the impacts of government investment on potential output can also be captured using the Bundesbank's** **model GEAR.** [\[12\]](#_ftn_4da6b8eb_12) Its detailed model of the government sector gives it an additional advantage in terms of the macroeconomic impact of fiscal policy.[\[13\]](#_ftn_4da6b8eb_13) Under this model framework, government investment is assumed to have a positive spillover effect on firms' .[\[14\]](#_ftn_4da6b8eb_14) It can also indirectly promote or crowd out private investment. The effects on potential output are approximately interpreted as the impacts of government investment on productivity and the capital stock of firms.[\[15\]](#_ftn_4da6b8eb_15)**{#par-o953i4}
****Assumptions regarding additional investment****{#par-o45i8a}
****The simulations mainly capture effects on potential output from additional government infrastructure investment compared with 2024, as contained in the Forecast for Germany up to 2028 and extrapolated up to 2035** (see the section entitled "[Fiscal assumptions](#3.2-Fiscal-assumptions)").[\[16\]](#_ftn_4da6b8eb_16) Specifically, this includes investment by all government authorities less military investment, which means that not only infrastructure investment but also research expenditure, for example, are taken into account. Investments are considered additional if they increase the ratio of investment to nominal trend compared with 2024.[\[17\]](#_ftn_4da6b8eb_17) The investments are divided into three categories for the simulations:**{#par-o4ui99}
* **Construction investment: for example, the construction and maintenance of roads, railways and buildings.**
* **Investment in machinery and equipment: for example, equipping schools and other educational institutions.**
* **Other investment: for example, expenditure on research.[\[18\]](#_ftn_4da6b8eb_18)**
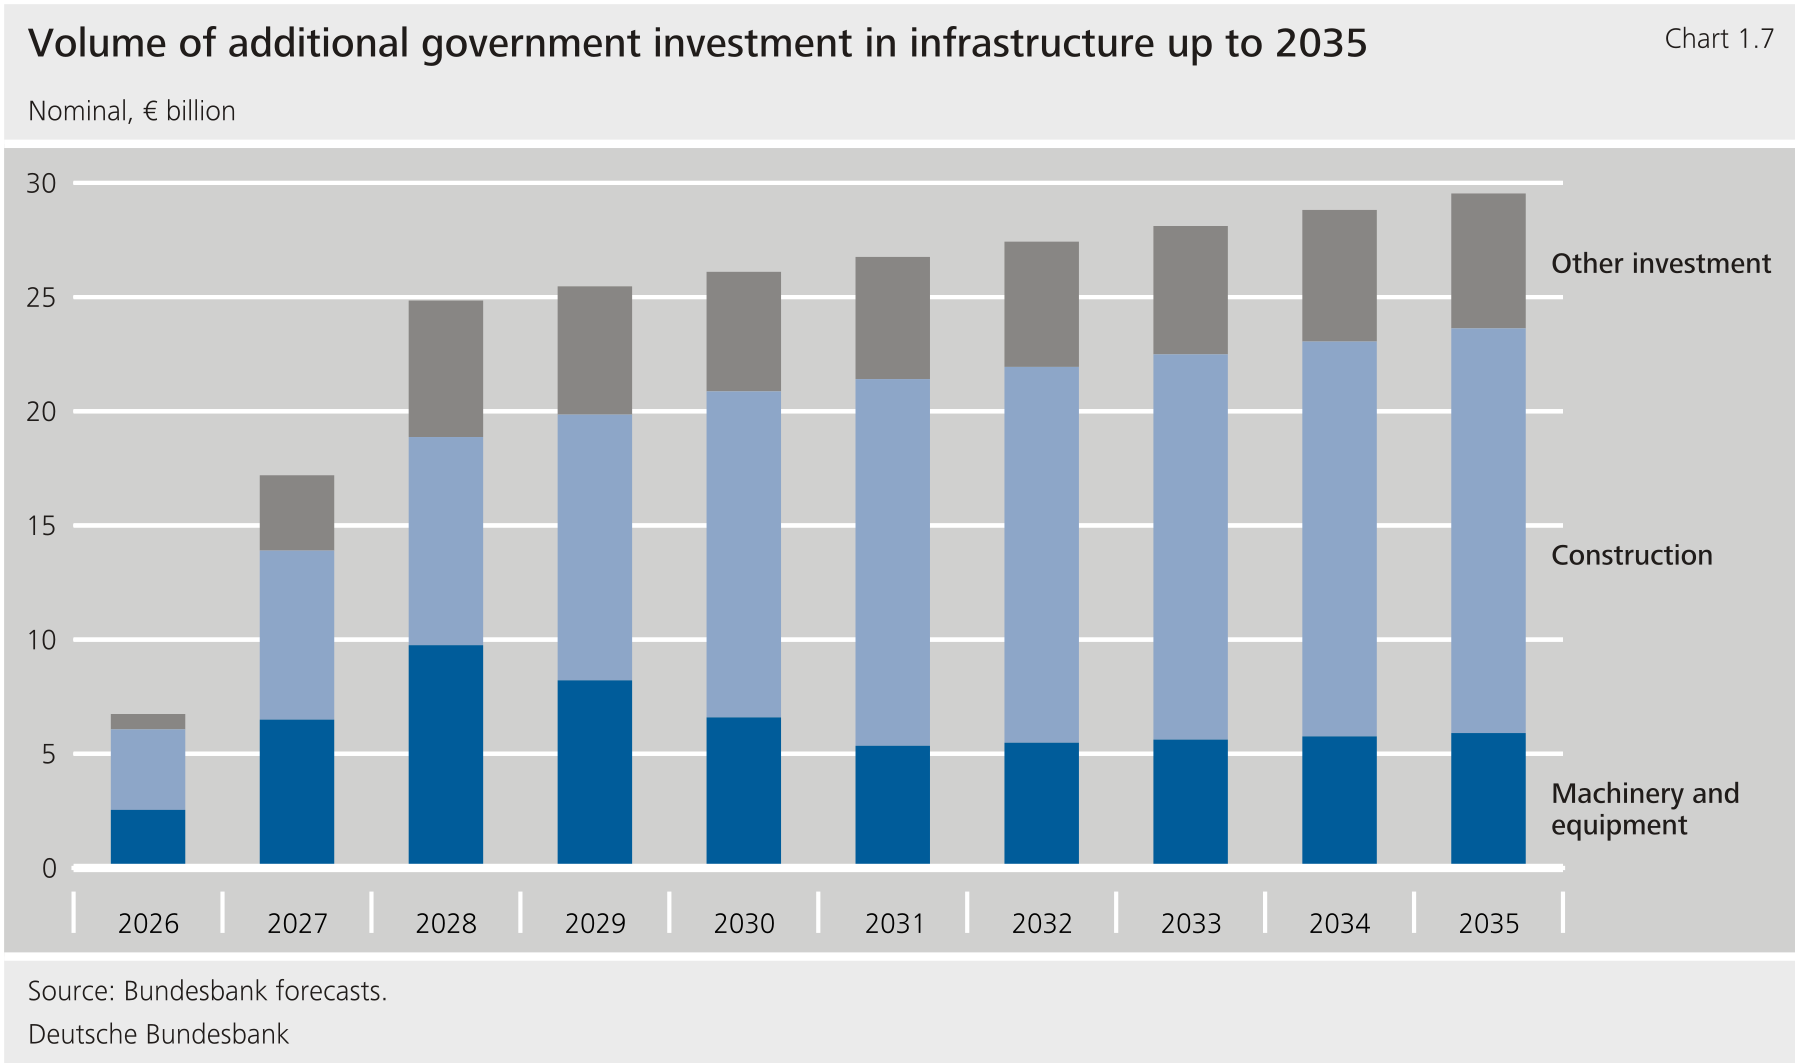
****In the simulation, additional government investment will rise to 0.5 % of** **by 2028. This ratio will then remain stable until 2035.** Larger infrastructure projects usually require a certain amount of preparation time, and according to the Forecast for Germany, additional investment is not expected for 2025: it will not rise significantly until 2026 and will continue to grow until 2028, also as a percentage of . Overall, the additional investment in the simulation amounts to around €240 billion in nominal terms between 2026 and 2035. Consequently, by that time only around half of the €500 billion in debt-financed resources of the Infrastructure and Climate Neutrality Fund will be used for additional investment.[\[19\]](#_ftn_4da6b8eb_19)**{#par-o733i4}
{#par-uo8u58}
****
****Impact of additional government infrastructure investment on German potential output****
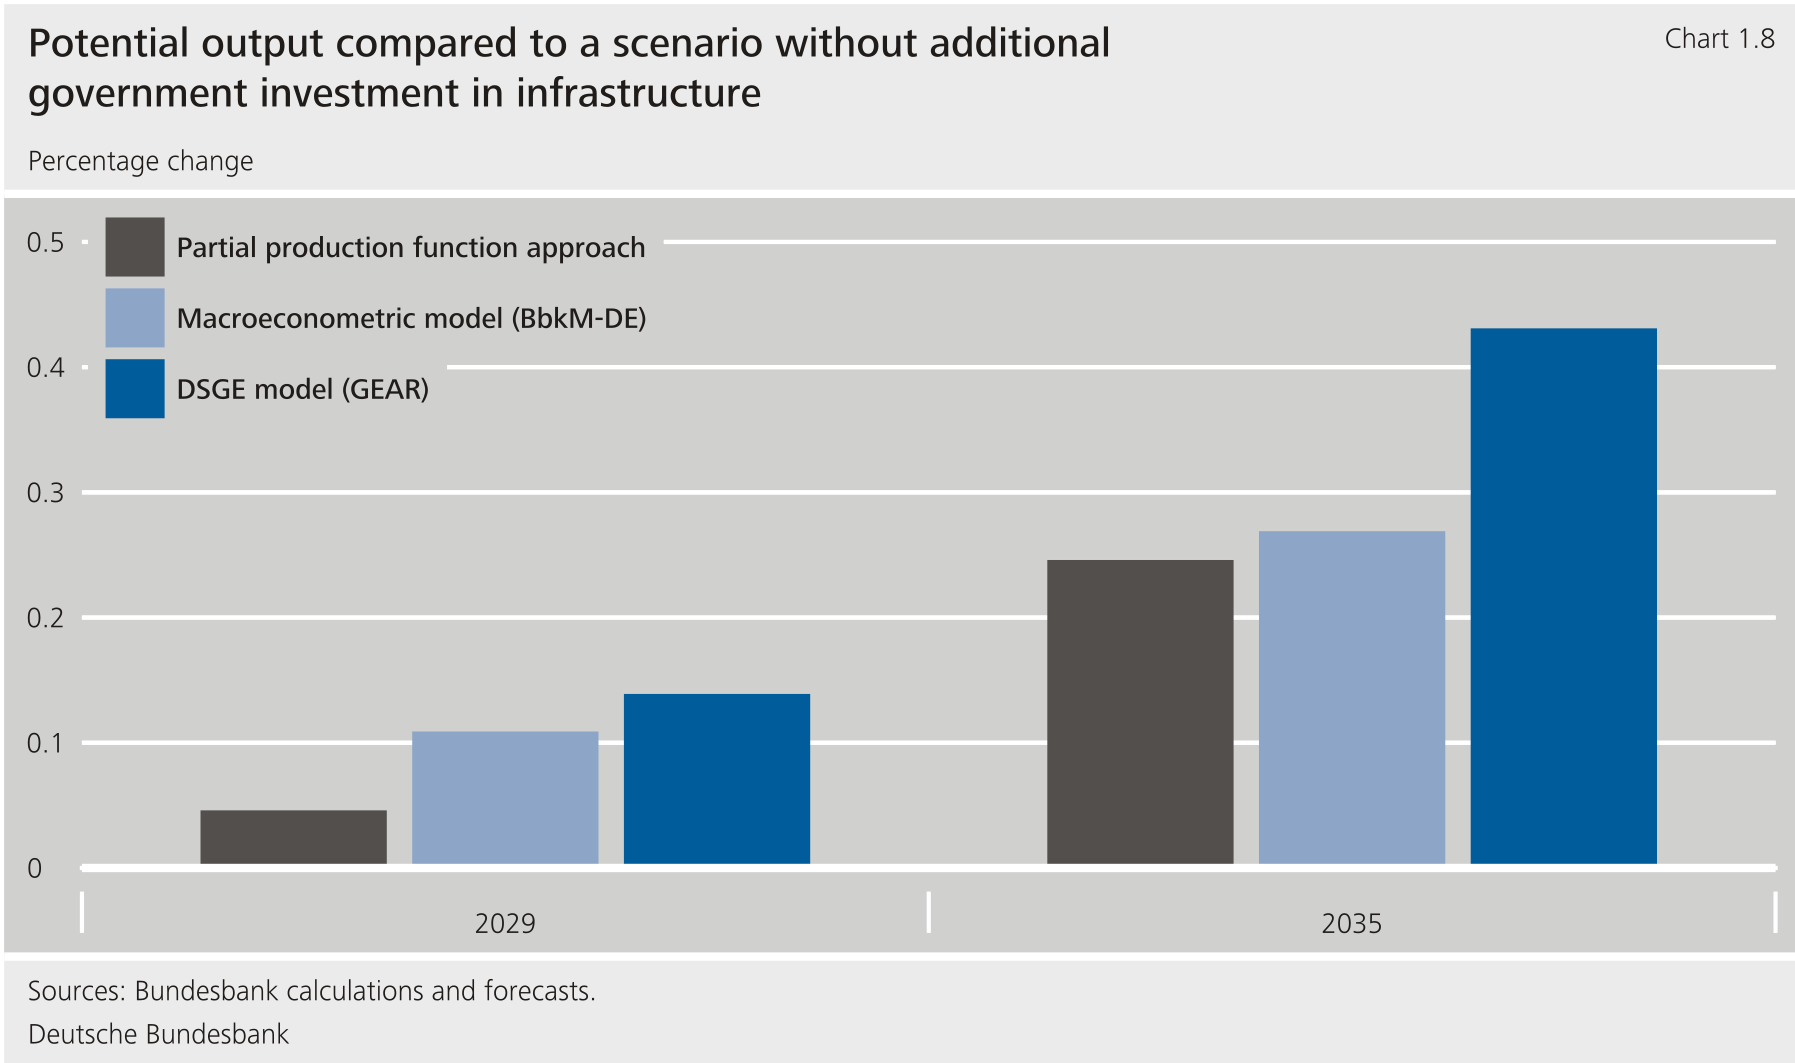
****The estimated impact of additional government infrastructure investment on potential growth is modest across the three models.** According to the partial production function approach, the German economy's potential output will be around 0.2 % higher in 2035 owing to the direct impact of additional government investment.[\[20\]](#_ftn_4da6b8eb_20) The fact that the output effect is modest is due in part to the fact that the public capital stock increases only moderately in percentage terms as a result of the additional investment.[\[21\]](#_ftn_4da6b8eb_21)**{#par-o35aau}
****The difference in outcome between the models is small.** The Bundesbank's macroeconometric model provides very similar results to the production function approach. The level of potential output will be around 0.1 % higher in 2029 and around 0.3 % higher in 2035 as a result of the additional government infrastructure investment, according to BbkM-DE. The impact on potential output is not significantly greater in the GEAR model, either. According to GEAR, the effect on the level of potential output will amount to around 0.1 % in 2029 and around 0.4 % in 2035. The impact on potential output in GEAR is greater primarily because delays in government investment are ignored.**{#par-ao5879}
{#par-ee2918}
****
****Neither BbkM-DE nor GEAR indicate that the economic stimulus provided by additional government infrastructure investment will do much to boost private investment or employment.** According to GEAR, higher interest rates even lead to a slight crowding-out of private investment (though hardly noticeable in terms of potential output).**{#par-e17ue1}
****Some of the additional government investment will be channelled into research and development and can thus have an additional positive impact on** . There is a broad consensus in the empirical literature that investment increases productivity.[\[22\]](#_ftn_4da6b8eb_22) Additional government investment can thus strengthen potential output above and beyond the mere expansion of the capital stock through positive spillover effects on . Based on elasticities from recent studies and the expected additional government investment in other assets, which largely comprises expenditure, these effects can be roughly quantified (for example, in Moretti et al. (2025)). This suggests that potential output could be around 0.1 % higher in 2035 owing to the positive effect on .**{#par-ea9956}
****Although the simulated effects of the three model categories are similar, the results are subject to a great deal of uncertainty.****{#par-e9o23a}
* **Implementation and costs of the projects will depend on the available production capacity. A large proportion of the funds will be channelled into sectors such as civil engineering, which are either relatively small or where capacity utilisation is already quite high. In addition, the shortage of skilled workers could turn into a bottleneck in some cases. In the event of capacity bottlenecks, additional delays and/or higher prices are to be expected. At a disaggregated sectoral level, the macroeconomic models used here do not capture such reciprocal effects. The same applies to possible dampening productivity effects if, due to additional government investment, employment is pulled out of sectors such as manufacturing with above average productivity and redirected to less productive sectors such as construction.**
* **However, the impact on potential growth could also be stronger than simulated here, especially if a higher share of the resources from the Infrastructure and Climate Neutrality Fund were used for additional investment than assumed here. The effects could also be greater if particular efforts were made to efficiently address the most pressing vulnerabilities -- such as bridge closures or other bottlenecks in transport infrastructure -- or if additional spending on digital infrastructure (e.g. due to accelerated digitalisation) strengthened .[\[23\]](#_ftn_4da6b8eb_23)**
* **With regard to the simulation inputs, the assumptions about how quickly and extensively additional investment will be made are subject to considerable uncertainty.**
* **A situation in which the higher government debt and interest burdens associated with additional investment generally reduce fiscal space elsewhere is not simulated here. This applies to the extent that additional investment does not create fiscal space -- if, for example, stronger structural growth were to make it possible to structurally increase government revenue more strongly or to provide government services more cost-effectively through greater digitalisation. Ultimately, the government deficit will have to go back down in the future in order to achieve sustainable government finances and to meet the fundamental objectives of the fiscal rules.[\[24\]](#_ftn_4da6b8eb_24)**
****Conclusion****{#par-oa58o8}
****The simulations presented here suggest that the impact of additional government infrastructure investment on potential output will be modest over the forecast horizon and beyond.** At the beginning, this is partly due to the slow rise in government investment and the fact that its impact on the supply side is lagged in some cases. The effects will therefore be barely noticeable over the forecast horizon up to 2028. In the longer term, the potential output of the German economy in 2035 could be 0.3 % to 0.5 % higher due to additional government infrastructure investment if, in addition to the model results, positive spillover effects on through additional government expenditure are taken into account.**{#par-aoa8i6}
****Potential growth in Germany could probably be increased more significantly if supply-side measures to strengthen potential employment were taken alongside the Infrastructure and Climate Neutrality Fund, or if red tape were reduced** **(e.g. through simpler or shorter approval procedures).**[\[25\]](#_ftn_4da6b8eb_25) In general, one component needed for a reliable outlook is a robust budget plan that will bring the deficit back down in the medium term without cutting back on the relevant infrastructure investment.**{#par-a1ui55}
1. **{#_ftn_4da6b8eb_1} See (2016a) and Bom and Ligthart (2014). The extent to which government investment has a lasting impact on economic performance is examined. Shorter-term economic stimulus effects on are disregarded.**
2. **{#_ftn_4da6b8eb_2} See (2016a). Model simulations likewise indicate that infrastructure investment has positive output effects in the long run (see Ramey (2020), Suresh et al. (2024) and (2016b)). Delays in the implementation of public investment reduce the short-term effects. On the other hand, the long-term effects can be greater if the public capital input is productive or if there is a large backlog in the public capital stock (relative to the optimum).**
3. **{#_ftn_4da6b8eb_3} This supplementary information relates to government investment as defined in the national accounts less military investment. In addition to investment in construction and in machinery and equipment, this includes expenditure on , for example. Infrastructure investment is the most important factor in this analysis, which is why this term is mostly used here for the sake of simplicity.**
4. **{#_ftn_4da6b8eb_4} See Ramey (2020). At around 0.08 %, the value calculated in the meta-study by Bom and Ligthart (2014) also falls within this range.**
5. **{#_ftn_4da6b8eb_5} Public goods in the narrower sense are, for example, public roads that can be used by everyone and -- except in the case of heavy traffic -- are non-rivalrous. However, the public capital stock also includes, for example, public roads subject to tolls or traffic congestion. A toll system can generally be used to enforce excludability (club goods); congestion makes goods rivalrous (common-pool resources).**
6. **{#_ftn_4da6b8eb_6} In the literature, private production is often considered instead of aggregate output. In this case, only spillover effects of the public capital stock on the private sector are modelled.**
7. **{#_ftn_4da6b8eb_7} The projections of the additional public capital stock due to additional government investment are calculated here using the perpetual inventory method. Specifically, the public capital stock is extrapolated based on the assumptions regarding future government investment, the (geometric) depreciation rate of government capital goods and delays in government investment.**
8. **{#_ftn_4da6b8eb_8} Expenditure on investment is shown here as defined in the national accounts. This means that it reflects the progress of construction and not the cash outflow of funds.**
9. **{#_ftn_4da6b8eb_9} According to a study for the United States (see Congressional Budget Office (2021)), for every $1 billion increase in infrastructure investment, $400 million would affect private sector productivity after one year, $800 million after two years and the entire amount after seven years. According to a recent study, public infrastructure projects in Germany took just over 40 % longer than in the United States (see Boston Consulting Group (2024)). The present analysis assumes that German economic policy can accelerate public projects to the point where they only need around one-third longer on average than in the United States. The full impact of an investment is assumed to be felt 10 years after the spending.**
10. **{#_ftn_4da6b8eb_10} See Haertel et al. (2022).**
11. **{#_ftn_4da6b8eb_11} In line with the partial approach, capital accumulation in the model is assigned a corresponding delay term.**
12. **{#_ftn_4da6b8eb_12} See Gadatsch et al. (2016). GEAR's simulations, unlike those in BbkM-DE, also factor in the influence of forward-looking expectations.**
13. **{#_ftn_4da6b8eb_13} This is a multi-country model that models Germany, the euro area excluding Germany, and the rest of the world.**
14. **{#_ftn_4da6b8eb_14} The output elasticity of the public capital stock is, alongside other parameters of this model, estimated in Bayesian fashion. According to this calculation, it amounts to around 0.1 for Germany.**
15. **{#_ftn_4da6b8eb_15} In GEAR, the public capital stock is incorporated into firms' production function as an input factor and is interpreted as part of . Government investment is therefore assumed to increase firms' productivity. Government investment can also affect private investment through general equilibrium effects stemming from changes in capital productivity and from price changes.**
16. **{#_ftn_4da6b8eb_16} The forecast runs until 2028 and incorporates central government plans as one of several factors. For the years from 2029 onwards, the ratio of additional investment to is extrapolated at the level reached in 2028. The ratio of the different types of investment converges back towards that over the past few years, as the initially larger amount of time required for additional construction investment should no longer be of any relevance looking further ahead.**
17. **{#_ftn_4da6b8eb_17} Nominal trend is determined (at annual data frequency) as a product of the deflator and smoothed real (Hodrick-Prescott filter with the smoothing parameter set to 100). For the years 2025 to 2028, the trend estimate is based on developments according to the current Forecast for Germany. Starting in the following years, real is assumed to grow by 0.5 % and the deflator by 2 %.**
18. **{#_ftn_4da6b8eb_18} Due to its increased importance, has been recorded as an intellectual property investment since the 2014 benchmark revision of the national accounts. This is conditional on economic benefits being generated by the results of through their repeated use or application in the production process (see Lindner and Loose (2014)).**
19. **{#_ftn_4da6b8eb_19} The approval duration of the Infrastructure and Climate Neutrality Fund runs until 2036.**
20. **{#_ftn_4da6b8eb_20} The additional government investment will thus increase the growth rate of potential output by significantly less than one-tenth of a percentage point per year on average.**
21. **{#_ftn_4da6b8eb_21} In 2035, the government capital stock will be around 2.5 % higher than in the baseline scenario excluding additional government investment. In 2024, the government's nominal gross capital stock amounted to around €3.2 trillion, or around 14 % of aggregate gross capital stock (approx. €22.0 trillion). Cumulative additional investment between 2026 and 2035 will amount to around 6 % in nominal terms relative to government gross capital stock in 2024.**
22. **{#_ftn_4da6b8eb_22} See Moretti et al. (2025).**
23. **{#_ftn_4da6b8eb_23} See Handelsblatt (2024). Ramey (2020) also shows that shorter time-to-build periods can amplify the impact.**
24. **{#_ftn_4da6b8eb_24} See Deutsche Bundesbank (2025d), Section 2.2 "The rules permit large deficits on an exceptional and temporary basis".**
25. **{#_ftn_4da6b8eb_25} See Deutsche Bundesbank (2025a).**
**2 Risk assessment** {#tar-3}
------------------------------
****The forecast presented here is subject to a degree of uncertainty.** Especially when it comes to international trade disputes and geopolitical conflicts, developments could intensify or tend towards easing. With regard to German fiscal policy, plans to increase expenditure could be implemented more slowly than intended; however, an even more expansionary stance is equally possible. In addition, there are risks regarding the macroeconomic impact of demographic change and the changeover of carbon trading to the . Overall, risks to economic activity tend to be tilted to the downside, while risks to inflation are predominantly to the upside.**{#par-ueeoa2}
****There is still a high degree of uncertainty about how international trade disputes will play out.** The trade agreements between the United States and the in August gave firms greater planning certainty in terms of global trading conditions.[\[16\]](#_ftn_root_16) However, this remains challenging. The trade dispute between the United States and China has also eased somewhat of late, but could still escalate further owing to the provisional nature of the agreement. German firms could bear the brunt of such a situation, especially if China were to impose extensive export restrictions on rare earths and other intermediate inputs. In all likelihood, a supply shock such as this would dampen growth in Germany and raise inflation. At the same time, there is a still a chance that the Supreme Court could rule certain punitive tariffs imposed by the President illegal on the grounds that they exceed executive authority. As a result, tariffs could be reduced or even suspended.[\[17\]](#_ftn_root_17) This could then see German exports and economic output rise more sharply than expected.**{#par-e14157}
****Geopolitical conflicts are at risk of intensifying but could also have the potential to ease.** For instance, there could be a ceasefire in Ukraine if ongoing diplomatic efforts are successful. If sanctions against the Russian energy sector were to be eased or attacks on the energy infrastructure of the two countries were reduced, commodity prices would be expected to decline gradually. On the other hand, the situation could also worsen, thus triggering upward pressure on key commodity prices. A potential conflict between the United States and Venezuela could also play a role. Overall, however, from today's perspective, it is downside risks to international oil and gas prices that are likely to predominate until 2027. This assessment is based mainly on signs of an oil glut and the strong ongoing expansion of global liquefied natural gas export capacities.[\[18\]](#_ftn_root_18) If energy commodity prices turn out to be lower, this would stimulate German economic activity to a given point and dampen inflation.**{#par-a27892}
****There is considerable uncertainty surrounding the economic stimulus provided by fiscal policy.** This entails both downside and upside risks to the forecast.For example, it is currently unclear how central government intends to deal with the urgent need for action to ensure compliance with national fiscal rules by 2028. The stimulus to the economy stemming from government measures will also depend heavily on how much additional spending on defence and non-military investment actually takes place.On the one hand, past experience suggests that the outflow of funds will be fairly slow. On the other, efforts are being made to reduce non-financial barriers posed by regulation or approval processes. A stronger outflow of funds could lead to higher price pressures than assumed, as capacity bottlenecks in individual sectors such as the defence industry or civil engineering are then likely to be even larger. This would probably boost the increase in the deflator, but would not necessarily have a major impact on consumer prices.**{#par-o8775a}
****Risks to the expected recovery would emerge if, for example, labour costs increase even more significantly owing to even larger burdens caused by demographic developments.** The assessment of wage growth at the current end is surrounded by unusually high uncertainty at present. The baseline for the forecast assumes that the unexpectedly strong wage growth in the first three quarters of this year is largely down to one-off effects and that wage dynamics will therefore decline markedly in the coming years. However, the persistence of these one-off effects cannot be conclusively confirmed based on the data available. There is therefore a risk the labour market is actually more heavily influenced by structural factors, causing elevated wage inflation for longer. In particular, sectoral heterogeneity in terms of economic and labour market conditions, coupled with demographics, could lead to an even more acute shortage of skilled workers and thus to additional upward pressures on wages. Demographic developments are also a key driver of the sharp rise in social security spending and the associated pressure on non-wage labour costs. This pressure, too, could be stronger than assumed. If, on the other hand, measures to curb costs are implemented, the rise in social contributions could be smaller. If labour costs go up even more steeply, the overall impact on the German economy is likely to be negative: Labour demand and employment would be dampened, prices could rise more sharply and firms' profit margins could be lower. The competitiveness of the German export industry would continue to decline, meaning that the export market share losses[\[19\]](#_ftn_root_19) would probably be even greater than anticipated in the forecast. Business investment would also be curbed. Finally, a weaker labour market and higher inflation would weigh on private consumption.**{#par-u3eo49}
****In 2028, the inflation rate is subject to risks surrounding the changeover to the European Union Emissions Trading System** . If the introduction of the were to be delayed further, the national carbon price would still apply in 2028 and the expected dampening effect on the rate would be eliminated. Even if the transition to is successful, this effect could turn out to be smaller. This is because the carbon price is to be set by the in the market with a cap on allowances, and there is no guarantee that it will be possible to fully achieve the desired limit on the carbon price. It should also be noted that the assumed carbon price will probably be too low for Germany's national climate targets to be met (see the supplementary information "[Impact of the introduction of the Emissions Trading System 2 on consumer prices](#Impact-of-the-introduction-of-the-EU-Emissions-Trading-System-2-on-consumer-prices)").**{#par-o38i44}
****Impact of the introduction of the** **Emissions Trading System 2 on consumer prices**** {#tar-4}
----------------------------------------------------------------------------------------------------
****The new** **Emissions Trading System 2** (**) is scheduled to enter into force in 2028.** As part of the "Fit for 55" package, the European Commission has set itself the target of reducing greenhouse gas emissions by at least 55 % by 2030 compared with 1990 levels. A key instrument for this purpose is the introduction of the . It envisages annual reductions in emission limits for buildings, road transport and selected smaller industrial plants as part of a CO₂ emissions trading system. At the level, it complements the Emissions Trading System 1 ( ), which has existed since 2005, and comprises emissions-intensive sectors such as electricity generation and industry, as well as intra-European aviation and maritime transport. The will have a marked impact on consumer energy prices and thus on overall consumer prices over the forecast horizon and beyond.**{#par-i246o9}
****In Germany, a national emissions trading system (nETS) has been in place for the buildings and transport sectors since 2021.** [\[1\]](#_ftn_4e7483bc_1) The initial fixed price of €25 per tonne of CO₂ emissions has been raised gradually and has stood at €55 per tonne since the beginning of this year. From 2026, emission rights will be auctioned, with the price being limited by a corridor between €55 and €65 per tonne. The national carbon pricing system is to be replaced by the -wide .[\[2\]](#_ftn_4e7483bc_2) The introduction of the was originally planned for 2027 but, as things currently stand, will be postponed to 2028. This means that the nETS is likely to run for one year longer than previously envisaged. Both of these assumptions underpin the Forecast for Germany.**{#par-a5oea3}
****The** **aims to create an** -**wide carbon price for the buildings and road transport sectors that is capped by various accompanying rules.** The system requires those that bring fossil fuels into circulation to purchase and verify emission certificates for the greenhouse gas emissions generated.[\[3\]](#_ftn_4e7483bc_3) The costs for this are likely to be passed through to final consumers.[\[4\]](#_ftn_4e7483bc_4) Under the , the price for the CO₂ emission certificates will generally be determined by the auction on the market. In this context, the total number of certificates available each year will be reduced in stages. Accompanying measures are intended to mitigate imbalances between supply and demand and prevent excessive price fluctuations.[\[5\]](#_ftn_4e7483bc_5)**{#par-u9i827}
****In the Forecast for Germany, assumptions were made for future carbon prices within the scope of the nETS and** **and their direct impact on consumer prices was quantified.** For 2026 and 2027, a carbon price of €65 per tonne is assumed under the national emissions trading system. On account of the expected scarcity of certificates, a price at the upper limit of the envisaged price corridor is thus assumed. For 2028, a carbon price of €46 per tonne is assumed under the . This assumption is based on approaches adopted by the European Commission and was defined as a joint, harmonised forecast assumption in the Eurosystem.[\[6\]](#_ftn_4e7483bc_6) Compared with the technical assumptions in the June 2025 Forecast for Germany, the assumed carbon price for the year the is introduced, which has now been postponed, has thus been revised downwards from €59.[\[7\]](#_ftn_4e7483bc_7)**{#par-o798i9}
****In the road transport sector, the price will mainly affect the consumer price component "fuels" (which can be broken down into diesel and petrol), while in the heat and electricity sector the greatest impact will be felt by the components "heating oil" and "gas".** For each of these products, the specific CO₂ emissions and thus also the price mark-up due to carbon pricing differ. A €10 per tonne increase in the carbon price, for instance, corresponds to a mark-up of between 2 cent and 3 cent per litre for fuel prices and of 0.2 cent per for gas.[\[8\]](#_ftn_4e7483bc_8) For a carbon price of €55 in 2025 under the national system, the carbon price mark-up corresponds to between 13 cent and 15 cent per litre for refined petroleum products and slightly more than 1 cent per for gas. To quantify the impact of a change in the carbon price on consumer prices, the average final consumer prices of individual energy components can be used.[\[9\]](#_ftn_4e7483bc_9) If, for example, a petrol price of €1.70 per litre is assumed at the end of 2025, the assumed €10 rise in the carbon price in 2026 would increase the price by 1.7 % if fully passed through to consumers.[\[10\]](#_ftn_4e7483bc_10) Similar calculations can be carried out for all energy components. The impact on the individual components with their respective share in the basket of goods is then added to the overall impact on the inflation rate. It is assumed that the carbon price adjustment will be fully passed through to consumers and will take place at the beginning of the respective year.**{#par-i9o16a}
{#par-i2o7o2}{#par-u38eui}{#par-ai5655}{#par-e56iio}{#par-a6ao57}{#par-e1iiei}
| **Table 1.4: CO₂ emissions and price changes per energy component in the consumer price index** ||||||
| Item || Consumer prices ||||
| Item || Fuel || ||
| Item || Gasoline | **Diesel** | Heating oil | Natural gas |
|----------|----|----------|------------|-------------|-------------|
| **Percentage share of** **(2025)** || 2.84 | 0.85 | 0.42 | 1.69 |
| **Carbon emissions (kg) per litre/kWh (natural gas)** || 2.37 | 2.65 | 2.66 | 0.20 |
| **Prices per tonne in given year (€)^1^** || **Mark-up in cents per litre/kWh** ||||
| **2025** | 55 | 13.04 | 14.58 | 14.63 | 1.11 |
| **2026** | 65 | 15.41 | 17.23 | 17.29 | 1.31 |
| **2027** | 65 | 15.41 | 17.23 | 17.29 | 1.31 |
| **2028** | 46 | 10.90 | 12.19 | 12.24 | 0.93 |
| Sources: Federal Office for Economic Affairs and Export Control and Bundesbank calculations. **1** For the years 2025 to 2027: National fixed carbon price (2025) and maximum price (2026 and 2027); 2028: Eurosystem assumption for the European carbon price. ||||||
{#par-a71955}
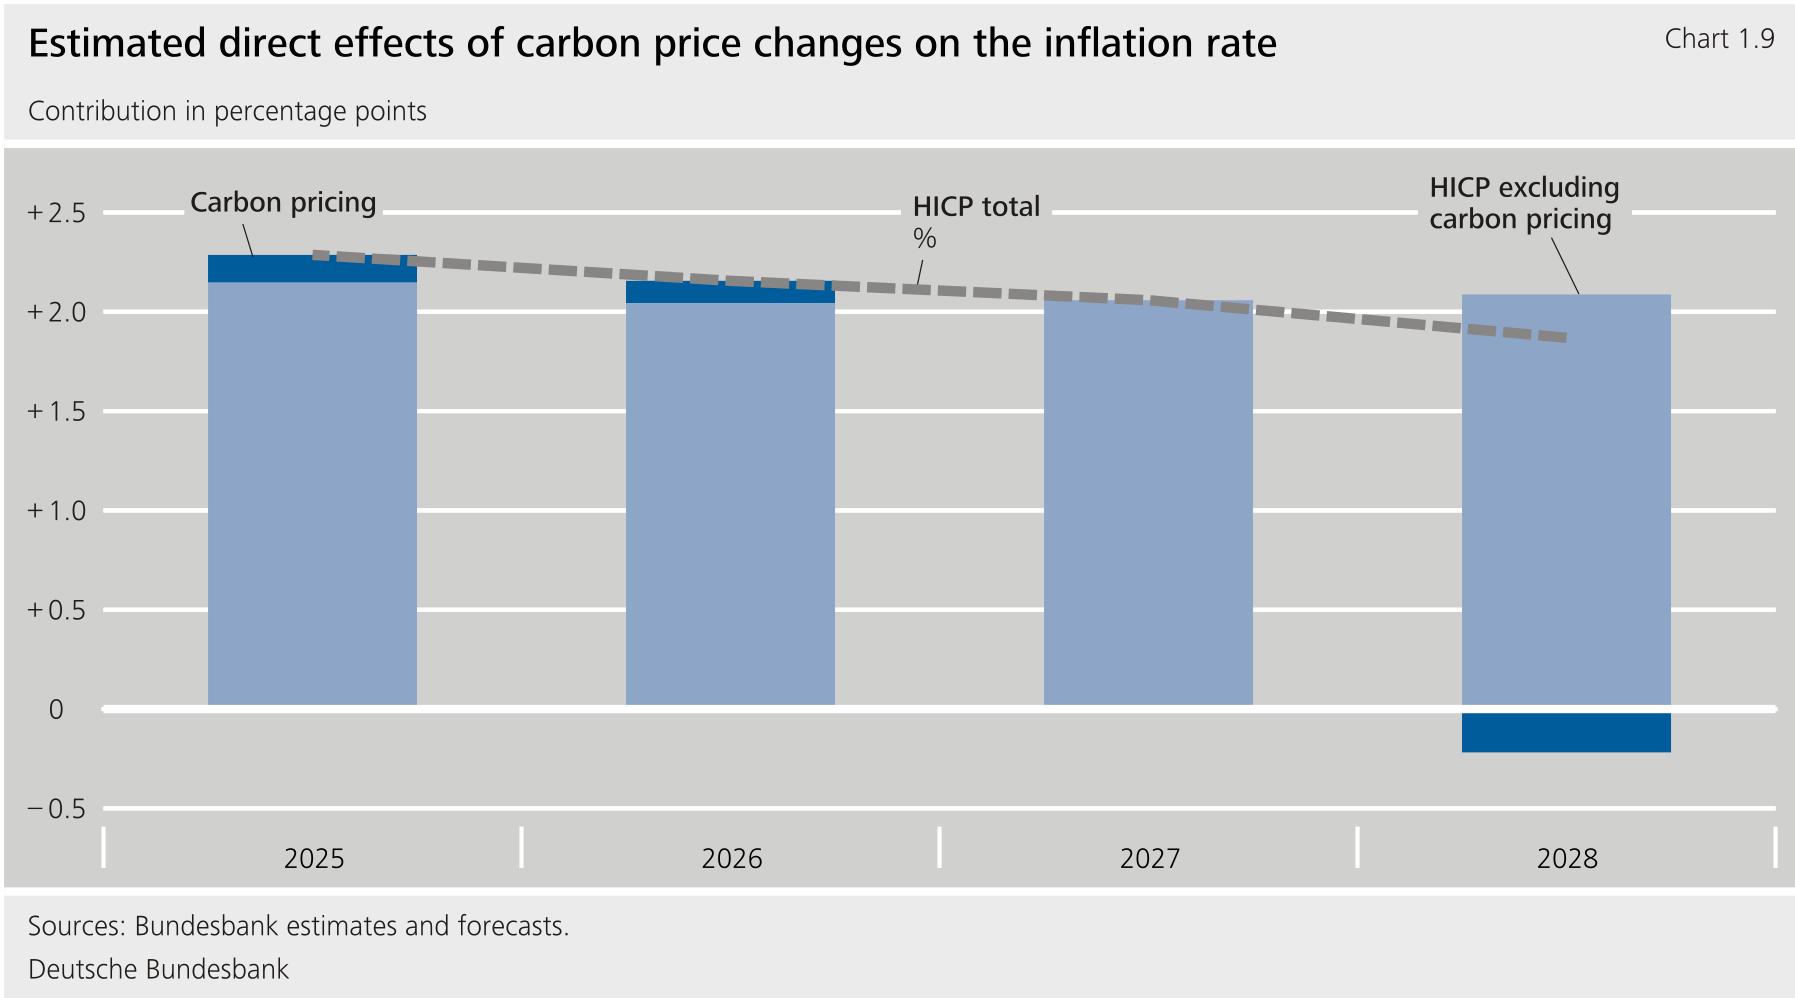
****The assumed carbon price path will moderately increase the inflation rate in 2026 and lower it significantly in 2028.** The assumed increase in the carbon price from €55 per tonne in 2025 to €65 per tonne in 2026 would raise the inflation rate overall by around one-tenth of a percentage point. According to the assumption, the carbon price will remain unchanged in 2027, meaning there is no impact on consumer prices. For 2028, it is assumed that the introduction of the will bring the carbon price down to €46 per tonne. As a result, energy prices would fall markedly and the inflation rate would be around ¼ percentage point lower than in the absence of a transition to the system. In general, the carbon price under the is expected to rise over time, which is likely to drive up inflation beyond the forecast horizon.**{#par-u9o9a8}
{#par-e316a6}
****
****The postponement of the introduction of the** **is expected to have a different impact over the last two years of the forecast horizon in Germany than in the euro area as a whole.** Compared with the June 2025 Forecast for Germany, the postponement of the introduction of , taken in isolation, will entail an upward revision of the inflation forecast for 2027, as the transition from the nETS price to a slightly lower price is no longer envisaged for that year. In the euro area, by contrast, the postponement will tend to lead to a downward revision of the inflation forecast in 2027. A number of euro area countries do not yet have a national carbon pricing system; this means that the introduction of the could tend to put upward pressure on inflation in these countries. This price-driving effect is not expected to materialise until 2028 in the euro area due to the postponement of the introduction of the , whereas an inflation-dampening effect is expected in Germany at that point in time.**{#par-o9u42i}
****The future carbon price path and the associated impact on the inflation rate are subject to considerable uncertainty, as the price will be set by the market in the future** .[\[11\]](#_ftn_4e7483bc_11) While the carbon price under the national emissions trading system will remain within a relatively narrow price corridor of between €55 and €65 per tonne as of 2026, significantly larger fluctuations will be possible under the from 2028 onwards. It is unclear, in particular, whether the planned measures will be sufficient to stabilise the market or whether considerably higher prices might occur.[\[12\]](#_ftn_4e7483bc_12) Various analyses conclude that a significantly higher carbon price would be necessary to achieve the 's climate targets in the absence of additional measures.[\[13\]](#_ftn_4e7483bc_13) A three-digit allowance price is often cited in this context. Furthermore, the assumed carbon price could be too low to achieve Germany's national climate targets. In the Bundesbank's model simulations, a higher carbon price path than in the forecast was assumed.[\[14\]](#_ftn_4e7483bc_14) Even taking into account this higher price and the exogenous energy efficiency gains based on historical experience, Germany's emission reduction targets for 2030 are not achieved in the simulations.[\[15\]](#_ftn_4e7483bc_15) If, for example, the carbon price rises from €65 to €100, this is likely to raise the rate by around 0.4 percentage point. However, climate policy objectives could be scaled back, for example by postponing the introduction of the once again or by combining it with additional mechanisms to dampen the carbon price. In the former case, the inflation rate in Germany would turn out to be higher in 2028, as the higher national carbon price would then continue to exist. In the second case, the inflation rate would end up being lower.**{#par-u99a2u}
1. **{#_ftn_4e7483bc_1} See Deutsche Bundesbank (2019, 2023).**
2. **{#_ftn_4e7483bc_2} This is regulated in the Fuel Emissions Trading Act (*Brennstoffemissionshandelsgesetz*), in particular in Section 24.**
3. **{#_ftn_4e7483bc_3} For an overview of the system, see Directive 2023/959 of 10 May 2023 amending Directive 2003/87/ and Decision () 2015/1814 (see European Union (2023)).**
4. **{#_ftn_4e7483bc_4} Some of the auction proceeds from the will flow into the Social Climate Fund and an innovation fund at the level. The remaining revenue will be available to the Member States to use specifically for climate and social policy measures, particularly in the buildings and road transport sectors.**
5. **{#_ftn_4e7483bc_5} The has its own market stability reserve. This reserve makes additional allowances available to the market or withdraws them from the market on the basis of defined thresholds, both in terms of the quantity of allowances in circulation and the price level.**
6. **{#_ftn_4e7483bc_6} See European Commission (2025) and European Central Bank (2025).**
7. **{#_ftn_4e7483bc_7} See Deutsche Bundesbank (2025a).**
8. **{#_ftn_4e7483bc_8} In addition to the direct effect of the rise in the carbon price outlined above, also causes prices to go up.**
9. **{#_ftn_4e7483bc_9} Only the direct impact on consumer prices is calculated here. For more information on the macroeconomic impact of carbon pricing, see Deutsche Bundesbank (2019).**
10. **{#_ftn_4e7483bc_10} However, such a consideration can only approximate the impact of changes in the carbon price, as this impact changes depending on the average price that applies immediately before the price is raised. If, for example, petrol prices were higher as a result of an unexpected increase in the oil price at the end of 2025, the change in the carbon price would account for a smaller share of the total price and the percentage change resulting from the carbon price increase would be lower. The opposite applies to a lower initial price.**
11. **{#_ftn_4e7483bc_11} For example, the Joint Economic Forecast (2025) assumes a carbon price of €75 per tonne when the is introduced.**
12. **{#_ftn_4e7483bc_12} The futures contracts do not currently provide any reliable price signals, as no significant trading is taking place in the market yet.**
13. **{#_ftn_4e7483bc_13} See Graichen and Ludig (2024), Kalkuhl et al. (2023) or Rickels et al. (2023).**
14. **{#_ftn_4e7483bc_14} See Deutsche Bundesbank (2024a).**
15. **{#_ftn_4e7483bc_15} In this case, either more extensive climate policy measures or additional energy-saving technological progress would be necessary to achieve the desired savings.**
**3 More detailed information on the Forecast for Germany** {#tar-5}
--------------------------------------------------------------------
### **3.1 Assumptions regarding the international environment, exchange rates, commodity prices and interest rates** {#tar-6}
****The Forecast for Germany is based on joint assumptions by Eurosystem experts about the global economy, exchange rates, commodity prices and interest rates.** These assumptions are based on information that was available as at 26 November 2025.**{#par-a71a9a}
****So far, the global economy has proven more resilient to** **tariffs than expected in the June forecast, but growth will weaken next year.** [\[20\]](#_ftn_root_20) The global economy grew solidly overall in the second and third quarters of the year, and somewhat more strongly than assumed in the June forecast. Robust growth in the United States and China played a major part in this. Since the June forecast was finalised, the Administration has, on the one hand, agreed with several trading partners on more moderate tariffs than originally threatened, but has also introduced or increased sectoral tariffs.[\[21\]](#_ftn_root_21) The average rate for tariffs is considerably higher than at the beginning of the year, and trade barriers are expected to continue to weigh on the global economy. After global growth of 3.5 % this year, a rate of 3.3 %, which is slightly lower by long-term standards, is expected for the period from 2026 to 2028. It is also assumed that the 15 % tariff rate that applies to most imports of goods from the under the trade agreement between the United States and the will remain in place.[\[22\]](#_ftn_root_22)**{#par-o83395}
****Economic growth in the other euro area countries will be slightly better than assumed in the June Forecast for Germany.** The economic growth figures in the other euro area countries used in the forecast are derived from the forecasts of the national central banks, which were incorporated into the projection for the euro area published by the on 18 December 2025.[\[23\]](#_ftn_root_23) Particularly this year, economic growth in the euro area excluding Germany is significantly higher than in the June forecast, at a rate of 1.9 %. Momentum will weaken somewhat next year, but will remain slightly higher than in the previous forecast, with a growth rate of 1.4 % in 2026. Growth of 1.4 % is likewise expected in 2027 and 2028 respectively. In 2027's case, this is the same as in the June forecast.**{#par-e8a2o6}
****trade policy is weighing on global trade and dampening the expansion of German sales markets.** Protectionist trade policy and the associated remaining uncertainty had a significant impact on foreign trade. import demand was initially bolstered after the first tariffs were announced and further steps were expected, but slumped significantly in the second quarter. The remaining global trade in goods has so far held up well overall. Imports from a number of emerging market economies rose significantly, especially in the second quarter. Global trade will likely be negatively affected by trade policy in the current winter half-year before picking up again somewhat over the course of next year. After averaging 4.4 % this year, growth in 2026 is therefore expected to be significantly weaker, at 2.0 %. It will pick up again at 3.1 % in both 2027 and 2028, but will fall short of growth in the global economy. Over the next three years, German exporters' sales markets are likely to expand broadly in line with global trade.**{#par-ae52i3}
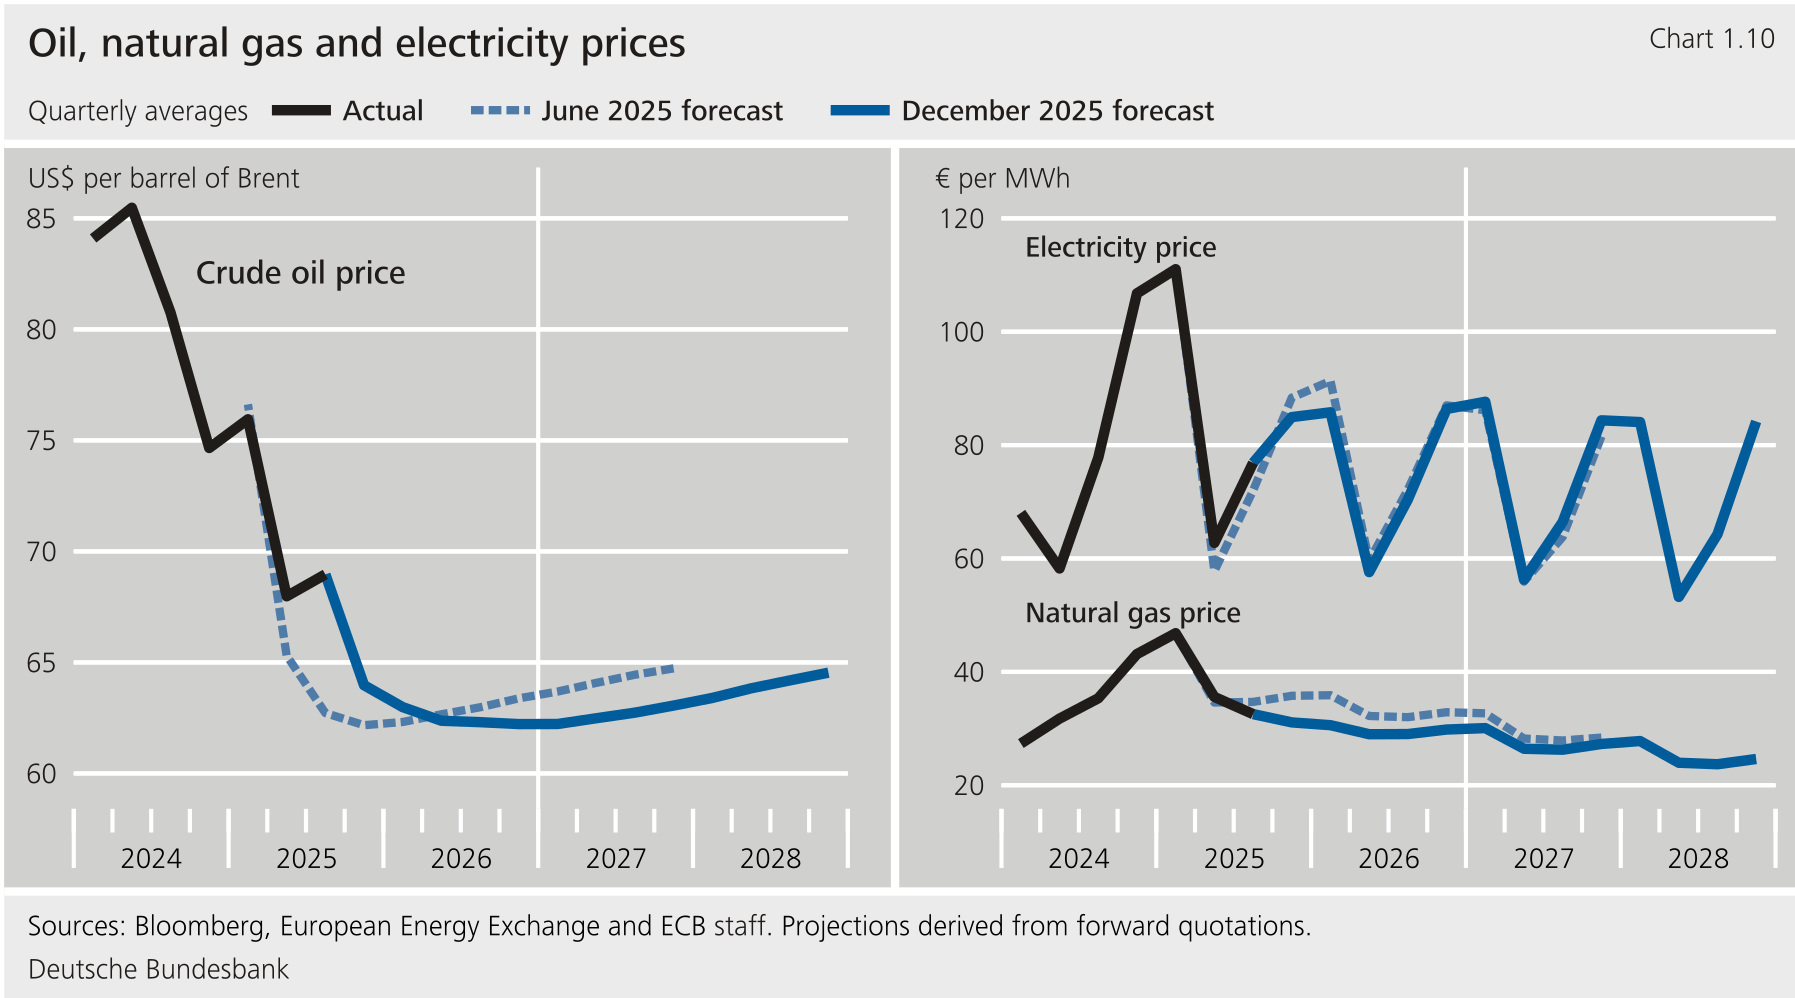
****The assumptions relating to exchange rates, commodity prices and interest rates are shown in the following table and chart.****{#par-e7a6o4}
{#par-iua244}{#par-i5o4e8}{#par-ia71iu}{#par-o2i262}{#par-o165u4}{#par-i9885u}{#par-eoi651}{#par-ua36ou}{#par-e96uo6}{#par-ui7ao1}{#par-e49uae}{#par-ua416e}
| **Tabelle 1.5: Major assumptions of the projection** ||||| | | |
| | December forecast |||| Revisions vs. June forecast^9^ |||
| Item | 2025 | 2026 | 2027 | 2028 | 2025 | 2026 | 2027 |
|------------------------------------------|-------|-------|-------|--------|--------|--------|--------|
| **Euro exchange rates** ||||| | | |
| dollar/euro | 1.13 | 1.16 | 1.16 | 1.16 | 1.8 | 2.7 | 2.7 |
| Effective^1^ | 127.6 | 129.8 | 129.8 | 129.8 | 1.2 | 2.1 | 2.1 |
| **Interest rates** ||||| | | |
| Three-month | 2.2 | 2.0 | 2.1 | 2.3 | 0.1 | 0.1 | -- 0.1 |
| Yield on government bonds outstanding^2^ | 2.6 | 2.8 | 3.0 | 3.2 | -- 0.1 | -- 0.1 | -- 0.1 |
| **Prices** ||||| | | |
| Crude oil^3^ | 69.2 | 62.5 | 62.6 | 64.0 | 3.7 | − 0.5 | − 2.5 |
| Natural gas^4^ | 36.5 | 29.6 | 27.5 | 25.0 | − 3.9 | − 10.8 | − 6.1 |
| Electricity^4, 5^ | 83.9 | 75.0 | 73.7 | 71.4 | 1.9 | − 3.2 | 2.6 |
| Other commodities^6, 7^ | 5.7 | 0.1 | 0.5 | -- 0.3 | -- 1.1 | 0.5 | -- 0.1 |
| German exporters' sales markets^7, 9^ | 3.3 | 2.1 | 3.0 | 3.0 | 0.8 | − 0.1 | 0.0 |
{#par-e29748}
{#par-i8a382}
****
**[*Key aspects of the macroeconomic outlook*](#1-Key-aspects-of-the-macroeconomic-outlook)**{#par-i2i7ea}
### **3.2 Fiscal assumptions** {#tar-7}
****The forecast incorporates fiscal policy measures as soon as they are sufficiently specified and their implementation is considered likely.****{#par-i78aa9}
****Defence spending will rise significantly over the forecast horizon.** By 2028, it will increase by 1¼ percentage points relative to compared with 2024.The spending ratio is thus expected to reach around 3¼ % in 2028. From 2026 onwards, expenditure on military weapons systems, ammunition and personnel in the Federal Armed Forces, in particular, will rise steeply. In addition, transfers to Ukraine are assumed to remain at around ¼ % of per year over the entire forecast horizon.**{#par-ai74iu}
****Non-military government investment will increase markedly by 2028.** Its share of will then be just over ½ percentage point higher than in 2024. From 2026 onwards, there will be a significant rise, in particular, in construction investment in rail and road infrastructure as well as in educational institutions. In addition, there will be greater investment in digitalisation. This investment will be boosted by funds from the Infrastructure and Climate Neutrality Fund. This forecast assumes that additional non-military government investment (compared with 2024) will rise significantly less sharply than borrowing by the Infrastructure and Climate Neutrality Fund. First, central government is planning only relatively minor additional non-military investment of its own. It is creating scope for other expenditure by shifting budget items from the core budget to the Infrastructure and Climate Neutrality Fund. Second, the debt-financed grants from the Infrastructure and Climate Neutrality Fund to the federal states and the Climate Fund will probably only fund a very limited volume of additional investment. The federal states have not committed to such an increase. A large part of the financial resources in the Climate Fund will be spent on the subsidy for transmission grid charges.[\[24\]](#_ftn_root_24)**{#par-i69u65}
****The forecast takes various tax cuts and additional transfers into account as further fiscal policy measures.** The volume will amount to ¼ % of in 2026 and ¾ % of in 2027 and 2028. One focus of the measures is on easing the burden placed on firms and households by energy prices. In particular, from 2026 onwards, there will be a general government subsidy for transmission grid fees. From 2027, electricity costs in energy-intensive industries (the industrial electricity price) will be subsidised retroactively, starting from 2026. In addition, central government has extended the reduction in electricity tax for the manufacturing and agriculture sectors beyond 2025. This is flanked by temporary accelerated write-offs for profit-related taxes and a reduction in corporation tax in 2028. Besides this, cutting on food and beverage service activities to the reduced rate also plays a major role. Other tax measures such as raising the standard travel allowance will also lead to lower revenue. From 2027 onwards, additional expenditure will be incurred because the "mothers' pension" has been expanded.[\[25\]](#_ftn_root_25)**{#par-a13a3o}
{#par-ue29oi}
**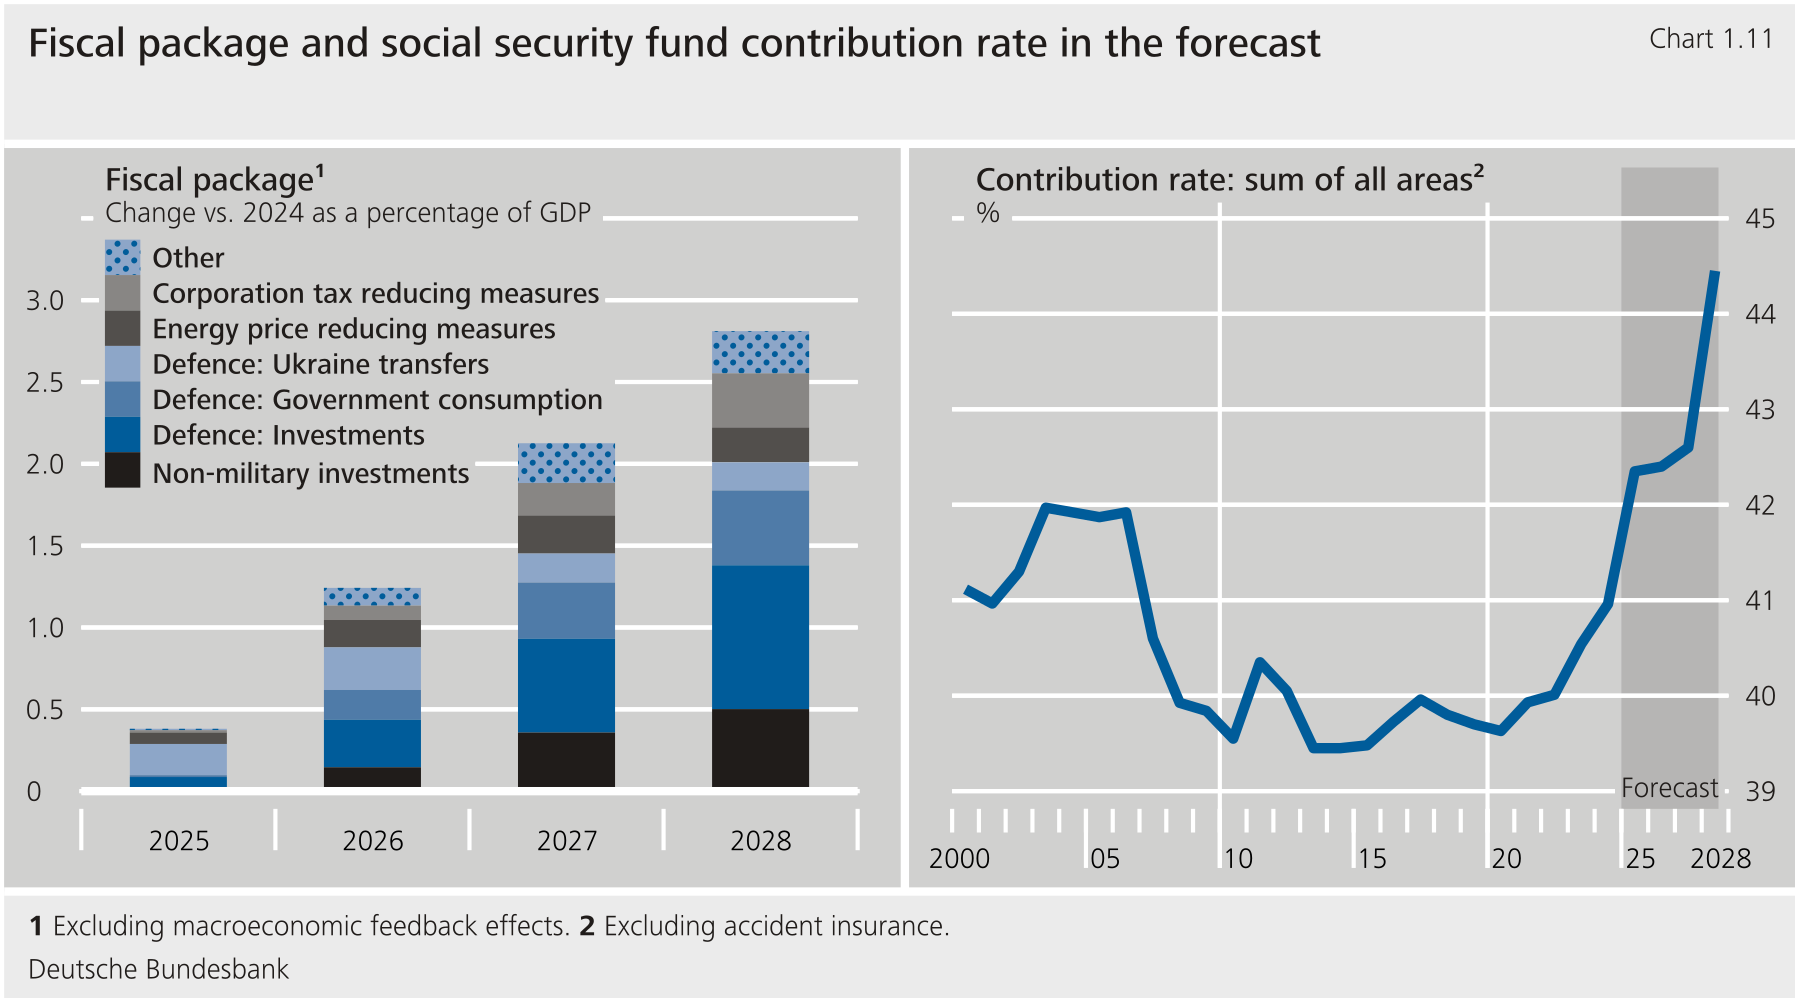**
****The overall contribution rate to the statutory social security schemes will rise by 3½ percentage points to 44½ % by 2028.** This is necessary because wages subject to compulsory insurance contributions are going up significantly more slowly than social security spending. The rapid increase in expenditure is due to demographic developments and benefit increases. The overall contribution rate is already set to grow by almost 1½ percentage points to 42.4 % in 2025 -- largely owing to higher contribution rates for the health insurance scheme. In 2028, the contribution rate for the statutory pension insurance scheme will then surge by 1.1 percentage points to 19.7 %. The pension insurance scheme will still be able to fund its growing deficits from the available reserves until 2027. In 2028, the reserve would fall far short of its minimum requirement, meaning that the contribution rate needs to rise sharply as the legal situation currently stands.[\[26\]](#_ftn_root_26) In addition, the contribution rates for the health insurance scheme will rise further, especially from 2027 onwards, and the contribution rate for the long-term care insurance scheme will increase markedly in 2028.[\[27\]](#_ftn_root_27)**{#par-ii8284}
****Further measures will have only a marginal net impact on the government budget, as burdens and relief largely offset each other.** For example, additional revenue from the progressive income tax scale will offset revenue shortfalls resulting from legislative changes such as the decision to compensate for bracket creep in 2026 and, from 2027 onwards, the assumed adjustment of income tax allowances to the inflation of the previous year. In 2026, revenue from the programme NextGenerationEU () will cease; the government then assumes that it will continue to finance the spending from its own resources. Revenue from CO₂ emissions allowances will rise gradually.[\[28\]](#_ftn_root_28)**{#par-a46i53}
**[*Key aspects of the macroeconomic outlook*](#1-Key-aspects-of-the-macroeconomic-outlook)**{#par-i9o9io}
### **3.3 Outlook for public finances** {#tar-8}
****The deficit ratio is set to fall to 2.5 % in 2025 (2024: 2.7 %).** The expenditure ratio has been rising significantly, but the revenue ratio has been increasing even more sharply, for several reasons. First, the contribution rates of the healthcare and long-term care insurance schemes have gone up substantially. Second, the payout period for tax-exempt wage components in the form of inflation compensation bonuses has ended. Third, various one-off effects have been having a positive impact on taxes, especially sharply rising revenue from withholding tax on interest income and capital gains as well as from inheritance tax. On the expenditure side, spending on pensions, healthcare and long-term care, in particular, has been rising sharply. In addition, compensation of employees has been increasing steeply.**{#par-ae9321}
****The looser fiscal stance will cause the deficit ratio to rise, initially significantly, to 3.9 % next year. Thereafter, it will increase further to 4.6 % before reaching 4.8 % in 2028.** The main reason for this is strong expenditure growth. Direct government demand will rise considerably: this concerns defence spending, non-military investment and spending by the healthcare and long-term care insurance schemes, which is primarily recorded as social transfers in kind. Monetary transfers will also increase, mainly as a result of higher pension expenditure. In addition, interest expenditure will grow, primarily on account of rising average interest rates on government debt. The revenue ratio will rise by far less than the expenditure ratio. The tax ratio will have a dampening effect here, particularly as a result of tax cuts. That said, social contribution rates will go up significantly in view of demographic pressures and expanded care benefits, above all in 2028 (for more information on tax cuts and social contribution rates, see the section "[Fiscal assumptions](#3.2-Fiscal-assumptions)").**{#par-a264u6}
{#par-i54eui}
**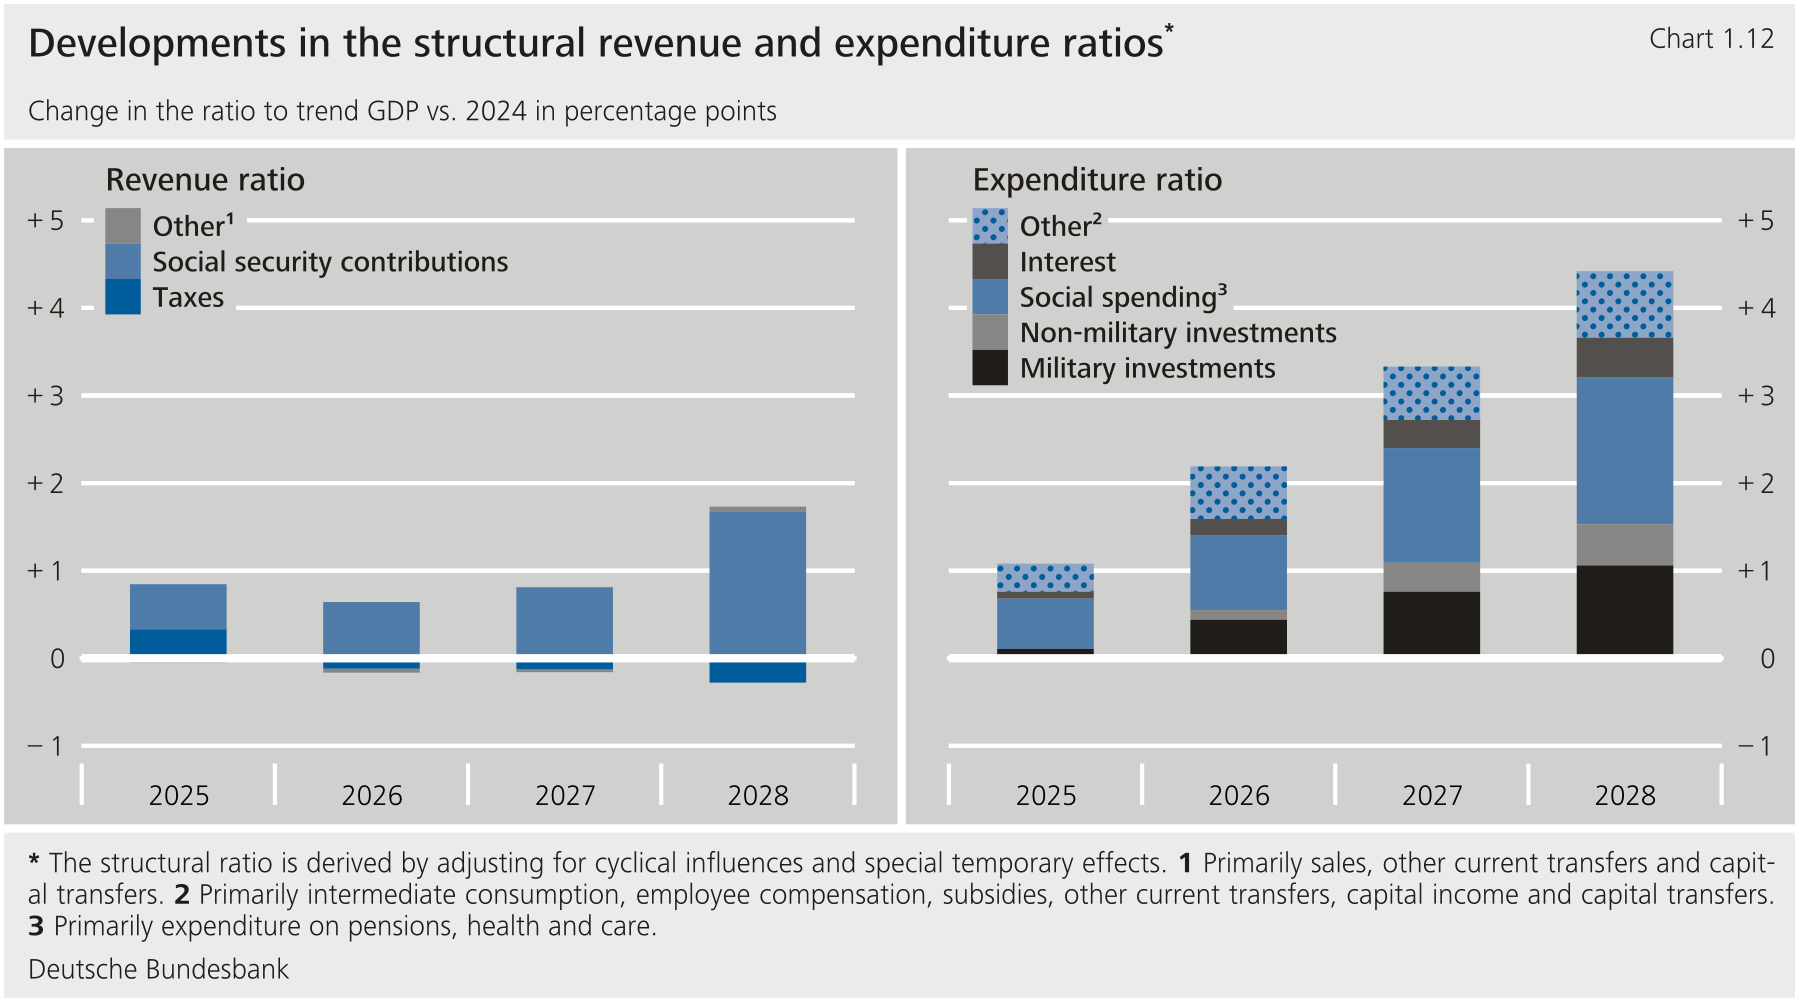**
****The structural deficit ratio will increase from just under 2 % in 2024 to 4¾ % in 2028.** This excludes temporary effects and cyclical influences. The rise will be driven by growing deficits in central government (including its off-budget entities). These are mainly the result of the expansionary fiscal stance (see the section "[Fiscal assumptions](#3.2-Fiscal-assumptions)"). According to this forecast, central government will significantly exceed its borrowing limit under the debt brake in 2028. The Federal Government has not yet announced any measures that could address this clear and compelling need for action. By contrast, state and local governments combined will reduce their deficits. This is partly due to the fact that they are expected to use state government resources from the Infrastructure and Climate Neutrality Fund primarily for investment refinancing. The state governments had expressly refused to tie these funds to additional investment. Furthermore, central government will assume part of the revenue shortfalls resulting from adopted tax cuts. Also, given their current high deficits, local governments are likely to tighten their purse strings.[\[29\]](#_ftn_root_29)**{#par-o3o72e}
****The large deficits of local authorities mean that the Maastricht debt ratio will rise from 62.2 % at the end of 2024 to 68.1 % at the end of 2028.** Social security funds experience temporary deficits. These are usually covered by reserves that are not invested in government debt instruments. They do not then raise the Maastricht debt level. In 2025 and 2026, however, central government is granting multi-year loans as an exception. It is borrowing to do so, temporarily raising the Maastricht debt level by ¼ percentage point. However, the German Maastricht debt ratio does not include the share of debt that Germany ultimately has to pay (especially for ). At the end of 2028, this will stand at around 2½ % of .[\[30\]](#_ftn_root_30)**{#par-i96oia}
**[*Key aspects of the macroeconomic outlook*](#1-Key-aspects-of-the-macroeconomic-outlook)**{#par-u99oiu}
### **3.4 Details of the short-term forecast** {#tar-9}
****Economic output is likely to see subdued growth in the 2025/26 winter half-year.** [\[31\]](#_ftn_root_31) German export-oriented industry, in particular, will remain under pressure. Encumbered by tariffs and a worsened competitive position, export activity will initially continue to weaken, albeit probably only slightly. In addition, business investment is expected to decline amid still heavily underutilised capacity. In line with this, the business climate in the manufacturing sector deteriorated between the third and fourth quarters according to the Institute. However, the Global Purchasing Managers' Index points to fairly robust output. Additionally, the slight upward trend in industrial new orders observed since last year does not appear to be fundamentally broken, despite dampening noticeably in the third quarter.[\[32\]](#_ftn_root_32) Industrial output is therefore likely to stabilise. In the construction sector, too, broadly sideways movement is expected in the short term. Although the business climate in this sector as surveyed by the Institute recovered from its setback in the third quarter, there is still no sign of any major recovery. By contrast, the services sector is likely to provide a fresh boost to the economy. Global's Purchasing Managers' Index also remained well above the expansion threshold up to the period's end. However, private consumption is likely to provide only a moderate boost. Real government demand is expected to make a positive contribution to growth in the winter half-year, too.**{#par-uei251}
****While there are initial signs of increasing government orders, the leading indicators do not yet, overall, point to a marked economic recovery in the near future by way of higher government expenditure.** In the main construction sector, for example, orders received by contracting authorities remained very sluggish until recently. A sharp rise did not come until September.[\[33\]](#_ftn_root_33) Domestic new orders in industry also remained very subdued up to September. It was only in the data released after the forecast was finalised that a spike could be observed in October, driven mainly by a large order in the other transport equipment sector, which comprises the manufacture of aircraft, ships and military vehicles.[\[34\]](#_ftn_root_34) This recent surge in orders in industry and construction is likely to be reflected in output with a certain lag, thus supporting the expectation of economic growth later in 2026. In the fourth quarter of 2025 and the first quarter of 2026, however, such an upturn will be counteracted by firms' still predominantly pessimistic business expectations. Although expectations have generally improved since the start of the year, they deteriorated somewhat recently.**{#par-euaai9}
{#par-ai9613}
**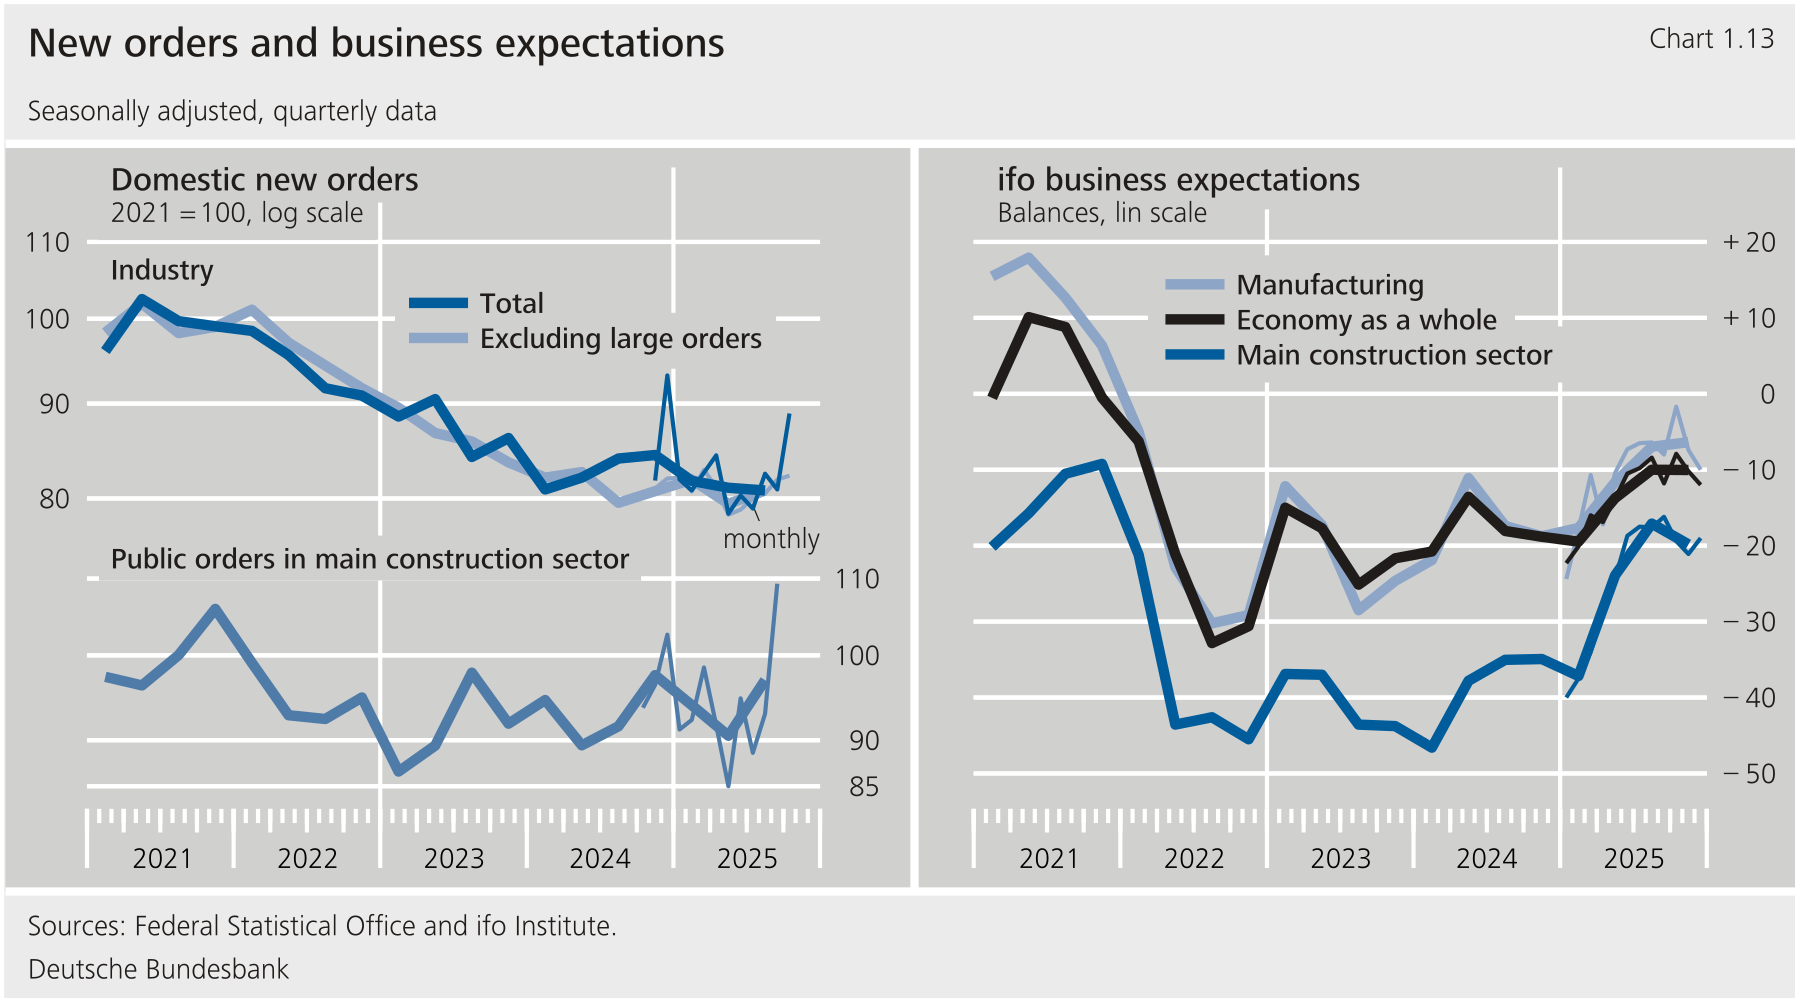**
**[*Key aspects of the macroeconomic outlook*](#1-Key-aspects-of-the-macroeconomic-outlook)**{#par-ao7e8e}
### **3.5 Forecasts of expenditure components of** {#tar-10}
****Exports are still suffering in the new trading environment and will not contribute to** **growth again until the second quarter of 2026.** Exports are likely to keep declining in the winter half-year, albeit only slightly. They will continue to be hit by the import tariffs imposed by the Administration.[\[35\]](#_ftn_root_35) In addition, the euro has continued to appreciate in recent months. This is putting pressure on German exporters' competitiveness alongside predominantly structural factors, such as increasing competition from China and worsening local business conditions, that have caused them to lose large shares in global markets in recent years.[\[36\]](#_ftn_root_36) These unfavourable conditions are also currently reflected in weak foreign demand for German export goods. Industrial new orders from abroad declined over the third quarter. Correspondingly, most of the exporters surveyed by the Institute are currently pessimistic about the future. Exports are only likely to rise again starting in the second quarter of 2026. The headwinds resulting from euro appreciation should then ease and firms will probably have adapted better to the new trading environment. Exports will then benefit from the rebound in global trade and a return to significantly more dynamic growth in foreign demand (see the section "[Assumptions regarding the international environment, exchange rates, commodity prices and interest rates](#3.1-Assumptions-regarding-the-international-environment-exchange-rates-commodity-prices-and-interest-rates)"). However, they will pick up only moderate momentum, as the structural obstacles to growth in the German export industry will remain. Some will even become more severe. In particular, the sharp rise in non-wage labour costs over the forecast horizon will weigh significantly on domestic producers' competitiveness. Government subsidies, such as the temporary reduction in the price of industrial electricity, will not radically improve this situation. Against this backdrop, export growth will continue to lag behind sales market growth over the remainder of the forecast horizon.**{#par-eeu28i}
{#par-o376uo}
**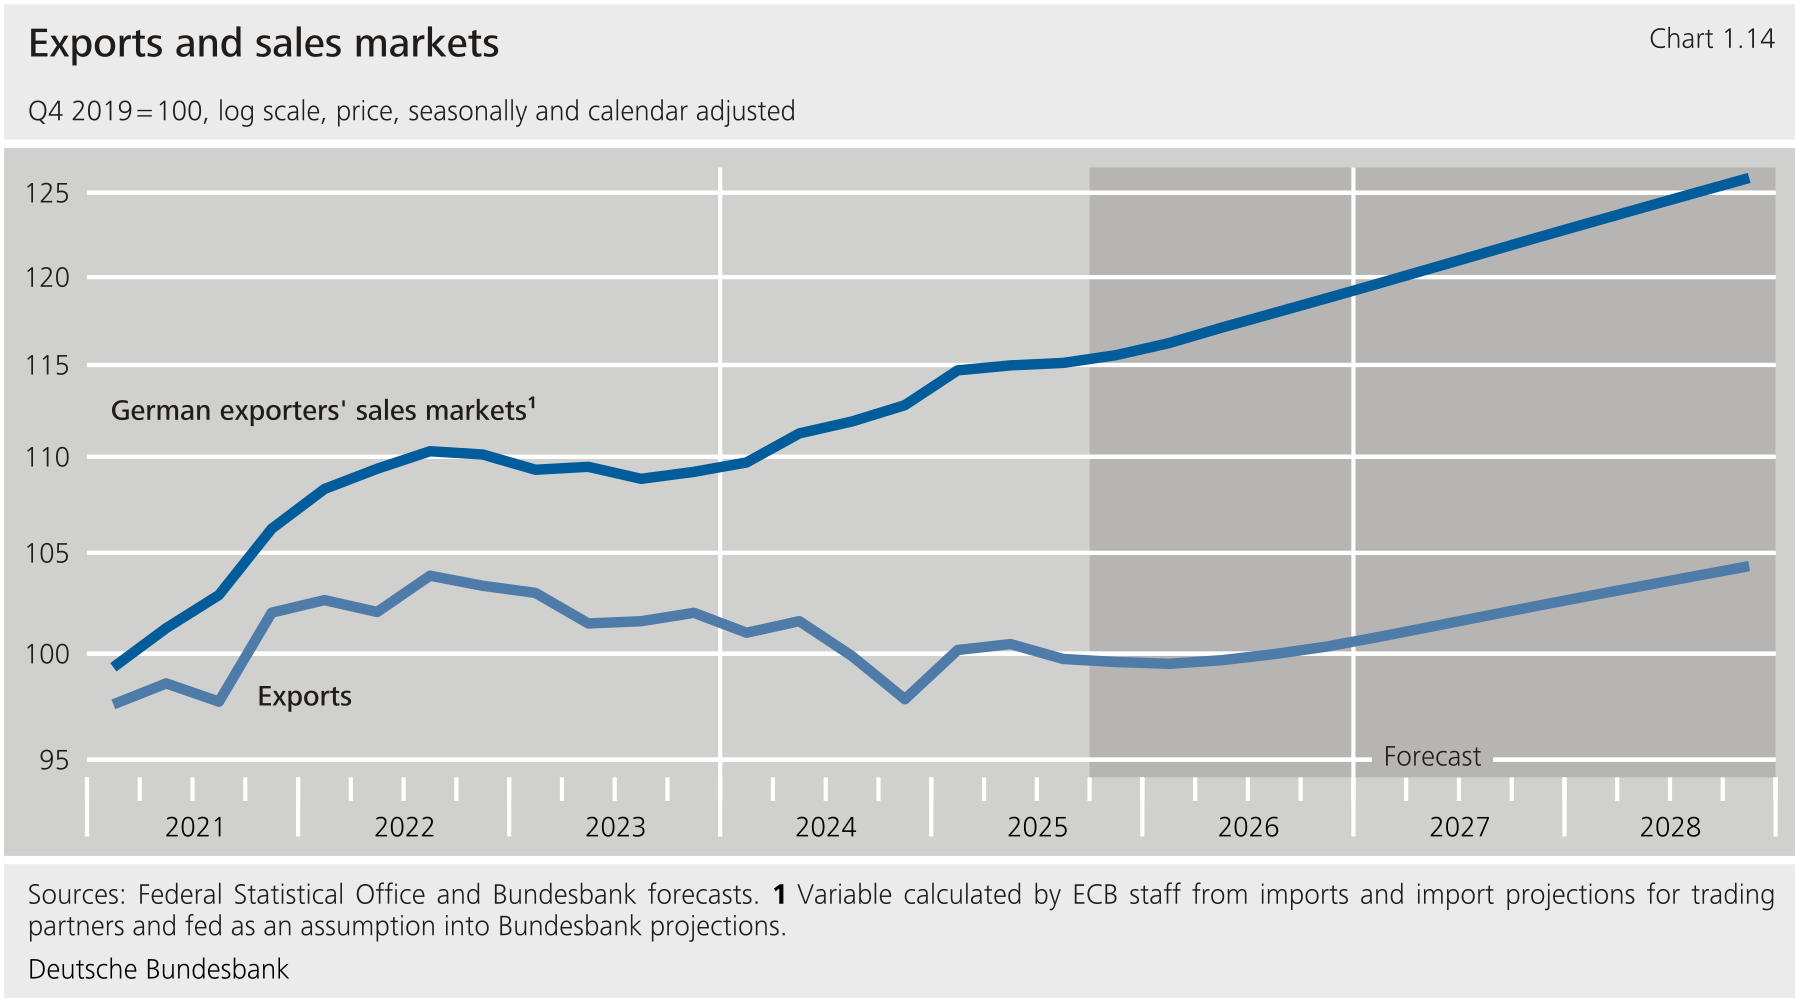**
****Business investment is being throttled by a difficult investment environment and is only slowly gaining limited momentum.** The underlying conditions for business investment are currently unfavourable: capacity in the manufacturing sector is significantly underutilised and private domestic demand for capital goods is correspondingly weak. Past uncertainty shocks are also likely to continue having an impact, albeit to a small extent.[\[37\]](#_ftn_root_37) As a result, the majority of the capital goods producers surveyed by the Institute assess their current business situation as poor. Against this backdrop, business investment is likely to decrease somewhat further in the current winter half-year. However, the business expectations of capital goods producers suggest that the reluctance to invest will gradually fade next year. Although expectations are still predominantly pessimistic, they have improved of late and are currently at their highest level in just over three years. The Federal Government's expenditure programmes could be having an effect here to some extent. In addition, the utilisation rate in the manufacturing sector is expected to increase further next year as export activity gradually rebounds, supporting investment propensity. Uncertainty effects are also likely to slowly subside completely. Business investment will therefore return to an expansion path in mid-2026. However, it will not boost growth noticeably until 2027. Moreover, the pace of growth will remain subdued overall and is already losing momentum by the end of the forecast horizon. This is because interest rates on loans to enterprises are at that point likely to go up somewhat in line with the expected rise in money and capital market rates. In addition, the competitive environment will remain difficult for German industry. Reducing the profit-related tax burden (more generous depreciation options and lower corporation tax rate) and energy cost-cutting measures are expected to improve investment conditions. However, increasing demographic pressures are working in the opposite direction -- not least in the form of comparatively high wage pressures and sharply rising non-wage labour costs.**{#par-ooo81a}
{#par-ee1455}
**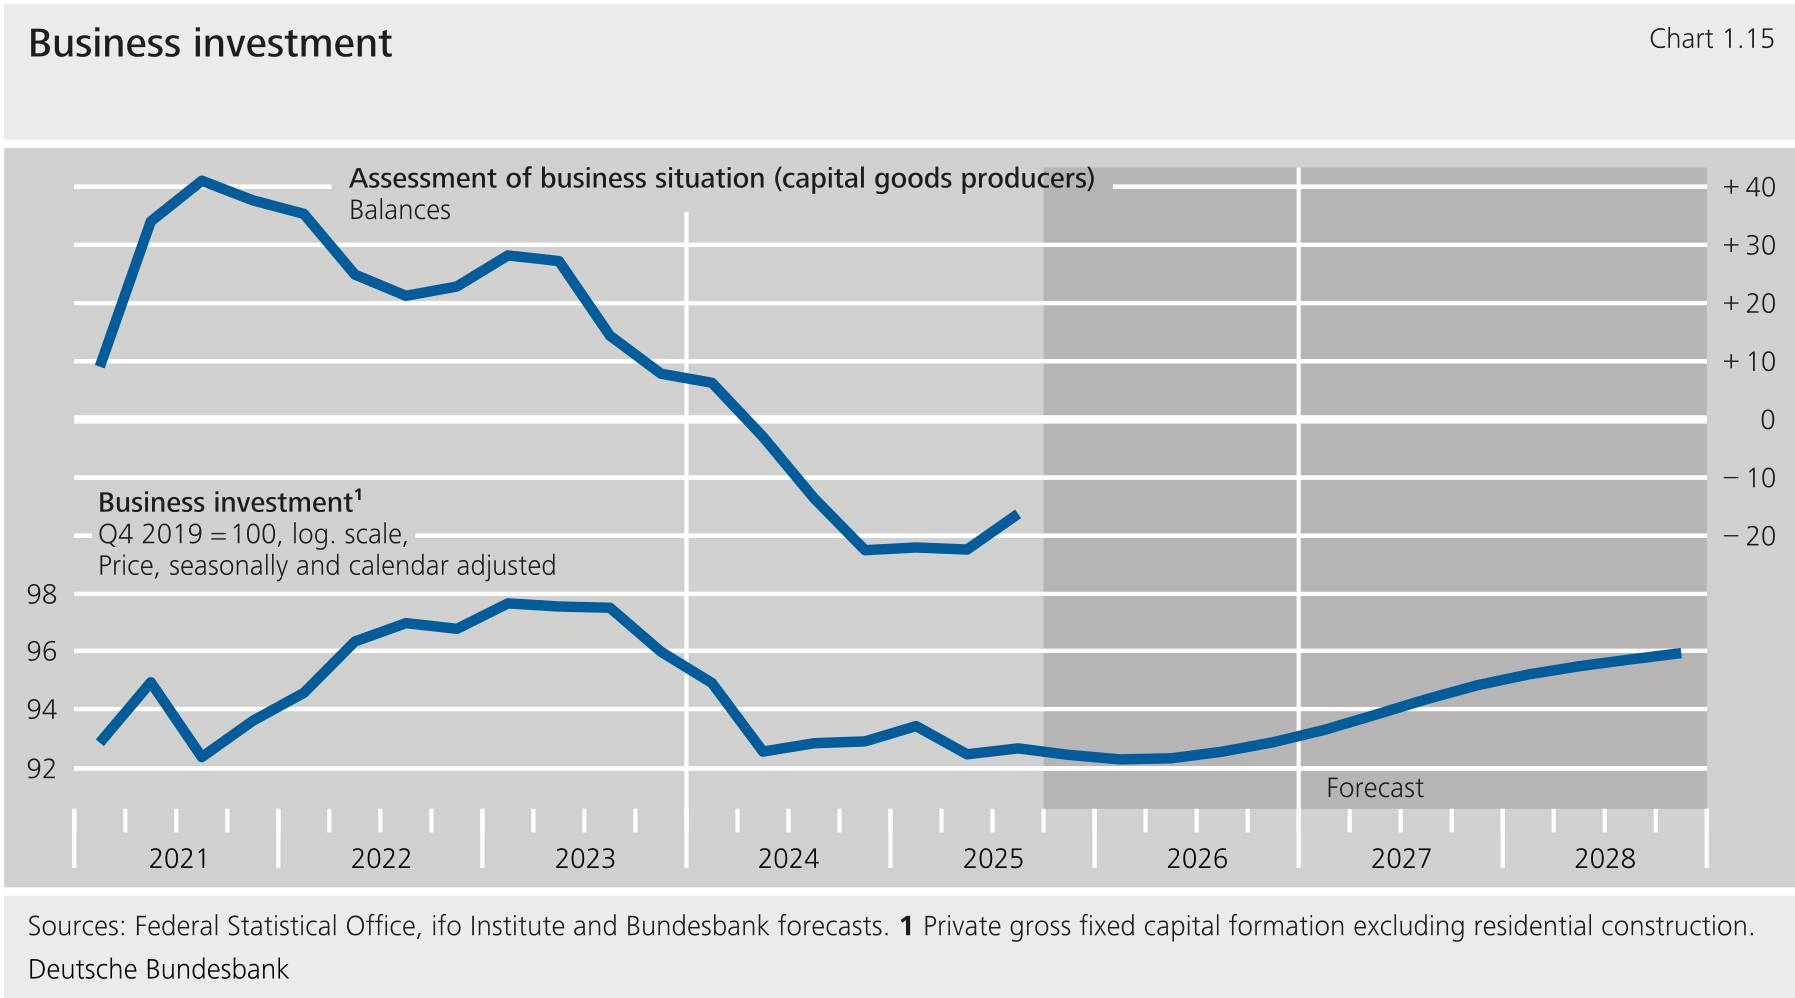**
****Private consumption will make a robust contribution to economic growth over the entire forecast horizon, but will lose some momentum in 2028.** According to the revised national accounts data, private consumption in the first quarter was at a significantly higher level than assumed in the June Forecast for Germany. Starting from this point, it was then more sluggish than expected in the last summer half-year. In the third quarter, in particular, consumption declined significantly despite surprisingly strong wage growth, and the previously fairly low saving rate rose markedly. There is likely to be some countermovement in the current winter half-year, and private consumption should rebound somewhat. Some indicators remain weak, such as declining real sales and greater pessimism in the retail sector. But there are rays of hope, too. First, motor vehicle registrations have risen significantly in recent times, and second, the consumer climate indicator, while still negative, is trending upwards. The saving rate is currently only slightly above its pre-pandemic level and is expected to gradually return towards that level. Aside from this, private consumption is expected to increase in line with real disposable income over the remainder of the forecast horizon. The general trend for this is a steep upward trajectory, as wages will go up faster than consumer prices. In addition, the economic recovery will boost the labour market. In 2028, however, private consumption will lose some momentum, as higher social contribution rates will lower disposable income and also slow down net wage growth.**{#par-aa7198}
{#par-ie4835}
**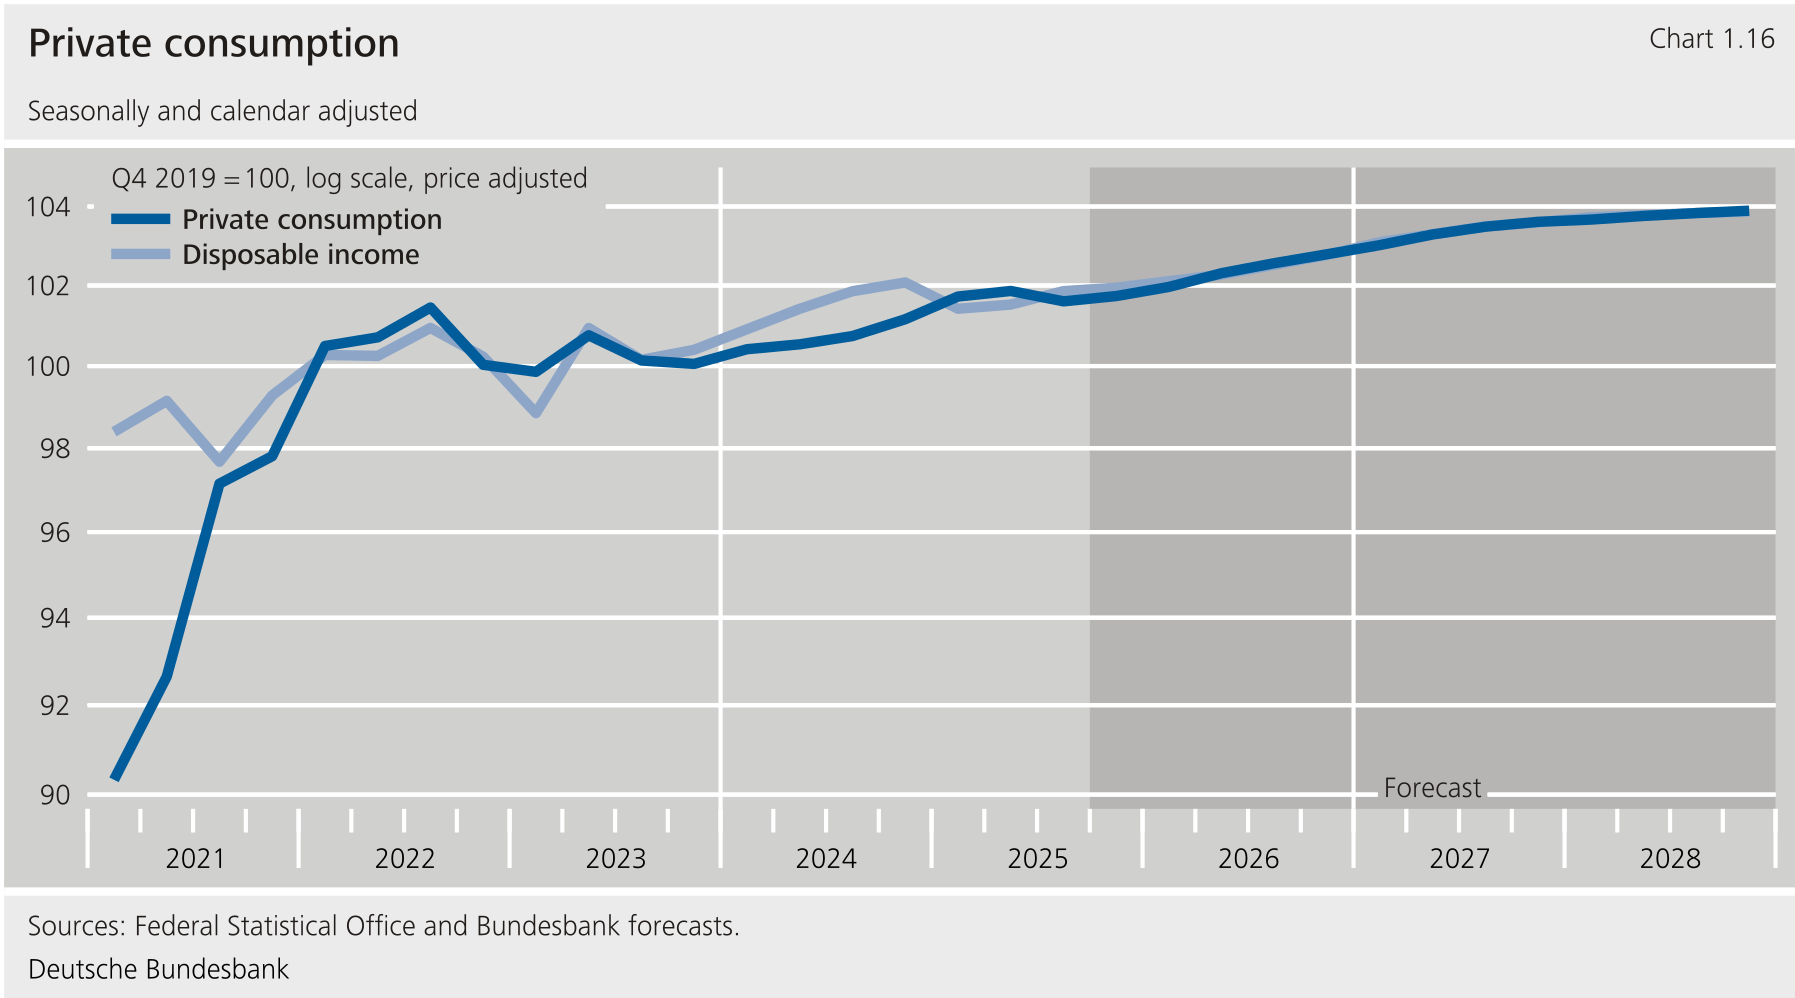**
****Residential investment will recover only moderately over the forecast horizon and later than previously expected.** The recovery in private residential construction, which was still expected in June, did not materialise in the summer half-year. Instead, residential investment continued to decline. New orders and building permit numbers, which were previously rising, remained weak over the third quarter. However, they picked up again markedly in September, and growing demand for housing loans in the third quarter also continues to point to a gradual recovery. Ifo business expectations in housing construction have been improving for three quarters already. Despite this improvement, however, half of housing construction firms were still reporting a lack of orders when most recently surveyed, according to . The recent rise in financing costs could play a role here. Overall, demand still appears too weak to trigger a noteworthy rise in residential construction activity in the short term. Against this backdrop, this period of weakness is likely to continue in the fourth quarter. Generally speaking, though, a recovery is still expected, and from 2026 onwards, positive demand signals should increasingly be reflected in increasing housing investment. The recovery over the forecast horizon will be supported by rising real income and a robust labour market. The continued high demand for housing and modernisation is likely to support growth. The measures taken by the Federal Government as part of its "construction turbo" legislation to simplify permits and speed up procedures should also have a beneficial effect. In 2028, however, the increase in housing investment will slow down. This is due, first, to the assumed rise in long-term interest rates on loans for house purchase and, second, to somewhat weaker income growth among households.**{#par-u433eu}
{#par-o85i46}
**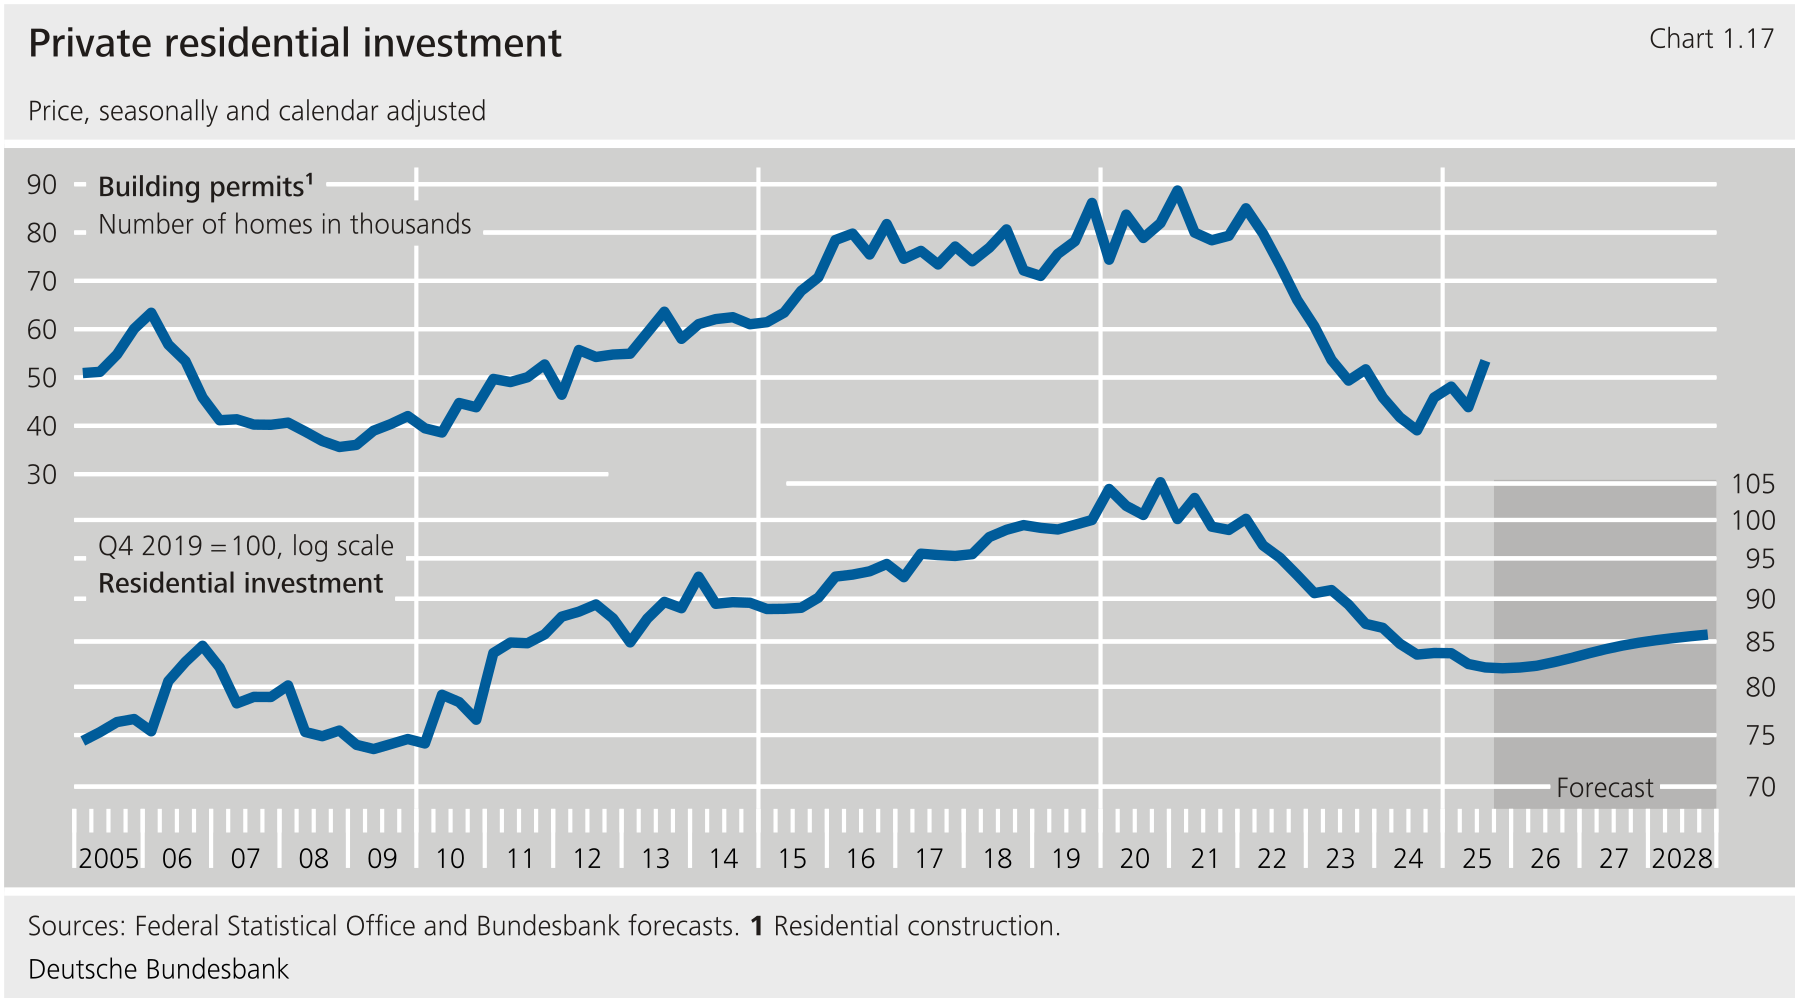**
****Real government demand will rise substantially up to 2028.** This is because of a significant increase in expenditure on defence, non-military investment and social transfers in kind. In 2025, government consumption has been rising primarily due to a further increase in non-cash benefits for healthcare and long-term care as well as a sharp hike in compensation for employees. This development is being curbed by government construction investment, which is growing only moderately in line with past intra-year developments. From 2026 onwards, spending on defence and non-military investment will rise significantly overall. Higher defence spending will lead primarily to greater machine and equipment investment in military weapons systems and increased government consumption as a result of higher personnel expenditure. Non-military investment growth will be on a far smaller scale; it will mainly involve infrastructure and digitalisation projects and fall under the categories of investment in machinery and equipment and construction as well as in other assets (see the section "[Fiscal assumptions](#3.2-Fiscal-assumptions)"). In addition, demographic developments and expanded care benefits will continue to drive up non-cash benefits for healthcare and long-term care.**{#par-e79732}
****Real imports will rise significantly over the forecast horizon and contribute to a marked decline in the current account surplus.** Real imports rose unusually steeply in the first half of the year. In addition to the appreciation of the euro and expanded inventories, frontloading effects resulting from feared countermeasures to tariffs may also have played a role here. Imports lost considerable momentum in the third quarter. They are set to expand moderately in the current winter half-year. However, they will accelerate considerably again from the second quarter of 2026. This is due, first, to the strengthening of demand among households and firms. Second, government demand will rise sharply. In particular, rising government investment in machinery and equipment will be accompanied by increased imports. At the same time, export growth will be comparatively subdued. As the terms of trade will improve only slightly at the same time, the trade balance (as a share of nominal ) will fall significantly in 2025 and 2026 and will continue to decline somewhat thereafter. The current account surplus will also decrease considerably over the forecast horizon, from an expected 4.7 % in the current year to 3.2 % in 2028.**{#par-e886eu}
**[*Key aspects of the macroeconomic outlook*](#1-Key-aspects-of-the-macroeconomic-outlook)**{#par-e92u43}
### **3.6 The short-term forecast for the labour market** {#tar-11}
****The labour market is currently characterised by job reductions and the simultaneous shortage of skilled workers, driven by strong structural change in conjunction with unfavourable demographics.** The decline in employment expected for the summer half-year in the June Forecast for Germany was milder than expected.[\[38\]](#_ftn_root_38) Despite the notable reduction in jobs -- especially in the manufacturing sector but also in trade -- many firms are hesitant to fully adjust their headcount to the tense economic situation. This leads to low labour productivity and subdued working hours. This is also true, for example, of the construction sector with its many bottleneck occupations, where headcounts have already stabilised over the course of the year in anticipation of infrastructure renewal projects. Therefore, there are large internal reserves that can improve labour productivity and increase working hours in the short term as the economy begins to recover. The relatively stable trajectory of total employment so far is largely due to the high labour demand in public services, specifically the area of healthcare and long-term care above all. Total employment is likely to decline marginally in the current winter half-year. Leading indicators of employment back up this view, with the level of new job vacancies being exceptionally low. According to the employment barometer, the employment plans of the industrial sector for the next three months remain deep in contractionary territory. However, the broader employment barometer of the , which also includes non-commercial services such as health, education and public administration, is holding up much better. It does not foresee any sharp decline in employment in the coming months in aggregate terms. However, unemployment is likely to start falling soon as the labour supply declines. This is also indicated by the unemployment barometer, which has risen slightly above the neutral threshold over the past six months.**{#par-e39829}
**[*Key aspects of the macroeconomic outlook*](#1-Key-aspects-of-the-macroeconomic-outlook)**{#par-o47a83}
### **3.7 The forecast for negotiated wages in this year and the next** {#tar-12}
****Negotiated wage growth in 2025 is significantly weaker than in the previous two years.** New wage agreements since the June forecast have been similar to those expected at the time. In addition to weak economic activity and lower price increases compared with previous years, the discontinuation of inflation compensation bonuses is dampening annual average wage growth.[\[39\]](#_ftn_root_39) Trade unions' wage demands have declined markedly since the peak of inflation, along with the percentage of their demands they achieved. On average over the current year, the expected increase in negotiated wages is 2.5 %. As economic activity and the labour market are improving only gradually and inflation is on a downward trend, new deals should still be moderate overall next year, especially in industry. Wage agreements with higher wage increases are likely to appear only with a time lag. In 2026, however, the dampening base effect of inflation compensation bonuses will no longer apply. The permanent incremental increases from older collective wage agreements will then have a greater impact on wage growth, and the rate will thus rise temporarily to 3.0 %.**{#par-u3715a}
**[*Key aspects of the macroeconomic outlook*](#1-Key-aspects-of-the-macroeconomic-outlook)**{#par-i9e112}
### **3.8 Inflation forecast up to 2026** {#tar-13}
****The inflation rate rose in November, partly due to a base effect.** Consumer price inflation, as measured by the , stood at 2.6 % in November, 0.4 percentage point above the rate expected in the June Forecast for Germany. This was mainly due to unexpectedly sharp rises in prices for services and industrial products excluding energy. This was caused by both the volatile components and the surprisingly large rise in actual earnings. By contrast, energy prices unexpectedly continued their descent in November owing to falling gas prices. Food price inflation was also somewhat below the forecast, as prices for processed foods, especially dairy products, fell.**{#par-i322u8}
****Over the next few months, the** **rate is expected to fall to slightly above 2 % and then fluctuate around this level.** Energy prices are expected to fall again next year. The reduced electricity price due to lower transmission grid fees, the abolition of the natural gas storage levy and the assumed decline in prices in the energy commodity markets are forecast to overshadow the rise in the carbon price at the beginning of the year.[\[40\]](#_ftn_root_40) The dynamics of services prices should decline somewhat compared with the previous year, but remain elevated. Prices for government services are likely to rise, mainly at the beginning of the year, owing to the price increase for the Deutschlandticket from €58 to €63. By contrast, the reduction in on food and beverage service activities, which is also planned for January 2026, is likely to be passed on to consumers only to a limited extent.[\[41\]](#_ftn_root_41) On top of this, rents are still expected to rise above average by historical standards next year, as existing rents are only slowly adjusting to the cost surges of recent years. Overall, however, services inflation is likely to decline next year owing to somewhat easing wage cost pressures. Prices for non-energy industrial goods are likely to rise less strongly again next year than the historical average. Here, the still weak economic activity, the appreciation of the euro and declining import prices lead to lower price pressures.[\[42\]](#_ftn_root_42) Food price inflation is expected to be similar to this year as, although retail wages are likely to rise somewhat more strongly, agricultural producer prices are assumed to have declined.**{#par-e49395}
****From the beginning of next year onwards, it should be noted that actual inflation rates may also deviate from the forecast because the** **classification is being changed in all euro area countries.** [\[43\]](#_ftn_root_43)The December forecast is based on the previous classification. The changeover will not affect energy price developments and the overall . However, for food, non-energy industrial goods and services, there may be differences in historical index trajectories that -- had they been known at the time the forecast was finalised -- could also have had an impact on the forecast. In addition, new product groups are being taken into account, including gambling, which may have dynamics that deviate from the overall rate and can thus influence the results.**{#par-o9o845}
****Compared with the June forecast, the inflation rate is revised markedly upwards in 2026.** At 2.2 %, the forecast for the inflation rate for 2026 is revised upwards significantly compared with the June forecast. One reason for this is that energy prices have fallen less sharply as originally expected because, in contrast to the assumption made in the June forecast, the electricity tax cuts for households announced in the coalition agreement have not been made; moreover, grid charges have received far fewer subsidies. A second reason is that the core rate excluding the volatile energy and food components is also likely to be significantly higher than originally expected, at 2.4 %. This is mainly due to the surprisingly strong dynamics of industrial goods and services prices over the past few months.**{#par-au3u32}
{#par-eie58o}
**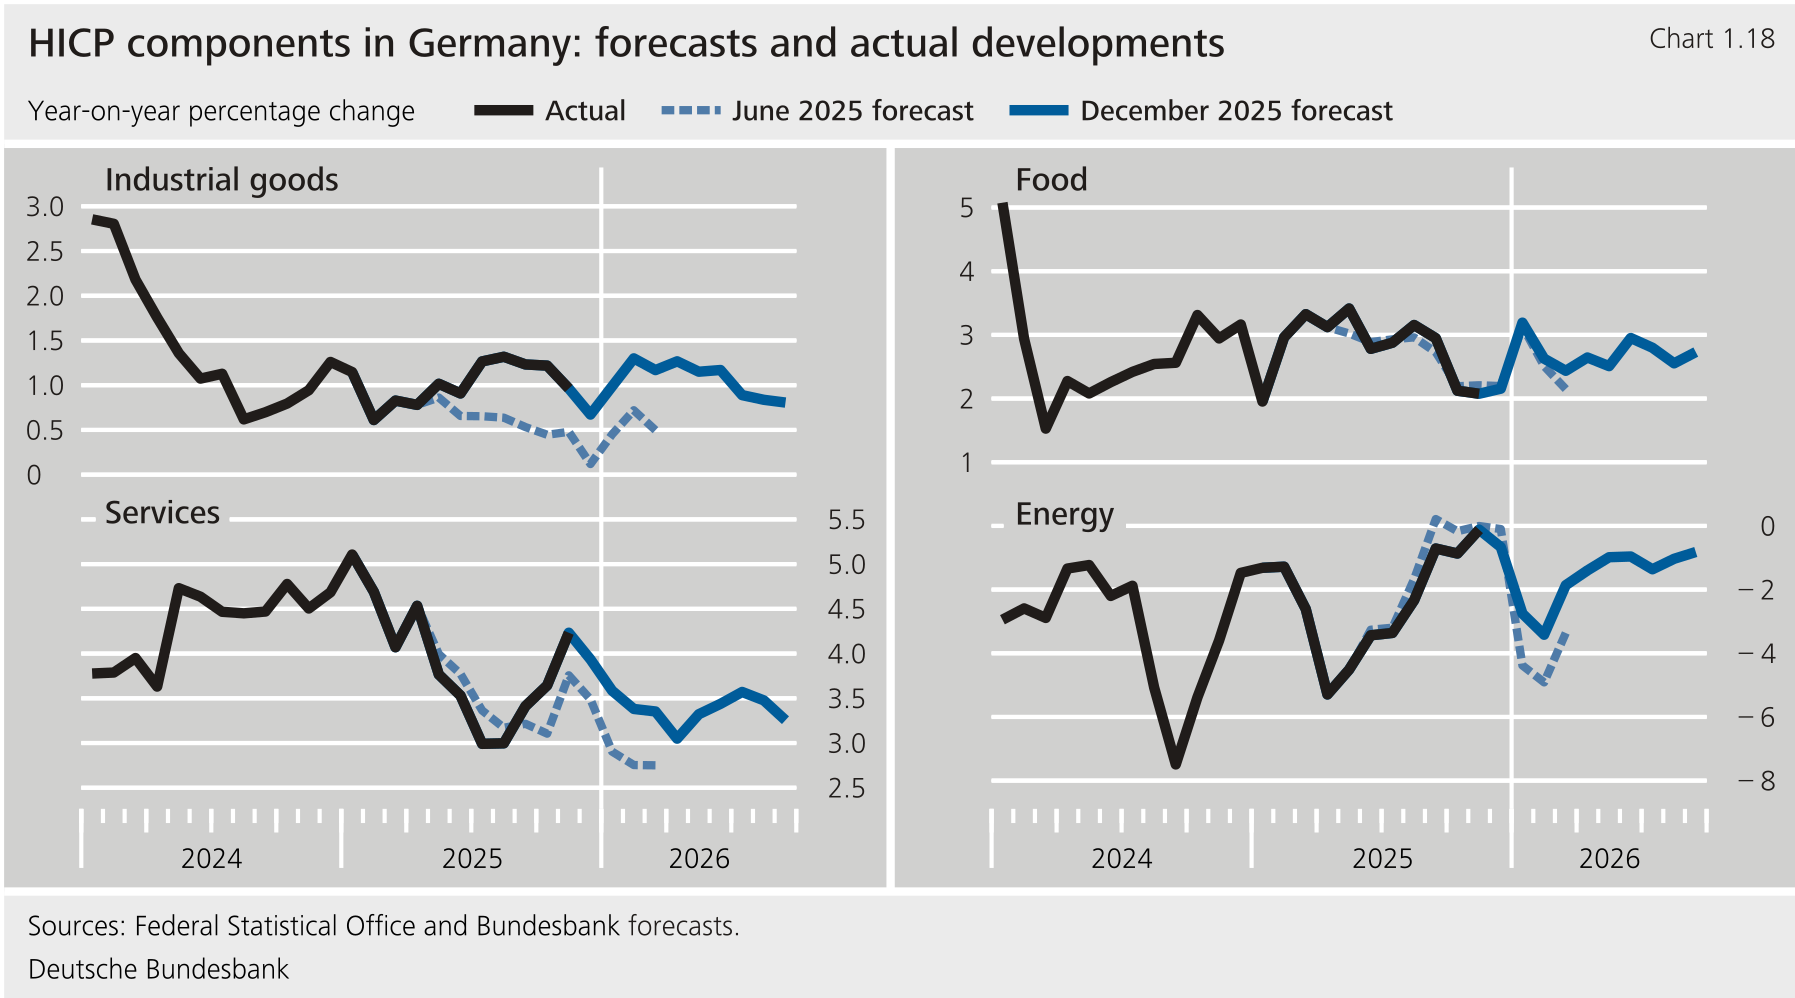**
**[*Key aspects of the macroeconomic outlook*](#1-Key-aspects-of-the-macroeconomic-outlook)**{#par-i323i2}
**Key figures of the macroeconomic forecast** {#tar-14}
-------------------------------------------------------
{#par-e9662i}{#par-e8795e}{#par-i6299a}{#par-e689ea}{#par-i55i59}{#par-aiu1u1}{#par-o42a91}{#par-eiii75}{#par-o69626}{#par-o3e559}{#par-i917uo}{#par-oo5916}{#par-i29782}{#par-i67eau}{#par-i9u7oi}{#par-o7i6ee}{#par-ae5a91}{#par-o9a2e9}{#par-e4725a}{#par-o63e33}{#par-ea79ua}{#par-eiu18a}{#par-oe8ua8}{#par-a41uo8}{#par-e72i36}{#par-eua33i}{#par-ia6554}{#par-ei6u92}{#par-uaoo6u}{#par-o966u7}{#par-i8ae3o}{#par-aiioo3}
| **Table 1.6: Key figures of the macroeconomic forecast** Year-on-year percentage change, calendar adjusted^1^ |||||
| Item | **2025^2^** | **2026** | **2027** | **2028** |
|---------------------------------------------|-------------|----------|----------|----------|
| (real) | 0.2 | 0.6 | 1.3 | 1.1 |
| (real, unadjusted) | 0.1 | 0.9 | 1.4 | 0.9 |
| Components of real |||||
| Private consumption | 1.0 | 0.7 | 0.9 | 0.4 |
| Memo item: Saving ratio | 10.5 | 10.5 | 10.5 | 10.5 |
| Government consumption | 2.3 | 2.2 | 1.7 | 2.3 |
| Gross fixed capital formation | -- 0.6 | 2.1 | 3.8 | 3.1 |
| Business investment^3^ | -- 0.6 | -- 0.3 | 1.7 | 1.6 |
| Private housing construction investment | -- 2.4 | 0.0 | 2.1 | 1.4 |
| Public sector gross fixed capital formation | 3.3 | 14.4 | 12.8 | 9.7 |
| Exports | -- 0.1 | -- 0.1 | 1.7 | 2.0 |
| Imports | 3.6 | 2.0 | 2.7 | 2.7 |
| Memo item: Current account balance^4^ | 4.7 | 3.7 | 3.4 | 3.2 |
| Contributions to growth**^5^** |||||
| Domestic final demand | 0.9 | 1.2 | 1.6 | 1.4 |
| Changes in inventories | 0.7 | 0.2 | 0.0 | 0.0 |
| Exports | 0.0 | 0.0 | 0.7 | 0.8 |
| Imports | -- 1.4 | -- 0.8 | -- 1.0 | -- 1.0 |
| Labour market |||||
| Total hours worked^6^ | -- 0.1 | 0.2 | 0.6 | 0.3 |
| Employed persons^6^ | 0.0 | -- 0.1 | 0.2 | 0.0 |
| Unemployed persons^7^ | 2.9 | 2.9 | 2.7 | 2.5 |
| Unemployment rate^8^ | 6.3 | 6.2 | 5.7 | 5.4 |
| Memo item: unemployment rate^9^ | 3.7 | 3.7 | 3.4 | 3.1 |
| Wages and wage costs |||||
| Negotiated wages^10^ | 2.5 | 3.0 | 2.7 | 2.7 |
| Gross wages and salaries per employee | 4.7 | 4.0 | 3.1 | 3.0 |
| Compensation per employee | 5.1 | 4.0 | 3.1 | 3.6 |
| Real per employed person | 0.3 | 0.7 | 1.1 | 1.1 |
| Unit labour costs^11^ | 4.8 | 3.3 | 2.0 | 2.5 |
| Memo item: deflator | 2.8 | 2.6 | 2.4 | 2.3 |
| Consumer prices^12^ | 2.3 | 2.2 | 2.1 | 1.9 |
| Excluding energy | 2.8 | 2.5 | 2.3 | 2.3 |
| Energy component | -- 2.2 | -- 1.6 | -- 0.5 | -- 2.6 |
| Excluding energy and food | 2.8 | 2.4 | 2.1 | 2.2 |
| Food component | 2.7 | 2.9 | 3.0 | 2.7 |
{#par-a94118}{#par-o5i417}{#par-ae1ai5}{#par-a62543}{#par-u8a167}{#par-a67558}{#par-uaoo69}{#par-o3u89o}{#par-e84133}{#par-o63ia1}{#par-i26828}{#par-o9ou84}{#par-a67oae}{#par-u6iae1}{#par-a3941a}{#par-o36514}{#par-u66o63}{#par-a8ioe1}{#par-u5e6u2}{#par-i1ee7u}{#par-u91121}{#par-ie8745}{#par-a14u1e}{#par-e3u44o}{#par-u184i4}{#par-o7176e}{#par-u5u27u}{#par-ioa976}{#par-ai5518}{#par-u9ee96}{#par-oe8u42}{#par-e8724a}{#par-i437o2}
| **Table 1.7: Key figures of the macroeconomic forecast -- non-calendar adjusted** Year-on-year percentage change |||||
| Item | **2025^1^** | **2026** | **2027** | **2028** |
|---------------------------------------------|-------------|----------|----------|----------|
| (real) | 0.1 | 0.9 | 1.4 | 0.9 |
| (real, unadjusted) | 0.2 | 0.6 | 1.3 | 1.1 |
| Components of real |||||
| Private consumption | 0.9 | 0.8 | 1.1 | 0.3 |
| Memo item: Saving ratio | 10.5 | 10.5 | 10.5 | 10.5 |
| Government consumption | 2.3 | 2.2 | 1.7 | 2.3 |
| Gross fixed capital formation | -- 0.7 | 2.8 | 4.0 | 2.6 |
| Business investment^2^ | -- 0.7 | 0.2 | 2.5 | 0.7 |
| Private housing construction investment | -- 2.6 | 0.6 | 2.5 | 0.8 |
| Public sector gross fixed capital formation | 3.2 | 15.6 | 12.3 | 9.7 |
| Exports | -- 0.2 | 0.5 | 2.0 | 1.4 |
| Imports | 3.5 | 2.5 | 2.9 | 2.3 |
| Memo item: Current account balance^3^ | 4.7 | 3.7 | 3.5 | 3.2 |
| Contributions to growth^4^ |||||
| Domestic final demand | 0.8 | 1.5 | 1.8 | 1.2 |
| Changes in inventories | 0.7 | 0.1 | − 0.1 | 0.0 |
| Exports | -- 0.1 | 0.2 | 0.8 | 0.6 |
| Imports | -- 1.3 | -- 0.9 | -- 1.1 | -- 0.9 |
| Labour market |||||
| Total hours worked^5^ | -- 0.2 | 0.6 | 0.7 | -- 0.1 |
| Employed persons^5^ | 0.0 | -- 0.1 | 0.2 | 0.0 |
| Unemployed persons^6^ | 2.9 | 2.9 | 2.7 | 2.5 |
| Unemployment rate^7^ | 6.3 | 6.2 | 5.7 | 5.4 |
| Memo item: unemployment rate^8^ | 3.7 | 3.7 | 3.4 | 3.1 |
| Wages and wage costs |||||
| Negotiated wages^9^ | 2.5 | 3.0 | 2.7 | 2.7 |
| Gross wages and salaries per employee | 4.7 | 4.0 | 3.1 | 3.0 |
| Compensation per employee | 5.1 | 3.9 | 3.1 | 3.6 |
| Real per employed person | 0.2 | 0.9 | 1.2 | 0.9 |
| Unit labour costs^10^ | 4.9 | 3.0 | 1.8 | 2.7 |
| Memo item: deflator | 2.8 | 2.6 | 2.4 | 2.3 |
| Consumer prices^11^ | 2.3 | 2.2 | 2.1 | 1.9 |
| Excluding energy | 2.8 | 2.5 | 2.3 | 2.3 |
| Energy component | -- 2.2 | -- 1.6 | -- 0.5 | -- 2.6 |
| Excluding energy and food | 2.8 | 2.4 | 2.1 | 2.2 |
| Food component | 2.7 | 2.9 | 3.0 | 2.7 |
{#par-i42a68}
**List of references** {#tar-15}
--------------------------------
**Becker, J. and J.P. Dunne, (2023), [Military Spending Composition and Economic Growth, Defence and Peace Economics](https://www.tandfonline.com/doi/full/10.1080/10242694.2021.2003530), Vol. 34, No 3, pp. 259‑271.**{#par-o6o3u4}
**Benzarti, Y. and D. Carloni (2019), [Who really benefits from consumption tax cuts?Evidence from a large reform in France](https://www.aeaweb.org/articles?id=10.1257/pol.20170504), American Economic Journal: Economic Policy, Vol. 11(1), pp. 38‑63.**{#par-aui34u}
**Boston Consulting Group (2024), [Reshaping British Infrastructure: Global Lessons to Improve Project Delivery](https://www.bcg.com/united-kingdom/centre-for-growth/insights/reshaping-british-infrastructure-global-lessons-to-improve-project-delivery).**{#par-u58635}
**Bom, P. R. D. and J. E. Ligthart (2014), [What Have We Learned From Three Decades of Research on the Productivity of Public Capital?](https://doi.org/10.1111/joes.12037), Journal of Economic Surveys, Vol. 28, No. 5, pp. 889‑916.**{#par-ue7667}
**Busch, S. (2025), [The Supreme Court might slow Trump's strategy. But he still has other tariff options](https://www.atlanticcouncil.org/blogs/new-atlanticist/the-supreme-court-might-slow-trumps-strategy-but-he-still-has-other-tariff-options/), Atlantic Council, New Atlanticist, article of 7 November 2025.**{#par-i79u26}
**Congressional Budget Office (2021), [Effects of Physical Infrastructure Spending on the Economy and the Budget Under Two Illustrative Scenarios](https://www.cbo.gov/system/files/2021-08/57327-Infrastructure.pdf).**{#par-iu51ua}
**Congressional Research Service (2025), [Court Decisions Regarding Tariffs Imposed Under the International Emergency Economic Powers Act ()](https://www.congress.gov/crs-product/LSB11332), Legal Sidebar, 15 September 2025.**{#par-iie7o9}
**Deutsche Bundesbank (2019), [Outlook for the German economy -- macroeconomic projections for 2020 and 2021 and an outlook for 2022](https://www.bundesbank.de/content/818798), Monthly Report, December 2019, pp. 29‑33.**{#par-e7u812}
**Deutsche Bundesbank (2023), [Falling inflation, but not yet time to sound the all-clear -- outlook for the German economy up to 2026](https://www.bundesbank.de/content/920352), Monthly Report, December 2023, p. 34.**{#par-ia75oi}
**Deutsche Bundesbank (2024), [Energy efficiency improvements: implications for carbon emissions and economic output in Germany](https://publikationen.bundesbank.de/content/929588), Monthly Report, April 2024.**{#par-e5e436}
**Deutsche Bundesbank (2025a), [The German economy](https://publikationen.bundesbank.de/content/957532), Monthly Report, May 2025.**{#par-e19185}
**Deutsche Bundesbank (2025b), [Forecast for Germany: US tariffs initially weigh on economic growth; fiscal policy provides impetus with a delay](https://publikationen.bundesbank.de/content/958718), Monthly Report, June 2025.**{#par-oe3282}
**Deutsche Bundesbank (2025c), [What's behind the sustained decline in German export market shares?](https://publikationen.bundesbank.de/content/960442), Monthly Report, July 2025.**{#par-i81o14}
**Deutsche Bundesbank (2025d), [The German economy](https://publikationen.bundesbank.de/content/962890), The German economy, Monthly Report, August 2025.**{#par-ieeu25}
**Deutsche Bundesbank (2025e), [Global and European setting](https://publikationen.bundesbank.de/content/962882), Monthly Report, August 2025.**{#par-a71ie9}
**Deutsche Bundesbank (2025f), [Public finances](https://publikationen.bundesbank.de/content/962900), Monthly Report, August 2025.**{#par-eio769}
**Deutsche Bundesbank (2025g), [State government finances in 2024: situation worsens, large deficit for local governments](https://publikationen.bundesbank.de/content/968314), Monthly Report, October 2025.**{#par-o13842}
**Deutsche Bundesbank (2025h), [The German economy](https://publikationen.bundesbank.de/content/970794), The German economy, Monthly Report, November 2025.**{#par-o91934}
**Deutsche Bundesbank (2025i), [The German economy](https://publikationen.bundesbank.de/content/970794), Monthly Report, November 2025.**{#par-i29113}
**Deutsche Bundesbank (2025j), [Public finances](https://publikationen.bundesbank.de/content/970796), Monthly Report, November 2025.**{#par-uuea5e}
**Deutsche Bundesbank (2025k), [How the debt brake could be developed further](https://publikationen.bundesbank.de/content/972500), November 2025.**{#par-i82o1o}
**Deutsche Bundesbank (2025l), [Global and European setting](https://publikationen.bundesbank.de/content/970800), Monthly Report, November 2025.**{#par-o453ai}
**[Directive () 2023/959 of the European Parliament and of the Council of 10 May 2023 amending Directive 2003/87/ establishing a system for greenhouse gas emission allowance trading within the Union and Decision () 2015/1814 concerning the establishment and operation of a market stability reserve for the Union greenhouse gas emission trading system](https://eur-lex.europa.eu/legal-content/EN/TXT/?uri=CELEX:32023L0959).**{#par-ou92e4}
**Dovern, J., J. Frank, A. Glas, L. Müller and D. Ortiz (2023), [Estimating Pass-Through Rates for the 2022 Tax Reduction on Fuel Prices in Germany](https://www.ifo.de/en/cesifo/publications/2022/working-paper/estimating-pass-through-rates-2022-tax-reduction-fuel-prices), Energy Economics, 126.**{#par-i9953a}
**European Central Bank (2025), [Eurosystem staff macroeconomic projections for the euro area](https://www.ecb.europa.eu/pub/pdf/other/ecb.projections202512_eurosystemstaff~12ead61977.en.pdf), December 2025.**{#par-ei566a}
**European Commission (2023), [The implementation of 2018 in the -- an overview](https://unece.org/sites/default/files/2023-05/3.2%20Eurostat%20Implementation%20of%20COICOP.pdf).**{#par-e43777}
**European Commission (2025), [Autumn 2025 Economic Forecast shows continued growth despite challenging environment, Economy and Finance](https://economy-finance.ec.europa.eu/economic-forecast-and-surveys/economic-forecasts/autumn-2025-economic-forecast-shows-continued-growth-despite-challenging-environment_en), 17 November 2025.**{#par-uo51uu}
**Federal Statistical Office (2025), [New orders in manufacturing in October 2025: + 1.5 % on the previous month](https://www.destatis.de/EN/Press/2025/12/PE25_432_421.html), press release, October 2025.**{#par-oue5u4}
**Gadatsch, N., K. Hauzenberger and N. Stähler (2016), [Fiscal policy during the crisis: A look on Germany and the euro area with GEAR](https://doi.org/10.1016/j.econmod.2015.10.038), Economic Modelling 52(B), pp. 997‑1016.**{#par-o8i91e}
**Gemeinschaftsdiagnose (2025), [Gemeinschaftsdiagnose Herbst 2025: Expansive Finanzpolitik kaschiert Wachstumsschwäche](https://gemeinschaftsdiagnose.de/2025/09/25/gemeinschaftsdiagnose-herbst-2025-expansive-finanzpolitik-kaschiert-wachstumsschwaeche/), #2‑2025.**{#par-i9o7o6}
**German Council of Economic Experts (2025), [Creating new prospects for tomorrow -- not squandering opportunities](https://www.sachverstaendigenrat-wirtschaft.de/en/annualreport-2025.html), Annual Report 2025‑2026, Box 5: Background: Dating the business cycle peak before the energy crisis in Germany worsened; pp. 48f.**{#par-o2o388}
**Graichen, J. and S. Ludig (2024), [Supply and demand in the 2, Assessment of the new for road transport, buildings and other sectors](https://www.umweltbundesamt.de/sites/default/files/medien/11850/publikationen/09_2024_cc_ets_2_supply_and_demand.pdf), September, Federal Environment Agency.**{#par-o12a37}
**Haertel, T., B. Hamburg and V. Kusin (2022), [The macroeconometric model of the Bundesbank revisited](https://www.bundesbank.de/content/888376), Deutsche Bundesbank Technical Paper, 01/2022.**{#par-u49u8o}
**Handelsblatt (2024), [Deutschland lässt trotz Geldnot 76 Milliarden Euro ungenutzt](https://www.handelsblatt.com/politik/deutschland/bundeshaushalt-deutschland-laesst-trotz-geldnot-76-milliarden-euro-ungenutzt-01/100059551.html), Handelsblatt online article, published 22 August 2024.**{#par-ii161a}
**Harju, J. and T. Kosonen (2013). [Restaurant cut: Cheaper meal and more service?](https://papers.ssrn.com/sol3/papers.cfm?abstract_id=2338434), Government Institute for Economic Research Working Papers No 52.**{#par-u6568a}
**International Energy Agency (2025), [Oil Market Report](https://www.iea.org/reports/oil-market-report-december-2025), December 2025.**{#par-u4575a}
**Kalkuhl, M., M. Kellner, T. Bergmann and K. Rütten (2023), [CO₂-Bepreisung zur Erreichung der Klimaneutralität im Verkehrs- und Gebäudesektor: Investitionsanreize und Verteilungswirkungen](https://www.pik-potsdam.de/de/institut/abteilungen/klimaoekonomie-und-politik/mcc-dokumente-archiv/2023_mcc_co2-bepreisung_klimaneutralitaet_verkehr_gebaeude.pdf), Mercator Research Institute on Global Commons and Climate Change ().**{#par-io15io}
**Lindner, A. and B. Loose (2014), [Erweiterung des Investitionskonzepts in der Volkswirtschaftlichen Gesamtrechnung, Wirtschaftsdienst](https://doi.org/10.1007/s10273-014-1755-x), 94(11), pp.836‑838.**{#par-o94828}
**Moretti, E., C. Steinwender and J. Van Reenen (2025), [The Intellectual Spoils of War? Defense , Productivity, and International Spillovers](https://doi.org/10.1162/rest_a_01293), The Review of Economics and Statistics, 107 (1), pp. 14‑27.**{#par-eioa5a}
**(2016a), [The Positive Effect of Public Investment on Potential Growth](https://www.oecd.org/content/dam/oecd/en/publications/reports/2016/12/the-positive-effect-of-public-investment-on-potential-growth_3a5e7a7d/15e400d4-en.pdf), Economics Department Working Papers, No 1347.**{#par-a61975}
**(2016b), [Can an Increase in Public Investment Sustainably Lift Economic Growth?](https://www.oecd.org/content/dam/oecd/en/publications/reports/2016/12/can-an-increase-in-public-investment-sustainably-lift-economic-growth_4093c760/a25a7723-en.pdf), Economics Department Working Papers, No 1351.**{#par-u47722}
**Ramey, V. A. (2020), [The Macroeconomic Consequences of Infrastructure Investment](https://www.nber.org/papers/w27625), Working Paper, No 27625, July 2020.**{#par-iiou7u}
**Rickels, W., C. Rischer, F. Schenuit and S. Peterson (2023), [Potential efficiency gains from the introduction of an emissions trading system for the buildings and road transport sectors in the European Union](https://www.econstor.eu/bitstream/10419/273080/1/1850836019.pdf), Kiel Working Paper, May 2023.**{#par-u59oe1}
**Suresh, N., R. Ghaw, R. Obeng-Osei and T. Wickstead (2024), [Public investment and potential output](https://obr.uk/docs/dlm_uploads/Public-investment-and-potential-output_August-2024.pdf), Discussion paper, No 5, Office for Budget Responsibility.**{#par-u8a79u}
**Wolf, A. W. (2025), [Will the Supreme Court determine the fate of the Trump tariffs?](https://www.piie.com/blogs/realtime-economics/2025/will-supreme-court-determine-fate-trump-tariffs?hl=de-DE), Peterson Institute for International Economics, Realtime Economics, Article from 4 December 2025.**{#par-i27627}
1. **{#_ftn_root_1} Seasonal adjustment here and in the remainder of this text also includes adjustment for calendar effects, provided they can be verified and quantified. In the June 2025 Forecast for Germany, a cumulative decline in of 0.1 % was expected; see Deutsche Bundesbank (2025a).**
2. **{#_ftn_root_2} For more information on the term "recession" used by the Bundesbank and how to put the revised economic picture into context, see Deutsche Bundesbank (2025b). For information on dating the business cycle in Germany, see German Council of Economic Experts (2025).**
3. **{#_ftn_root_3} For more information on the impact of economic uncertainty on economic activity in Germany, see Deutsche Bundesbank (2025c).**
4. **{#_ftn_root_4} The Bundesbank finalised this Forecast for Germany on 3 December 2025. It was incorporated into the projection for the euro area published by the on 18 December 2025.**
5. **{#_ftn_root_5} Additional defence spending and non-military investment are referred to here and below as "additional" if they increase the ratio of this expenditure over compared with 2024. The corresponding changes to borrowing scope in the Basic Law were aimed at strengthening these priority areas.**
6. **{#_ftn_root_6} Additional expenditure will rise to 1.8 % of by 2028. It is therefore included in the forecast with a fiscal multiplier of around 0.7. This is somewhat lower than suggested by the elasticities in the Bundesbank's macroeconometric model; see Haertel et al. (2022). This primarily reflects expectations of scarce capacity and therefore heightened inflation in the construction and defence industries.**
7. **{#_ftn_root_7} On the basis of initial calculations, the June 2025 Forecast for Germany did not contain many contributions to potential growth from infrastructure investment either.**
8. **{#_ftn_root_8} According to the literature, the effect on output potential depends on which component of defence spending is increased (see, for example, Becker and Dunne (2023)). Growth effects arise, in particular, from an increase in government defence-related expenditure on research and development. Taken in isolation, investment in machinery and equipment such as tanks or spending on ammunition does not increase a country's production capacity. The impact of additional defence spending is included in the current estimate of potential output. However, no effects arise yet in the forecast period up to 2028. Only from 2029 onwards do they increase potential output slightly.**
9. **{#_ftn_root_9} Net immigration so far in 2025 was significantly lower than expected in the Forecast for Germany last June. The assumption for 2025 was lowered by 100,000 persons to a net total of 250,000 immigrants. As there are no rising trends to be observed from any region of origin, the assumption for annual net immigration was lowered to this value over the remainder of the forecast horizon as well.**
10. **{#_ftn_root_10} Tax-free and social contribution-exempt inflation compensation bonuses were paid out up until 31 December 2024.**
11. **{#_ftn_root_11} These include, for example, business services, other business-related services and information and communication.**
12. **{#_ftn_root_12} The dampening effects of the discontinuation of inflation compensation bonuses, paid mainly in jobs subject to wage bargaining in the previous year, are virtually irrelevant in areas not bound by collective labour contracts. Other special payments, such as bonuses, likewise contributed to the high rise in actual earnings. Increased severance payments may also have played a role in industry.**
13. **{#_ftn_root_13} The general statutory minimum wage will rise by 8.4 % as of 1 January 2026 and by a further 5 % as of 1 January 2027. This mainly affects labour-intensive services, such as butchers and bakeries.**
14. **{#_ftn_root_14} In June, an increase of 2.3 % was expected for 2025 and 2.9 % for 2026.**
15. **{#_ftn_root_15} The second stage of the general minimum wage increase will provide stimulus in 2027, too.**
16. **{#_ftn_root_16} For more context on the latest trade agreements with the United States, see Deutsche Bundesbank (2025f).**
17. **{#_ftn_root_17} The Supreme Court is reviewing country-specific tariffs imposed by President Trump on the basis of a national emergency invoked under the International Emergency Economic Powers Act (). This includes all "reciprocal tariffs", amongst other things. Judicial opinions in the lower courts have already concluded that the tariffs are unlawful. If the Supreme Court agrees with this assessment, the Administration could switch to other legal bases for introducing new tariffs. However, this would entail new legal risks, restrictions on setting tariffs or, in some cases, considerable lead times as well as political headwinds. See Congressional Research Service (2025), Busch (2025) and Wolf (2025).**
18. **{#_ftn_root_18} See International Energy Agency (2025).**
19. **{#_ftn_root_19} On the other hand, the export market share losses assumed by this forecast could also turn out to be smaller, especially if the German economy were able to better adapt to the changed competitive conditions in global markets.**
20. **{#_ftn_root_20} All data on global economic growth and global trade refer to global aggregates excluding the euro area.**
21. **{#_ftn_root_21} See Deutsche Bundesbank (2025f, 2025g).**
22. **{#_ftn_root_22} This also applies to all other tariffs in place at the time this forecast was finalised, including sector-specific tariffs such as those on steel and aluminium products and prevailing derogations. For German goods exports to the United States overall, these assumptions do not imply any significant change in the average tariff rate compared with the June forecast.**
23. **{#_ftn_root_23} See European Central Bank (2025).**
24. **{#_ftn_root_24} For more information on how the new scope for borrowing is to be used, and in particular on the Federal Government's budget plan for 2025, see Deutsche Bundesbank (2025h); for details on the Federal Government's budget plan for 2026, see Deutsche Bundesbank (2025i).**
25. **{#_ftn_root_25} The forecast takes account of the extended mothers' pension on an accruals basis, thus following the same accounting principles as the national accounts. The benefit is scheduled to be introduced on 1 January 2027, but due to the technical effort involved, it will be paid out for the first time in 2028.**
26. **{#_ftn_root_26} For more details, see Deutsche Bundesbank (2025i).**
27. **{#_ftn_root_27} In 2025 and 2026, multi-year loans from central government to the Federal Employment Agency as well as to the statutory health and long-term care insurance schemes will allow contribution rates to remain stable -- or prevent them from rising more sharply, at least. The forecast presumes that the Federal Employment Agency will then partially pay back the loans from 2027 onwards.**
28. **{#_ftn_root_28} Revenue from emissions allowances is recorded in the national accounts with a one-year lag. Therefore, the introduction of -wide emissions allowances trading ( ) in 2028 and the assumed decline in carbon prices (see the supplementary information entitled "[Impact of the introduction of the Emissions Trading System 2 on consumer prices](#Impact-of-the-introduction-of-the-EU-Emissions-Trading-System-2-on-consumer-prices)") do not yet have an impact on the deficit forecast over the projection horizon.**
29. **{#_ftn_root_29} For more information on state and local governments, see Deutsche Bundesbank (2025j).**
30. **{#_ftn_root_30} This share of consolidated debt is roughly approximate to Germany's financial contribution to the budget. For more details, see Deutsche Bundesbank (2024b), Monthly Report, April 2024, Commentaries, Section 2.2.**
31. **{#_ftn_root_31} Economic data published after the forecast was finalised generally support this assessment, but there are signs of slight shifts in various sectors. There were mixed signals for industry: while real sales in October were below the level of the previous quarter, output across all categories of goods rose significantly compared with both September and the previous quarter. According to the German Association of the Automotive Industry, car production also increased in November. The material shortage for microchips probably had a less pronounced impact than had been feared by some. In October, real exports of goods edged above the level of the previous quarter. The main construction sector also performed surprisingly well: civil engineering output went up in October, followed by building construction output, although the quarter-on-quarter increase continued to be driven by the momentum in the civil engineering subsector. Services output was less dynamic than expected in September, which means that it was lacklustre moving into the fourth quarter (although it has been revised upwards markedly in previous months). Sentiment indicators for December confirmed the subdued outlook for the short term.**
32. **{#_ftn_root_32} See [Overview](https://publikationen.bundesbank.de/content/970806).**
33. **{#_ftn_root_33} However, the time series is highly volatile and it remains to be seen whether the elevated level can be maintained.**
34. **{#_ftn_root_34} See Federal Statistical Office (2025).**
35. **{#_ftn_root_35} However, the foreign trade figures from September already suggest that the recent sharp slump in goods trade with the United States is stabilising.**
36. **{#_ftn_root_36} According to an analysis by the Bundesbank, around three-quarters of the loss in market share since 2021 has been attributable to a deteriorating competitive position on the supply side (see [What's behind the sustained decline in German export market shares?](https://publikationen.bundesbank.de/content/960442).**
37. **{#_ftn_root_37} Uncertainty indicators with a significant impact on German industrial output, such as the or model-implied uncertainty indicators, have risen only slightly this year. According to empirical analyses, this is likely to have some dampening effects on economic activity with a time lag. By contrast, text-based indicators indicate a significant increase in uncertainty. However, no notable macroeconomic effects in Germany can be inferred from this (see [Overview](https://publikationen.bundesbank.de/content/970806)).**
38. **{#_ftn_root_38} See Deutsche Bundesbank (2025a).**
39. **{#_ftn_root_39} See Deutsche Bundesbank (2025k).**
40. **{#_ftn_root_40} For information on the expected price effects of the carbon price, see Deutsche Bundesbank (2019).**
41. **{#_ftn_root_41} This is indicated by past experience with cuts in Germany during the coronavirus pandemic, but also with tax cuts in the food service or hospitality industry elsewhere in the world. See Benzarti and Carloni (2019) or Harju and Kosonen (2013).**
42. **{#_ftn_root_42} Potential lower price pressures as a result of rising imports of Chinese goods -- which could increasingly be delivered to Europe owing to the tariff dispute with the United States -- are likely to play only a minor role here.**
43. **{#_ftn_root_43} Beginning next year, the European Classification of Individual Consumption according to Purpose, version 2, ( 2), which was derived from the new, -wide 2018 classification, will enter into force. See European Commission (2023). In addition, the will be converted to the new base year of 2025.**
*[ETS]: Emissions Trading System
*[NBER]: National Bureau of Economic Research
*[VAT]: value added tax
*[NATO]: North Atlantic Treaty Organization
*[ETS1]: Emissions Trading System
*[NGEU]: NextGenerationEU
*[ILO]: International Labour Organization
*[VDAX]: Deutsche Börse volatility index
*[ETS2]: Emissions Trading System
*[R\&D]: research and development
*[HICP]: Harmonised Index of Consumer Prices
*[GDP]: gross domestic product
*[OECD]: Organisation for Economic Co-operation and Development
*[**ETS2**]: Emissions Trading System
*[**HICP**]: Harmonised Index of Consumer Prices
*[UN]: United Nations
*[kWh]: kilowatt-hour
*[US]: United States
*[**DSGE**]: dynamic stochastic general equilibrium
*[EC]: European Community
*[TFP]: total factor productivity
*[EURIBOR]: euro interbank offered rate
*[ECB]: European Central Bank
*[**GDP**]: gross domestic product
*[IAB]: Institute for Employment Research
*[**EU**]: European Union
*[MCC]: Merchant Category Codes
*[GfK]: market research institution
*[**TFP**]: total factor productivity
*[EU ETS]: European Union
*[EU]: European Union
*[ECOICOP]: European Classification of Individual Consumption according to Purpose, version 2,
*[ifo]: economic research institution
*[S\&P]: Standard & Poor’s
*[COICOP]: Classification of individual consumption according to purpose
*[**US**]: United States
*[IEEPA]: International Emergency Economic Powers Act