# Global and European setting
* [*1 Global economy holds steady amid turbulent times*](#tar-1 "1 Global economy holds steady amid turbulent times")
* *[*1.1 Subdued economic activity in China*](#tar-2 "1.1 Subdued economic activity in China")*
* **[*1.2 Mixed trends in other emerging market economies*](#tar-3 "1.2 Mixed trends in other emerging market economies")**
* ***[*'s trade agreements with the Mercosur countries and India*](#tar-4 "’s trade agreements with the Mercosur countries and India")
* *[*1.3 US economy still clearly on course for growth at the end of the year*](#tar-5 "1.3 US economy still clearly on course for growth at the end of the year")*
* **[*1.4 Japanese economy sluggish at end of year*](#tar-6 "1.4 Japanese economy sluggish at end of year")**
* ***[*1.5 Economic activity in the United Kingdom remains muted*](#tar-7 "1.5 Economic activity in the United Kingdom remains muted")***
* ***[*1.6 Renewed increase in economic output in Poland*](#tar-8 "1.6 Renewed increase in economic output in Poland")******
* ***[*Background to slowing employment growth in the United States*](#tar-9 "Background to slowing employment growth in the United States")***
* ***[*2 Continued moderate growth in the euro area*](#tar-10 "2 Continued moderate growth in the euro area")***
* ***[*List of references*](#tar-11 "List of references")***
***1 Global economy holds steady amid turbulent times*** {#tar-1}
-----------------------------------------------------------------
*****The global economy expanded moderately again in the final quarter of 2025.** In the United States, robust overall economic growth appears to have continued. In China, economic activity remained subdued, as persistently buoyant export activity was tempered by continued weak domestic demand. Economic output in the euro area rose moderately. Overall, the global economy continued to prove resilient in the face of ongoing trade and geopolitical tensions.***{#par-i4a72u}
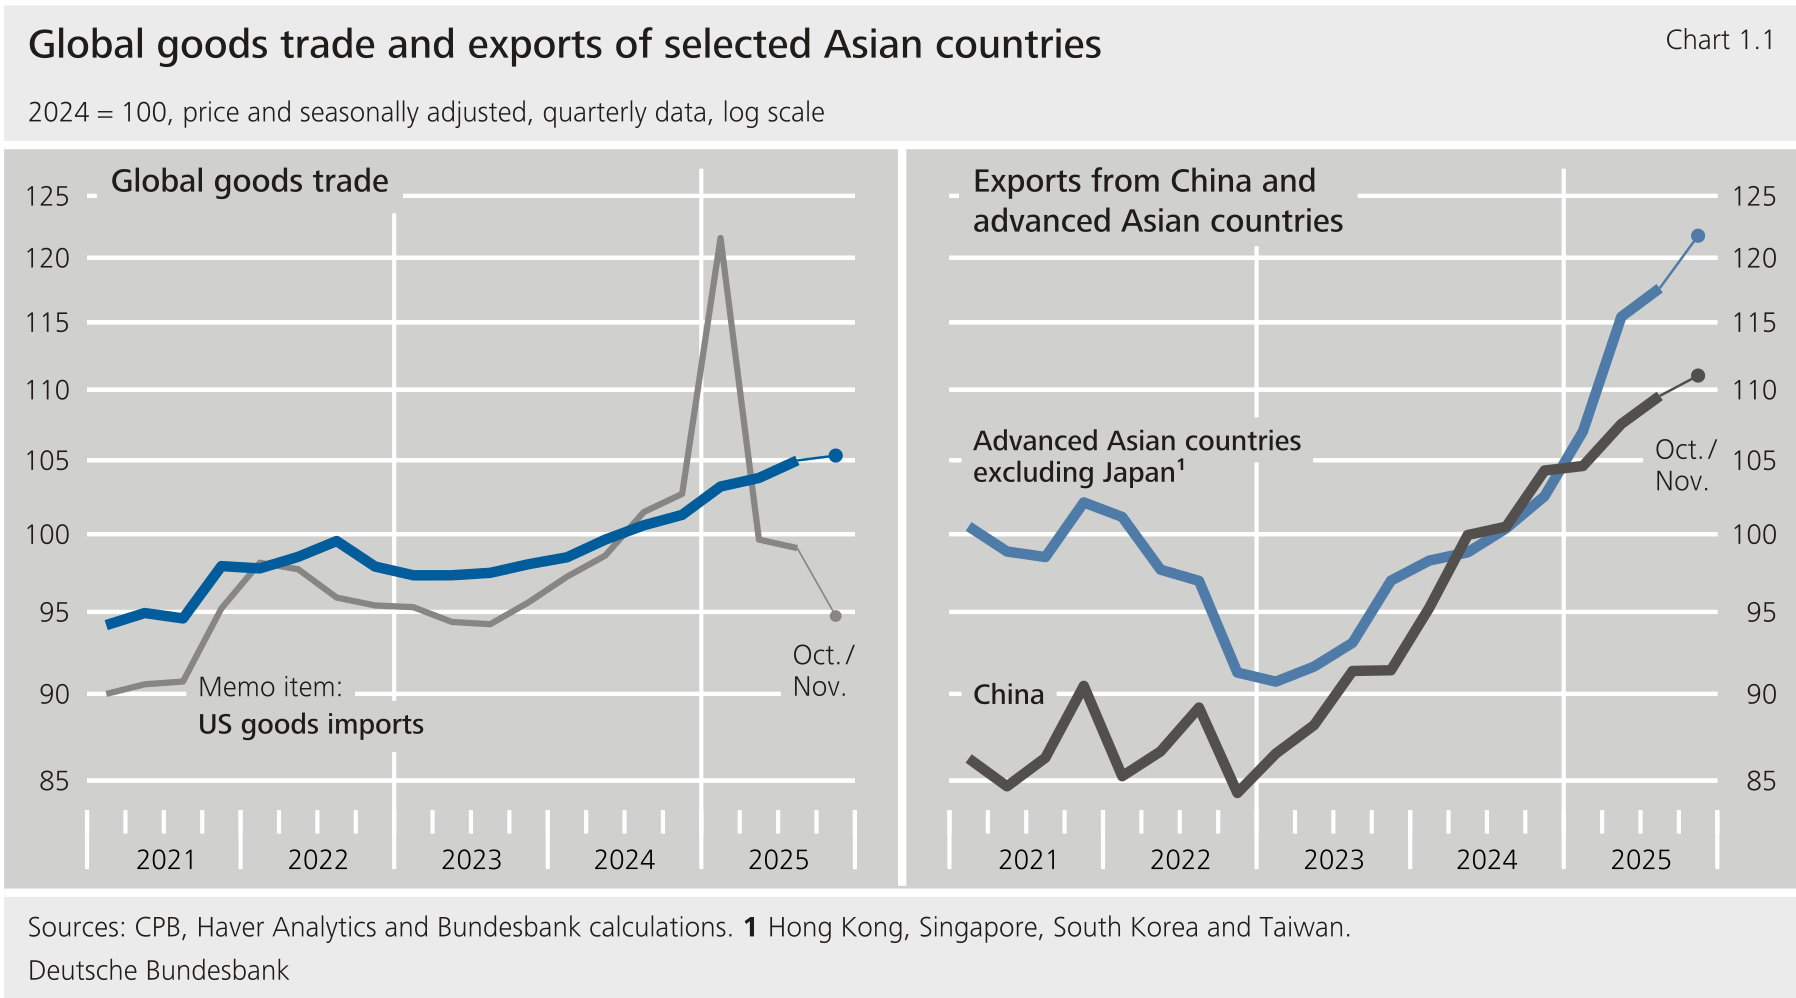
*****Global trade in goods continued to increase.** According to calculations by the Dutch , the average monthly volume of world trade in October and November rose by 0.3 % on a seasonally adjusted basis compared with the third quarter. While the upward trajectory continued, the pace slowed. At the same time, shifts in the regional structure of global trade became more entrenched. goods imports fell due to higher tariffs, while China's exports saw another marked increase. Exports from several smaller Asian economies also rose sharply, supported by strong demand for high-technology products due to the boom.***{#par-aaua2a}
{#par-au3426}
******
*****Trade policy tensions and geopolitical risks persisted.** The United States maintained its aggressive trade stance, with intermittent disputes with the arising over territorial claims to Greenland. The administration has also recently threatened Canada and South Korea with further tariff increases. At the same time, the European Commission stepped up its efforts to deepen economic ties with other trading partners, concluding negotiations on trade and investment agreements with India and the Mercosur countries. While the expected macroeconomic stimulus is likely to be modest in the short term, these agreements highlight the 's efforts to diversify its trade relations. They could also send an important political signal in support of open markets and rules-based trade in an increasingly fragmented global environment (see the supplementary information entitled "[The EU's trade agreements with the Mercosur countries and India](#The-EU-s-trade-agreements-with-the-Mercosur-countries-and-India)"). This presupposes prompt and full implementation, which at least in the case of the Mercosur agreement has now been put into question due to its referral to the European Court of Justice by the European Parliament.***{#par-o511e7}
****In light of the robust global economy, the** **broadly reaffirmed its earlier projections in the January 2026 World Economic Outlook update.** The justified the slight upward revision in global growth for the current year -- by 0.2 percentage points to 3.3 % -- on the basis of continued strong investment in the technology sector and supportive monetary and fiscal policy in many regions.[\[1\]](#_ftn_root_1) For 2027, the continues to project growth of 3.2 %, and also made only minor adjustments to the inflation outlook. Inflation in the advanced economies is thus expected to continue easing, although inflation may return to target more slowly in the United States than elsewhere. The believes that downside risks to the growth outlook still predominate. A renewed escalation of geopolitical conflicts and increased protectionist measures could weigh on global economic activity, and the also points to uncertainties surrounding the recent surge in technology investment, whose long-term economic profitability remains unproven.**{#par-o32847}
{#par-i58i5i}
**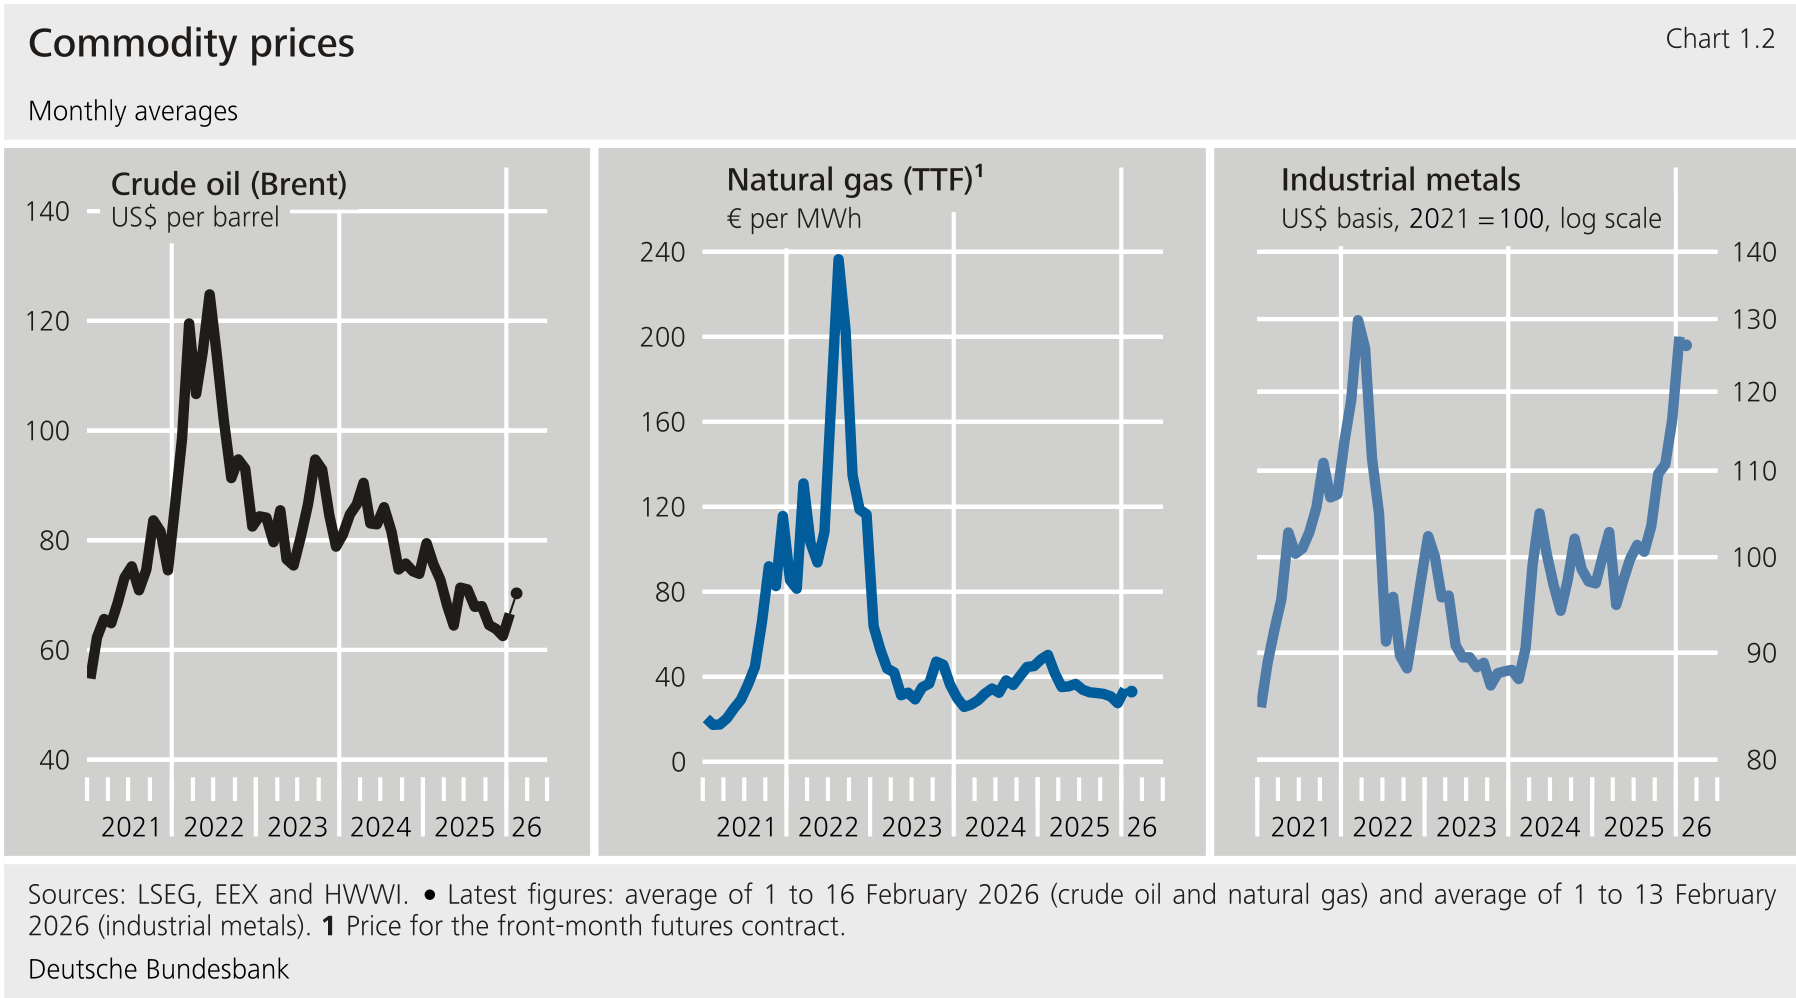**
****Against the backdrop of heightened geopolitical risks, commodity prices have recently picked up on a broad front.** Amid tensions in Iran and production disruptions in Kazakhstan, crude oil prices climbed to $71 per barrel most recently, following a decline that lasted through to the end of 2025. European gas prices also increased at times, driven chiefly by a weather-related increase in demand and comparatively low gas storage levels in Europe. Nevertheless, at the time this report went to press they stood at €31 per megawatt hour, still well below their level a year earlier. Prices for industrial raw materials rose particularly sharply of late, especially for metals such as copper, aluminium, nickel and tin. In addition to supply disruptions, a rise in precautionary demand in the wake of geopolitical tensions also had an inflationary effect.**{#par-eeu635}
{#par-u7ui2o}
**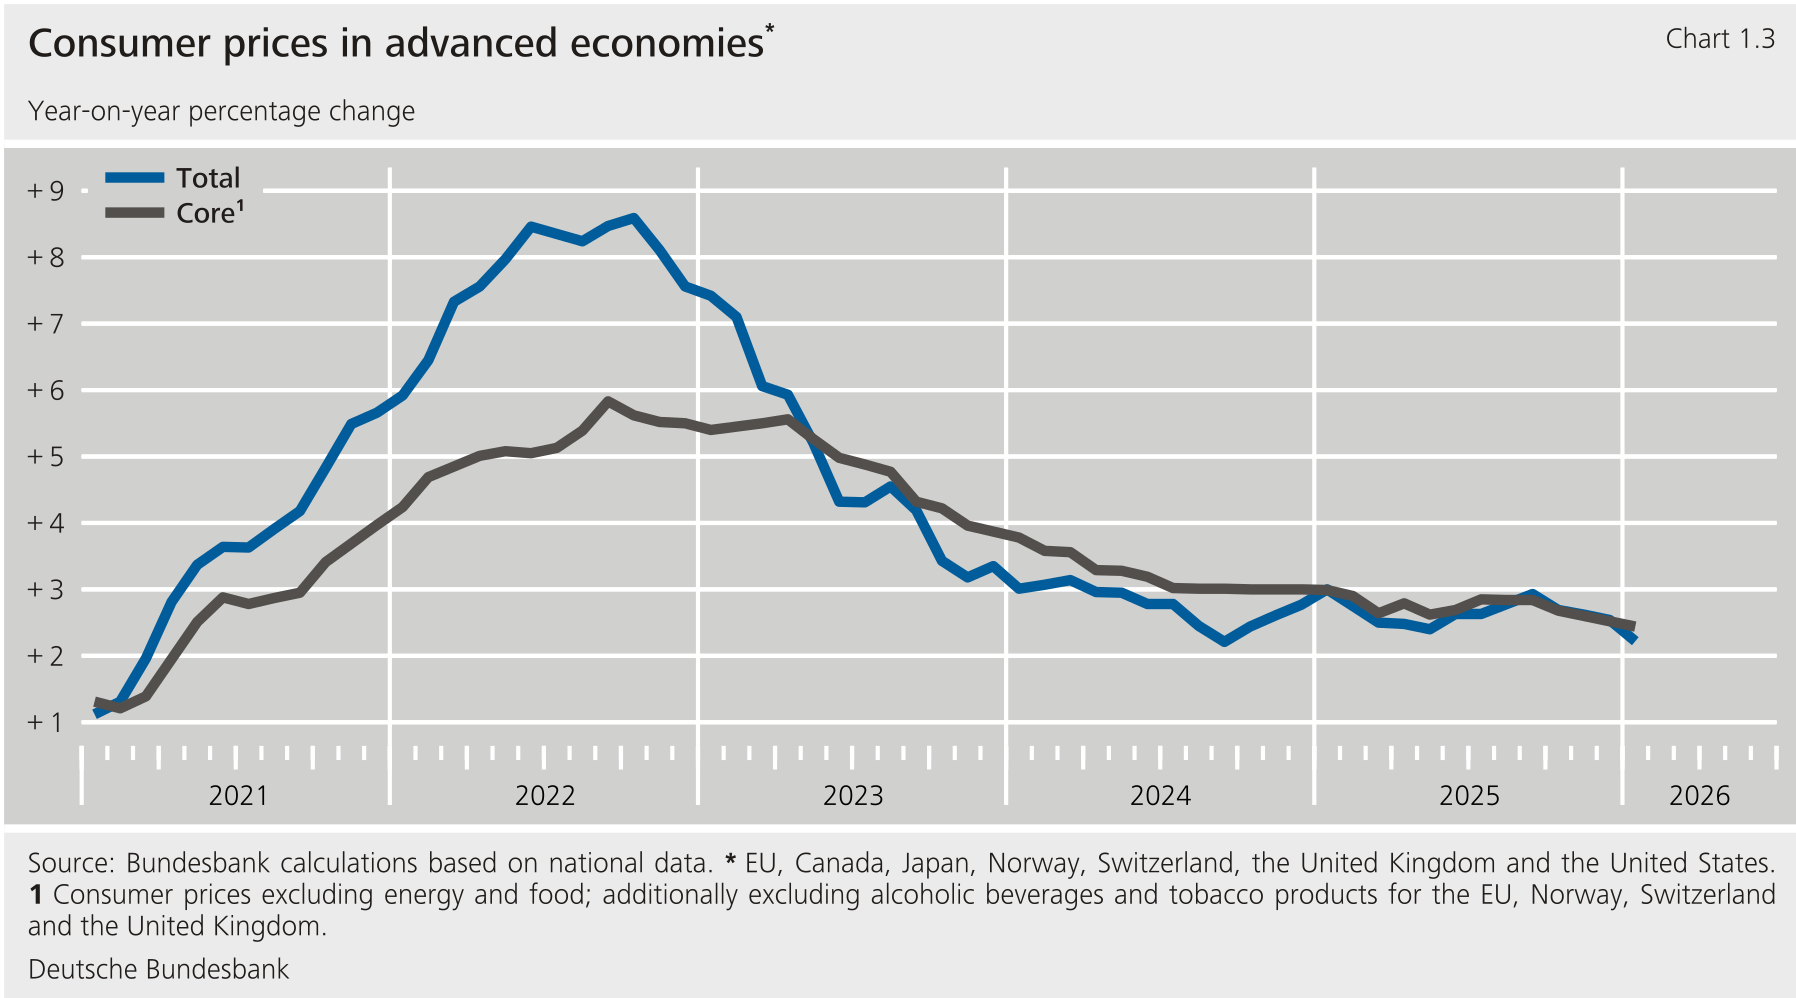**
****The disinflation process in the advanced economies regained momentum in recent months**. Year-on-year consumer price inflation fell from 3.0 % in September to 2.3 % in January. Core inflation (excluding energy and food) also declined from 2.8 % to 2.4 %. This primarily reflects developments in the United States, where tariff-related price pressure on goods stalled and services inflation eased noticeably. In the euro area, by contrast, disinflation in services progressed only slowly. The rise in commodity prices since the start of the year may make a further decline in inflation rates in the advanced economies more difficult in the coming months.**{#par-ei8352}
### **1.1 Subdued economic activity in China** {#tar-2}
****Macroeconomic growth in China remained subdued.** According to official estimates, real rose by 4.5 % in the fourth quarter year-on-year, marking a slight slowdown, as in preceding quarters. Structural adjustments, particularly in the real estate sector, coupled with weak growth in private consumption, continued to weigh on growth, while the export business remained buoyant. Overall, this confirms the ongoing pattern of export-led growth alongside weak domestic demand. Consumer price inflation picked up somewhat towards the end of 2025, but the underlying trend remained muted. In January 2026, inflation weakened again somewhat to 0.2 % on the year. However, this was essentially due to the late date of the Chinese New Year, which is usually accompanied by price increases.**{#par-i2e379}
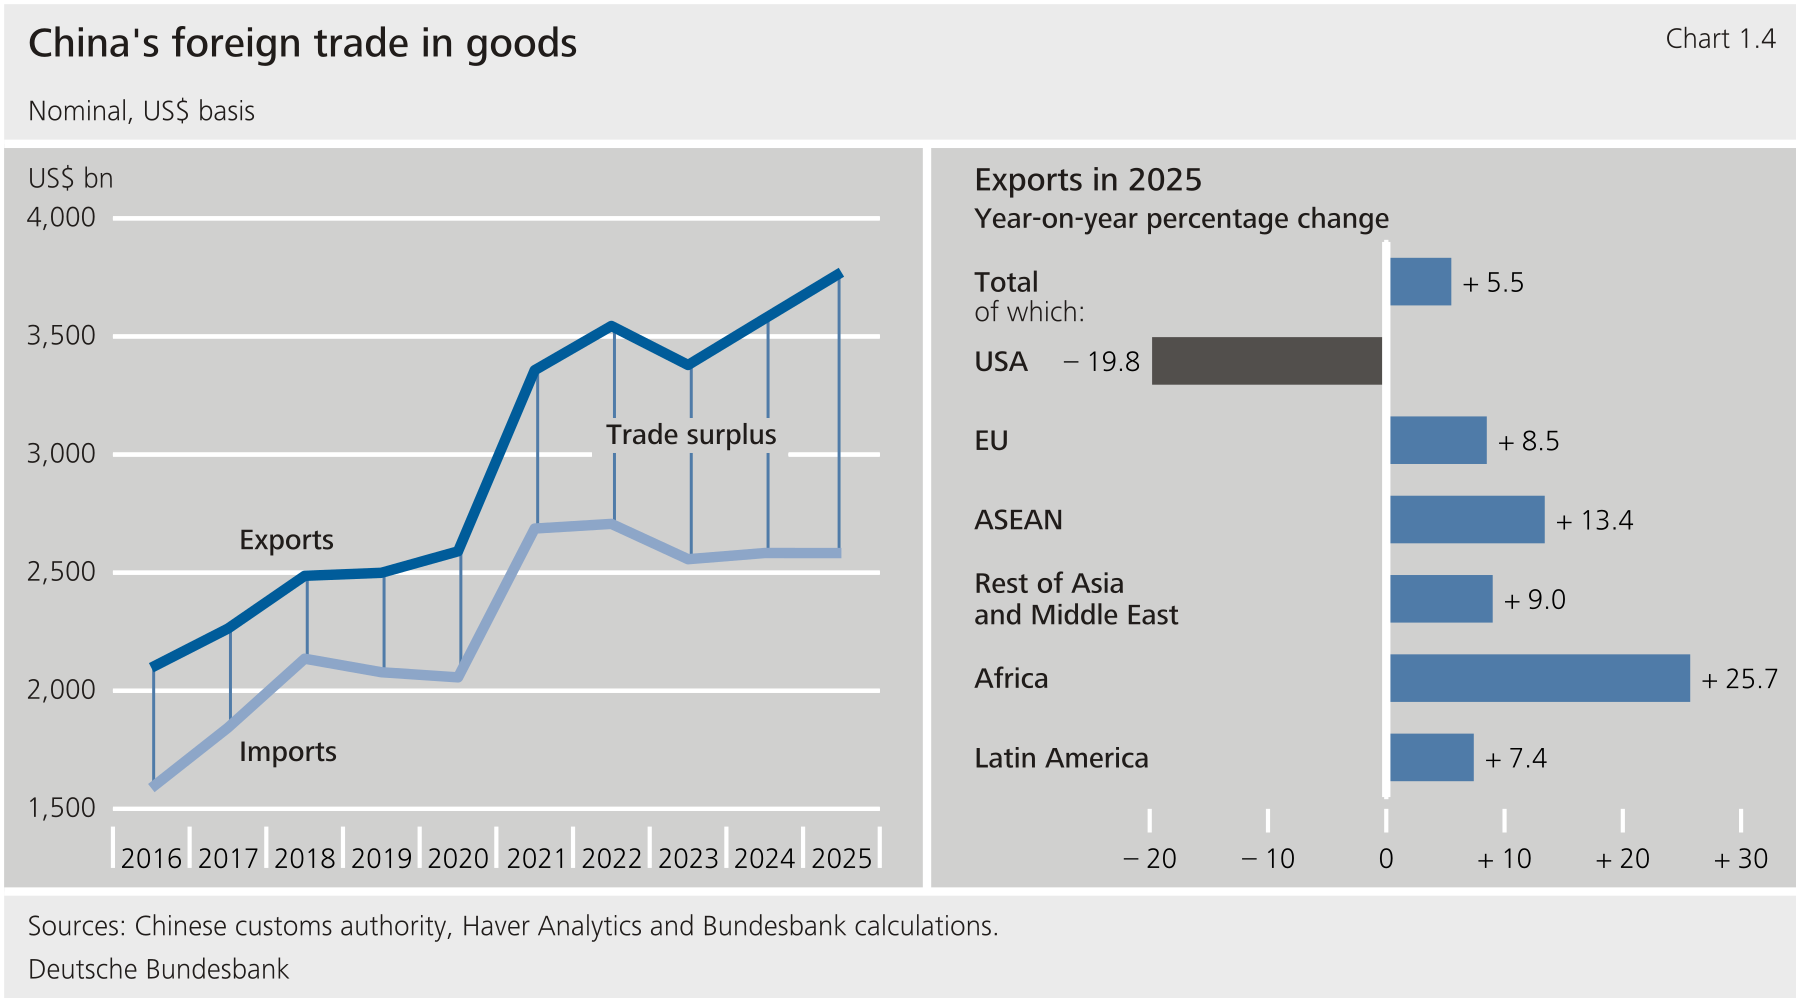
****China's foreign trade surplus increased again in 2025.** Exports rose sharply despite a moderate global economic environment and a significant increase in tariffs, whereas imports were virtually stagnant owing to subdued domestic demand. The decline in exports to the United States was more than offset by gains in other markets, especially in Africa and parts of Asia, while the value of exports to the increased by just under 9 % in dollar terms. While some trade was diverted from the , this likely played only a minor role. Rather, the primary driver appears to be the qualitative enhancement in China's export portfolio, evidenced by the surge in high-tech exports, including motor vehicles.**{#par-e99421}
{#par-i99ei9}
****
### **1.2 Mixed trends in other emerging market economies** {#tar-3}
****In India, the high rate of economic expansion appears to have continued.** In the third quarter of 2025, year-on-year real growth accelerated to 8.2 %. Economic activity is likely to have remained very strong in the final quarter, although goods exports to the United States declined due to the high tariffs. Against this backdrop, India stepped up efforts to diversify its export markets, as demonstrated by the agreement on the trade and investment pact with the (see the supplementary information entitled "[The EU's trade agreements with the Mercosur countries and India](#The-EU-s-trade-agreements-with-the-Mercosur-countries-and-India)").[\[2\]](#_ftn_root_2) Consumer inflation remained subdued, amounting to 2.7 % in January 2026. The central bank cut its key interest rate by 25 basis points to 5.25 % in December, where it has remained since.**{#par-i61a9i}
****In Brazil, economic activity remained sluggish.**In the third quarter of 2025, overall growth had virtually stalled compared with the previous quarter, and momentum is also likely to have remained weak in the final quarter, not least because of the continued restrictive monetary policy. At the same time, labour market conditions remained very favourable, with strong wage growth persisting. Against this backdrop, consumer price inflation slowed only gradually, although at 4.4 % in January 2026 it remained within the central bank's target corridor. The central bank has kept its policy rate at the elevated level of 15 % in recent months.**{#par-a5ui81}
****In Russia, overall economic growth remained weak.** Preliminary official estimates show that real rose by 1.0 % in 2025, following growth of 4.9 % in 2024. Although separate results for the final quarter are not yet available, indicators suggest that economic activity remained subdued, with high real interest rates weighing on investment. Fiscal policy, by contrast, retained its expansionary stance. Owing to continuing increases in military expenditure and declining oil export revenues, the government deficit increased to 2.6 % of last year, putting significant pressure on public finances.[\[3\]](#_ftn_root_3) This prompted the government to raise the rate from 20 % to 22 % at the beginning of 2026, triggering an uptick in consumer price inflation to 6.0 % in January 2026. Nevertheless, the central bank continued its monetary easing cycle and reduced the policy rate to 15.5 %.**{#par-ee37eo}
****The** **'s trade agreements with the Mercosur countries and India**** {#tar-4}
----------------------------------------------------------------------------------
****Following more than 20 years of negotiations, the** **concluded trade agreements with the Mercosur countries** [\[1\]](#_ftn_4636a9e1_1)**and with India in January 2026. The agreements largely eliminate tariffs.** The and Mercosur would thus form one of the world's largest trading areas by population, while the economic area covered by the agreement with India would include just under 2 billion people and account for roughly one-quarter of global economic output. Both agreements go beyond purely trade-related provisions and also include rules on investment, sustainable development, environmental and climate protection, digital transformation, human and labour rights, as well as security and mobility-related issues. However, the agreements have yet to be ratified.[\[2\]](#_ftn_4636a9e1_2)**{#par-u43oao}
****Most tariffs between the** **and Mercosur are to be eliminated.** The currently high import duties imposed by the Mercosur countries on industrial goods (ranging from around 14 % on pharmaceuticals to as much as 35 % on motor vehicles) are to be substantially reduced or abolished. An exception applies to motor vehicles and motor vehicle parts, for which long transitional periods are planned due to their particular economic and industrial policy importance on both sides.[\[3\]](#_ftn_4636a9e1_3) For the , however, the impact of liberalisation is limited, as tariffs on industrial imports are already relatively low.**{#par-eui6o7}
****The agreement with India also abolishes most tariffs on industrial goods.** India will open up its markets for pharmaceuticals, machinery, chemicals and technical products in particular. Tariffs on machinery (previously up to 44 %), chemicals (up to 22 %) and pharmaceuticals (11 %) are to be largely eliminated. Import duties on passenger cars in India (previously up to 110 %) will be gradually reduced to 10 %, subject to a quota of 250,000 vehicles per year. In return, the will reduce tariffs on key elements of India's export portfolio, including textiles, leather goods and jewellery, and other labour-intensive industrial products.**{#par-ou763o}
****In the agricultural sector, the partners continue to protect their producers to some extent.** For agricultural products, the agreement with the Mercosur countries provides for differentiated duty-free import quotas into the depending on the partner country and product. India protects products classified as sensitive, such as dairy products, cereals and poultry, while the maintains tariffs on beef, sugar and rice from India.**{#par-e2ou1a}
{#par-ooaue8}
**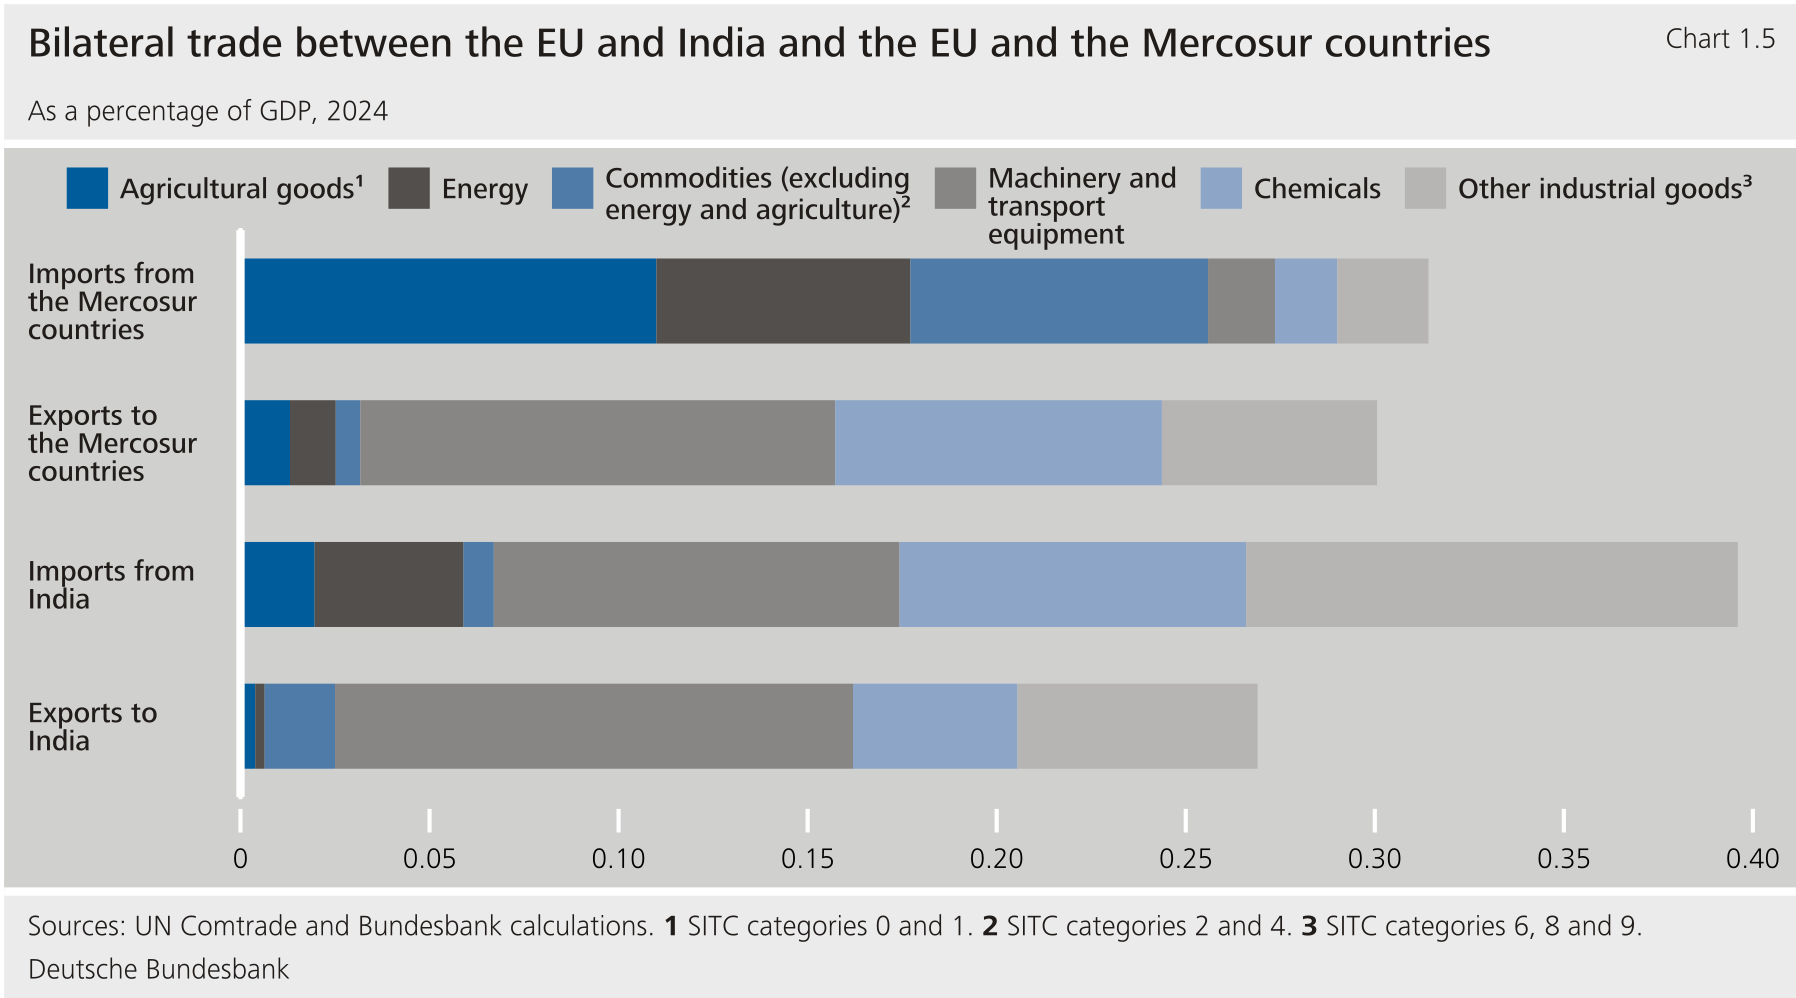**
****From a macroeconomic perspective, trade with Mercosur and India has so far been of limited importance for the** . Exports to the Mercosur countries amounted to around 0.3 % of in 2024, most of which was attributable to machinery and transport equipment, chemicals and other industrial goods. The imported goods of roughly the same value, primarily agricultural products and commodities. For individual Member States, particularly Spain and Portugal, however, trade with Mercosur is significantly more important due to close historical ties. In 2024, exports to India amounted to just under 0.3 % of , while imports accounted for around 0.4 %. Unlike trade with Mercosur, trade flows with India in both directions are concentrated in industrial goods. From the perspective of India and the Mercosur countries, trade with the is of considerably greater importance, with exports to the representing 2 % of in each case.**{#par-u829uu}
{#par-a933oe}
**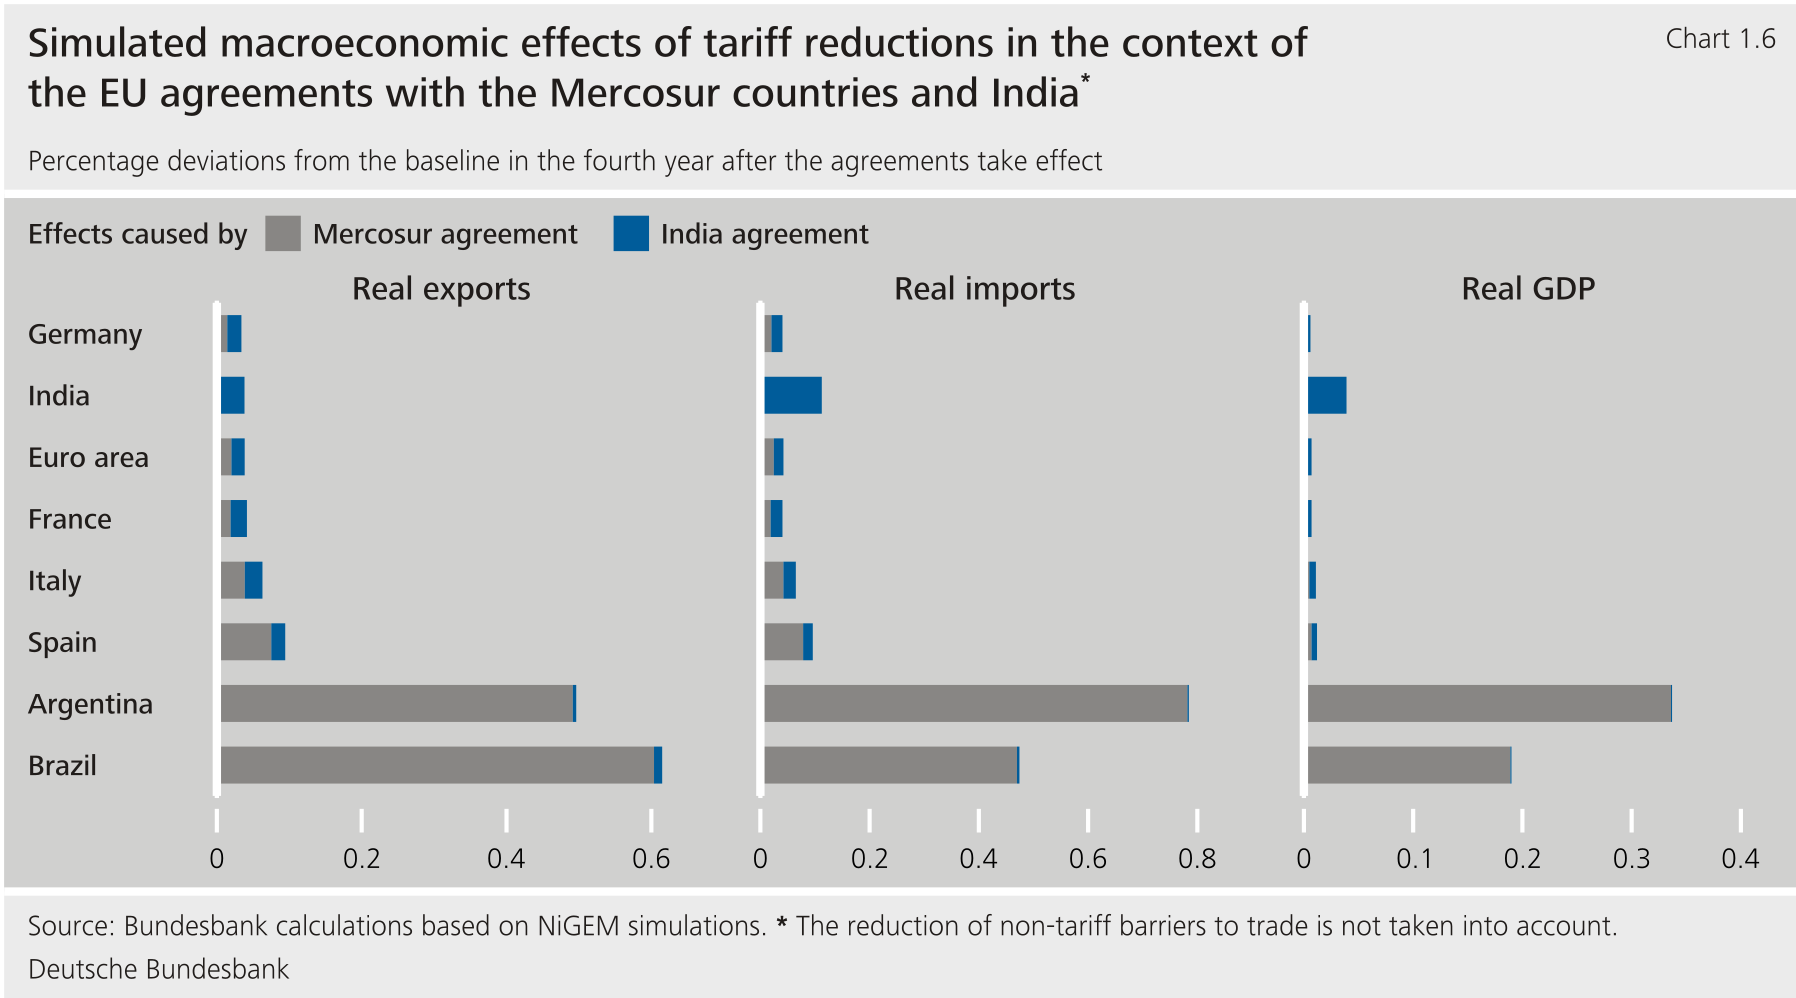**
****We estimate the macroeconomic effects of the trade agreements using simulation analyses based on the NiGEM multi-country macroeconomic model.** [\[4\]](#_ftn_4636a9e1_4) The simulations incorporate tariff reduction paths derived from the liberalisation provisions set out in the agreements. For goods exports to the Mercosur countries, the effective average tariff falls from just under 8.5 % to just over 2.5 % upon the agreement's entry into force and then gradually declines further to zero over a period of 20 years. By contrast, Mercosur exporters benefit immediately from an effective reduction in tariffs of around 2.8 % to approximately zero.[\[5\]](#_ftn_4636a9e1_5) The Indian agreement envisions a more incremental reduction.[\[6\]](#_ftn_4636a9e1_6)**{#par-aui111}
****The simulation results suggest that the macroeconomic effects of both agreements are likely to be modest in the short to medium term.** The estimated effects after four years are consistently positive but very small for the European partners. The additional euro area imports and exports resulting from the simulations remain below 0.1 % when measured against its total trade volume,[\[7\]](#_ftn_4636a9e1_7) with the effects somewhat larger for Spain and Portugal than for the euro area as a whole. The small macroeconomic effects are mainly explained by the previously low importance of bilateral trade relative to aggregate value added. For the Mercosur countries as well as for India, the effects are noticeably greater, though still not particularly significant.[\[8\]](#_ftn_4636a9e1_8) Third countries also benefit slightly overall from the agreements.**{#par-i6197o}
****For the** ,**the agreements are important primarily because of the political signals they send.** Their significance lies less in their short-term growth or trade effects than in the political signal they send: working together to reconcile interests and liberalise trade can provide an attractive alternative to unilateral, interest-driven policies and protectionist tendencies. This presupposes prompt and full implementation, which at least in the case of the Mercosur agreement has now been put into question due to its referral to the European Court of Justice by the European Parliament. The overall economic benefits of the agreements could prove greater in the medium to long term than model-based simulations suggest, for example due to the greater diversification of the 's trade relationships. The agreement with the Mercosur countries in particular could help diversify current supply risks and bolster supply chain resilience in sectors including the commodities sector. Regarding India, the agreements extend beyond trade in goods to include closer cooperation in the services sector and the mobility of skilled workers. At the same time, India is a very fast-growing economy, which could translate into significantly greater economic potential for European enterprises over the longer term.**{#par-aueu8e}
1. **{#_ftn_4636a9e1_1} Argentina, Bolivia, Brazil, Paraguay and Uruguay. Bolivia did not become a full member of Mercosur until 2024, after the treaty text had been drafted, and the agreement is expected to be extended to Bolivia in the medium term.**
{#par-ua3917}
2. **{#_ftn_4636a9e1_2} The Mercosur agreement must still undergo a legal review by the European Court of Justice. However, an interim trade agreement could be provisionally applied, subject to a decision by the Council of the European Union (Council of Ministers), which is usually based on a proposal from the European Commission.**
{#par-ou5493}
3. **{#_ftn_4636a9e1_3} For exports, tariff reductions will be phased in over periods of between 18 and 30 years depending on the vehicle category, while exports from the Mercosur countries will be subject to transition periods of up to 30 years.**
{#par-e31749}
4. **{#_ftn_4636a9e1_4} NiGEM is a semi-structural model designed by the National Institute of Economic and Social Research that covers the economies of most countries and major emerging market economies. See [Hantzsche et al. (2018)](https://niesr.ac.uk/publications/using-nigem-uncertain-times-introduction-and-overview-nigem?type=national-institute-economic-review) and [Bernard et al. (2024)](https://niesr.ac.uk/publications/effects-higher-us-tariffs?type=global-economic-outlook-topical-feature).**
{#par-u8e71e}
5. **{#_ftn_4636a9e1_5} In the simulations, tariff rates for goods subject to duty-free quotas were set to zero, as these quotas generally exceed current trade volumes. By contrast, reductions in non-tariff barriers to trade and the facilitation of trade in services were not incorporated into the simulations, as they are difficult to quantify.**
{#par-u398oi}
6. **{#_ftn_4636a9e1_6} In this case, effective tariff rates for goods exports (imports) fall linearly from the current 13.5 % (4.4 %) to 1.5 % (0.8 %) over a period of ten years and remain at that level thereafter.**
{#par-uoa44o}
7. **{#_ftn_4636a9e1_7} Including intra-trade.**
{#par-i26e86}
8. **{#_ftn_4636a9e1_8} Effects of a similar magnitude are also found, inter alia, by Abelianski et al. (2025) and Hagemejer et al. (2025) for the --Mercosur agreement, as well as Hinz et al. (2026) for the trade agreement with India. Baur et al. (2025) show that even in scenarios involving a broader free trade offensive, merely a moderate increase in of only a few tenths of a percent would be expected for the .**
{#par-ea47u4}
### **1.3 economy still clearly on course for growth at the end of the year** {#tar-5}
****The** **economy remained in good shape in the final quarter of 2025.** The first estimate of real was not yet available as this report went to press.[\[4\]](#_ftn_root_4) However, the indicators available thus far point to robust growth. Private households again increased their consumer spending markedly in October and November, while firms further expanded investment in machinery and equipment, with purchases linked to the ongoing boom remaining a key driver. At the same time, imports declined noticeably despite strong domestic demand, probably largely reflecting the substantial tariff increases implemented over the course of the year. Exports made little contribution to growth. The effects of the 43-day government shutdown are likely to have carried little weight given the strong underlying trend.**{#par-uia332}
****The** **economy continued on its solid growth path at the turn of the year.** Business surveys in January again described activity and prospects as solid, possibly because fiscal and monetary policy are expected to provide moderate stimulus during the current year. It remains to be seen, however, whether the expansion of productive capacity can keep pace with what is likely to remain brisk demand. In 2025 this was achieved chiefly through strong productivity gains, while employment rose only modestly. Alongside the somewhat cooled demand for labour, this may also reflect the government's strict migration policy stance (see the supplementary information entitled "[Background to slowing employment growth in the United States](#Background-to-slowing-employment-growth-in-the-United-States)").**{#par-e9o4o4}
****Rising capacity utilisation in the** **economy could hamper further progress in disinflation**. Between September 2025 and January 2026, the year-on-year consumer price inflation rate fell markedly to 2.4 %, and price growth excluding energy and food also eased. However, inflation still exceeded the monetary policy target. Against this backdrop, the Federal Reserve lowered its target range for policy rates by 25 basis points to 3.5 %-3.75 % in December, citing risks to its employment mandate, but kept rates unchanged at the start of the new year.**{#par-io1o11}
{#par-o68743}
****
### **1.4 Japanese economy sluggish at end of year** {#tar-6}
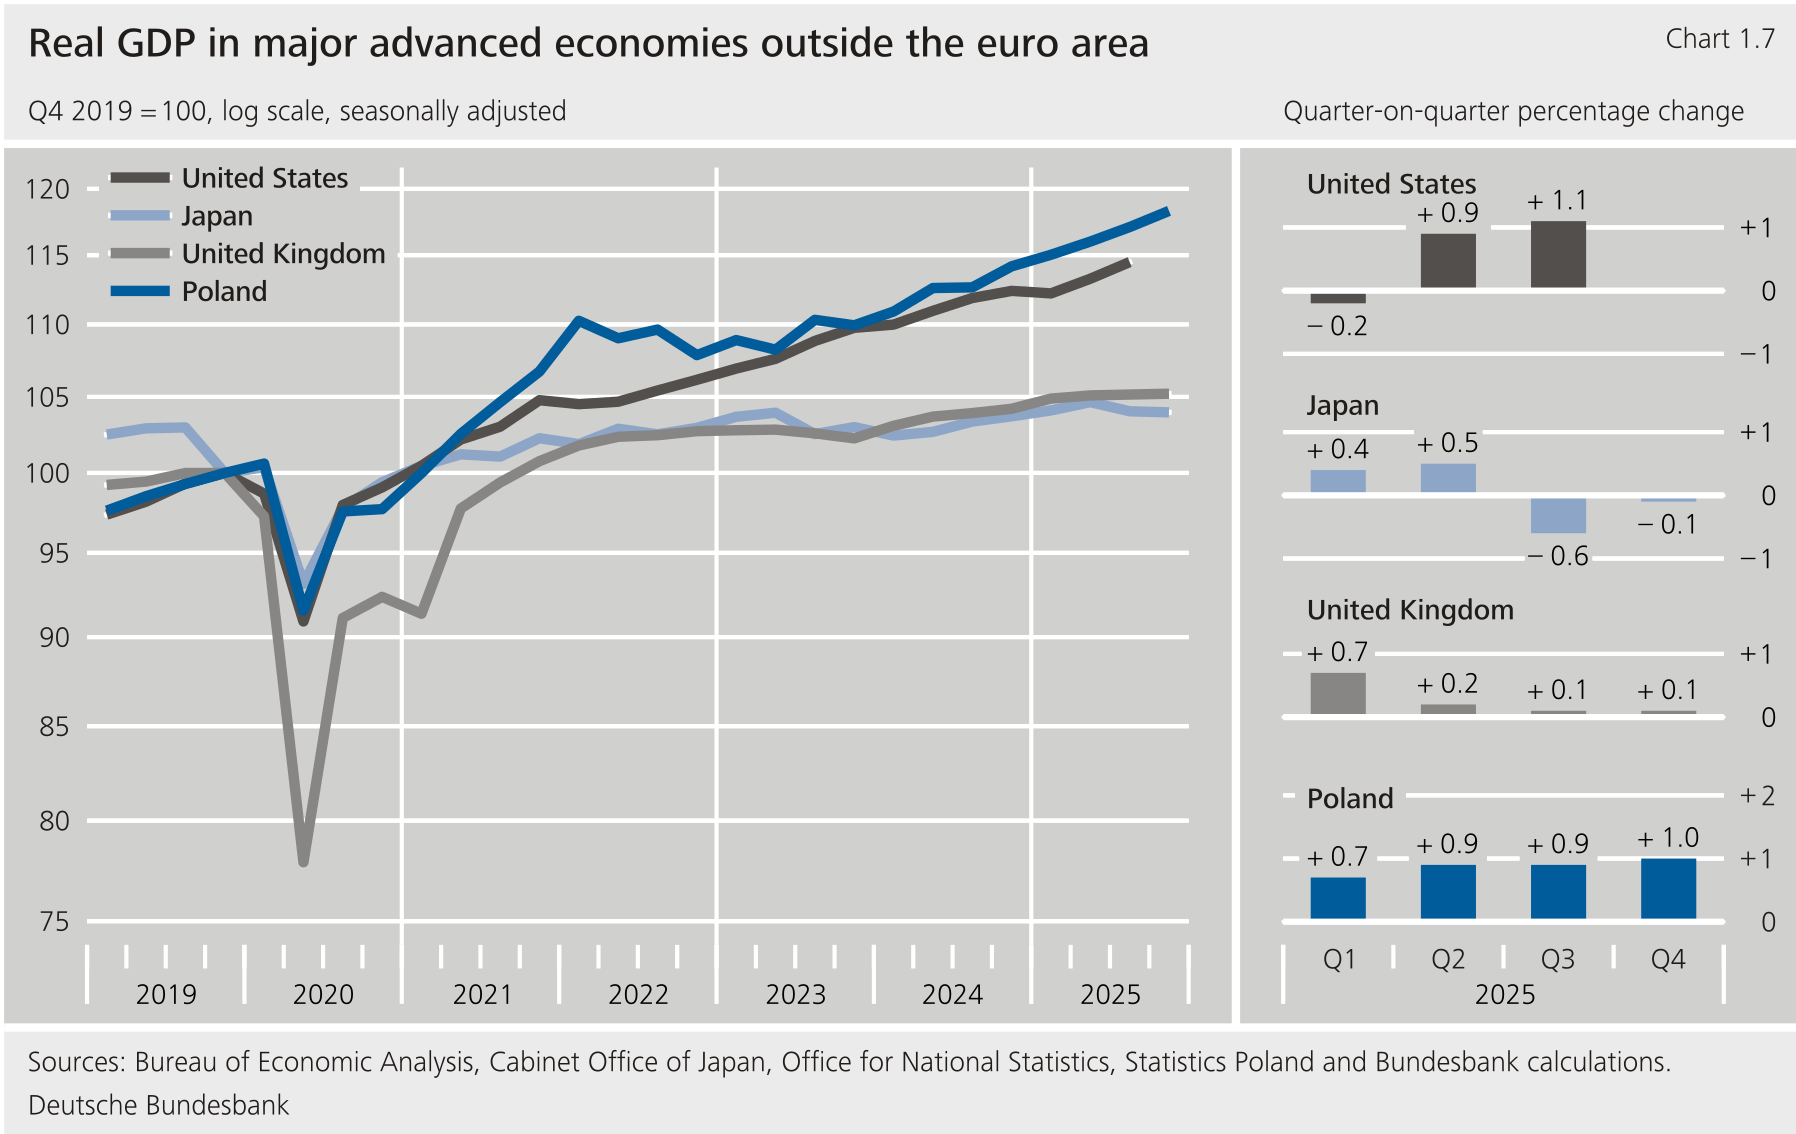
****The Japanese economy was sluggish at the end of 2025.** According to initial estimates, Japan's recorded a seasonally and price-adjusted increase of 0.1 % in the final quarter, compared with a 0.7 % decline in the previous quarter. Private consumption barely increased of late, probably due in part to purchasing power being eroded by relatively strong consumer price increases. Gross fixed capital formation picked up slightly after the decline in the preceding quarter. Imports and exports fell again slightly. Despite subdued economic activity, labour market conditions remained favourable, with the unemployment rate holding steady at 2.6 % in December. The year-on-year consumer price inflation rate declined markedly to 2.1 % in the same month, partly owing to a temporary increase in government fuel subsidies, while core inflation excluding energy and food remained stable at 1.5 %. In order to provide a permanent boost to consumer purchasing power, at the start of the year the Japanese parliament abolished the "provisional" fuel tax that had been in place for 50 years. The previously temporarily increased subsidies expired with the abolition of the tax. The government is also planning to exempt food from the . Fiscal measures providing relief coupled with dynamic wage growth should bolster real disposable incomes and, in turn, support domestic demand. Against this backdrop, the Japanese central bank raised its policy rate to 0.75 % in December. Expansionary fiscal policy, coupled with the continued normalisation of monetary policy, has recently stoked concerns on bond markets over Japan's fiscal sustainability. Yields on long-term Japanese government bonds rose markedly, while the yen depreciated significantly.**{#par-i33644}
### **1.5 Economic activity in the United Kingdom remains muted** {#tar-7}
****Economic output in the United Kingdom rose only slightly in the final quarter of 2025.** Seasonally and price-adjusted increased by 0.1 % quarter-on quarter, extending the modest upward trend that had begun in the second quarter. Developments across sectors were mixed. Manufacturing recovered markedly from the third quarter's decline. Activity stagnated in the economically important services sectors and contracted in construction. The labour market cooled significantly over the course of 2025, with the unemployment rate most recently remaining above 5 %, although wage growth stayed elevated into the fourth quarter, owing in particular to bonus payments. Consumer price inflation also failed to ease further towards the end of 2025. The year-on-year rate of the Harmonised Index of Consumer Prices () actually rose to 3.4 % in December, partly due to higher tobacco taxes, while the core rate stood at 3.2 %. Against this backdrop, the Bank of England opted not to cut rates further at the beginning of February, leaving its policy rate unchanged at 3.75 %.**{#par-ae75i5}
### **1.6 Renewed increase in economic output in Poland** {#tar-8}
****In Poland, economic growth remained strong in the fourth quarter.** According to preliminary data, real rose by 1.0 % quarter-on-quarter, matching the rate of the previous quarter, and amounting to 3.6 % on average for the year. The increase in industrial production weakened following the strong previous quarter, in line with the slightly declining exports to the euro area, while the quantitatively less significant exports to countries outside the euro area increased markedly. The services sector was the main driving force behind this growth. Construction also recovered, probably supported by lower financing costs and funds from the 's Recovery and Resilience Facility. On the expenditure side, growth appears to have been more broadly based than in the preceding quarter. Private consumption likely rose again slightly, while the previously strong expansion in investment and exports probably lost momentum. Inflation eased further to 2.2 % year-on-year. The National Bank of Poland continued to cut interest rates, lowering its key rate to 4.0 %.**{#par-o8596e}
**Background to slowing employment growth in the United States** {#tar-9}
-------------------------------------------------------------------------
****In the United States, employment growth slowed considerably in 2025**. In 2024, an average of around 122,000 new non-farm jobs were still being created each month, but by 2025, this figure had fallen to an average of just 15,000. This slowdown can be only partly explained by cuts in the previously rapidly expanding public sector. An equally significant factor was the marked deceleration in private sector employment growth. Although private companies stepped up hiring in January 2026, this was driven by only a few sectors, and a sustained acceleration in employment growth is yet to emerge.**{#par-a94671}
****One reason for subdued employment growth could be the reversal in immigration policy, which is constraining labour supply.** The new administration has pursued a restrictive approach to immigration policy since coming to power. Over the past twelve months, additional border security measures have been implemented, barriers to new asylum applications have been significantly raised, controls on immigrants already living in the country have been tightened and deportations have expanded.[\[1\]](#_ftn_44fa97b4_1) Restrictions on visa programmes have also made legal immigration more difficult.[\[2\]](#_ftn_44fa97b4_2) Taken together, these measures have had a major impact on immigration statistics.[\[3\]](#_ftn_44fa97b4_3) According to the monthly labour market statistics, the number of foreign-born people of working age in January 2026 was 700,000 lower than just a year earlier. However, this estimate is likely to overstate the actual impact of migration policy on population trends. Many people with a migrant background have stopped participating in the regular surveys conducted by the statistical authorities, possibly for fear of personal repercussions.[\[4\]](#_ftn_44fa97b4_4) A more reliable picture is likely to be provided by analyses from the Congressional Budget Office (), an independent agency of Congress, which point to significantly slower, but still slightly positive, net immigration. According to these estimates, net immigration to the United States amounted to just under half a million people in 2025, and only a marginally higher figure is expected for the current year. Between 2022 and 2024, net immigration to the United States amounted to around 3 million people per year.[\[5\]](#_ftn_44fa97b4_5)**{#par-o91i5a}
{#par-i9a2u2}
**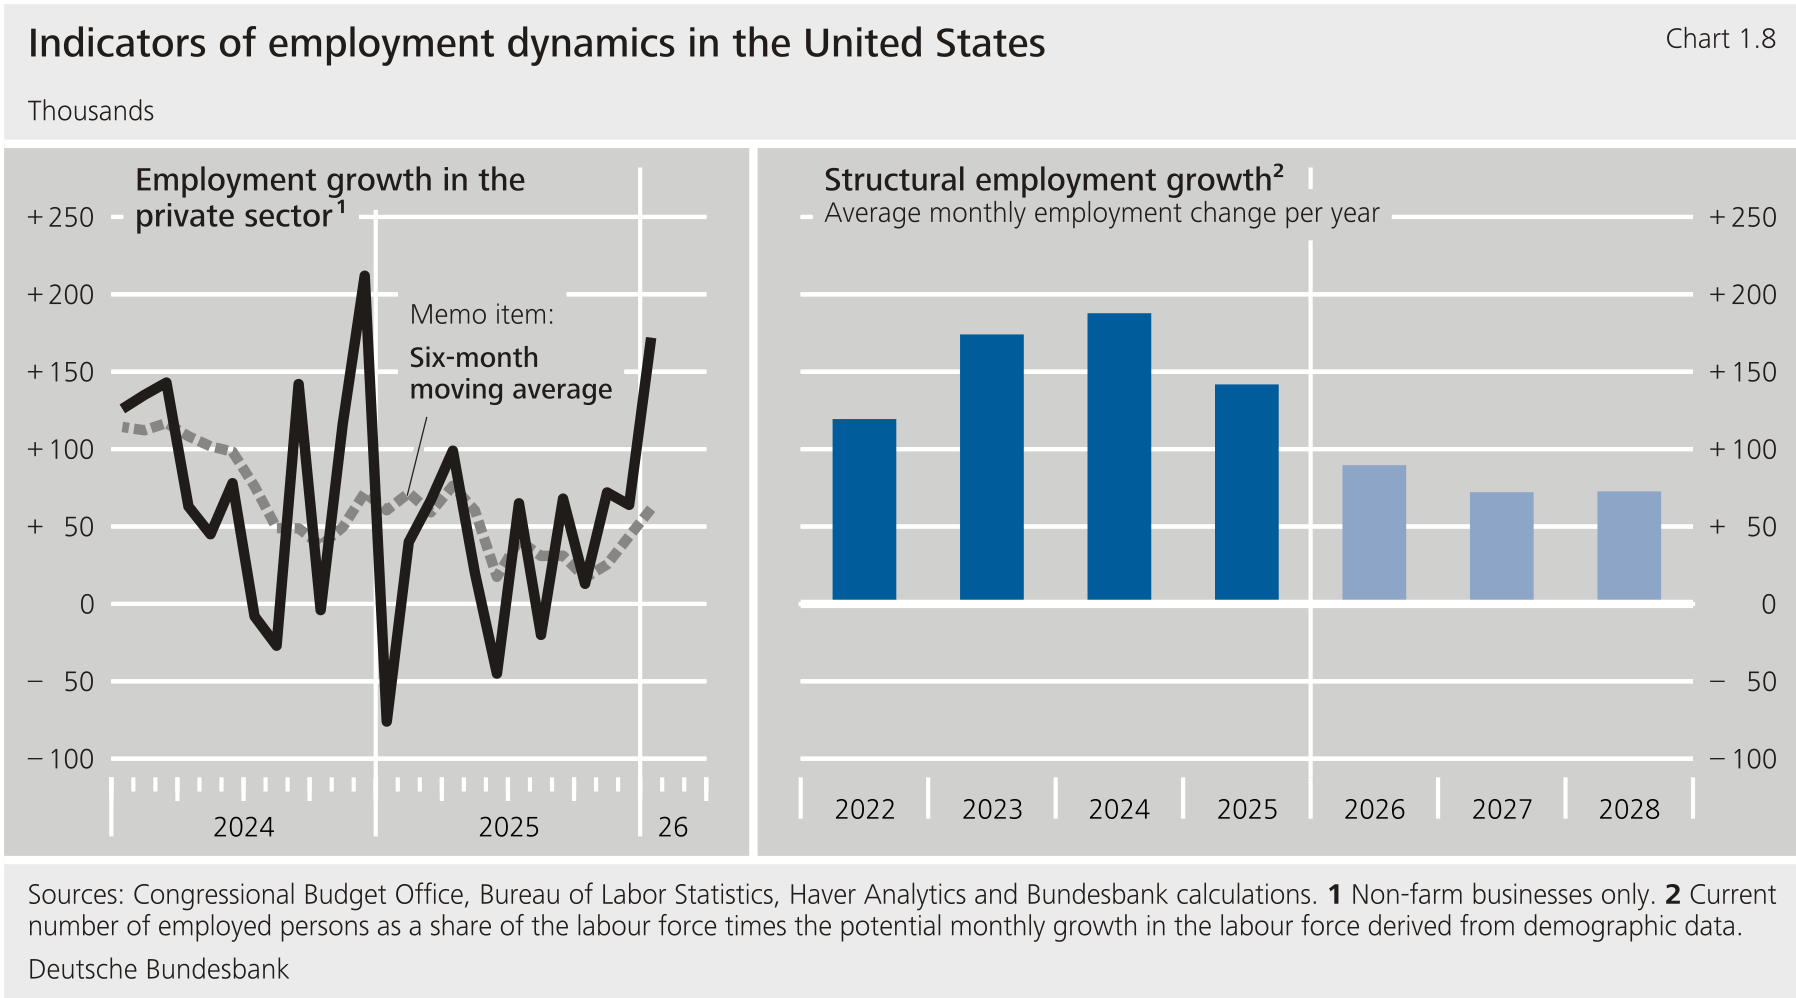**
****Structural employment growth is likely to have halved in recent years, mainly due to reduced immigration.** According to projections, the average annual growth rate of the working-age population will slow from 1.4 % in 2024 to 1 % last year and just under 0.7 % this year. Labour force participation could also come under slight pressure, as it is above average amongst immigrants.[\[6\]](#_ftn_44fa97b4_6) The labour force is therefore likely to expand much more slowly than in the recent past,[\[7\]](#_ftn_44fa97b4_7) narrowing the scope for tension-free employment growth. While this was estimated at 190,000 people per month in 2024, it is expected to fall to just over 90,000 people this year.[\[8\]](#_ftn_44fa97b4_8) Some third-party analyses consider even sharper cuts in immigration to be possible, potentially leading to the complete disappearance of structural employment gains as early as 2026.[\[9\]](#_ftn_44fa97b4_9)**{#par-a14a8i}
****In addition, employment growth may recently have fallen somewhat short of its demographic potential.** Alongside weaker growth in labour supply, a deterioration in labour demand is also likely to have contributed to the slowdown in employment growth.[\[10\]](#_ftn_44fa97b4_10) The slight increase in the unemployment rate over the course of last year also suggests this.[\[11\]](#_ftn_44fa97b4_11) At the same time, the number of job vacancies fell markedly once again. Wage growth remained elevated in a medium-term comparison but has also slowed somewhat recently. Against this backdrop, surveyed households assessed their employment prospects less favourably than at the beginning of 2025. Layoffs in the public sector and the still relatively tight monetary policy, but also volatile and restrictive trade policies, are likely to have contributed to the weakening of labour demand. By contrast, the growing use of artificial intelligence in companies is unlikely to have had any major impact on labour demand thus far.[\[12\]](#_ftn_44fa97b4_12)**{#par-uoe685}
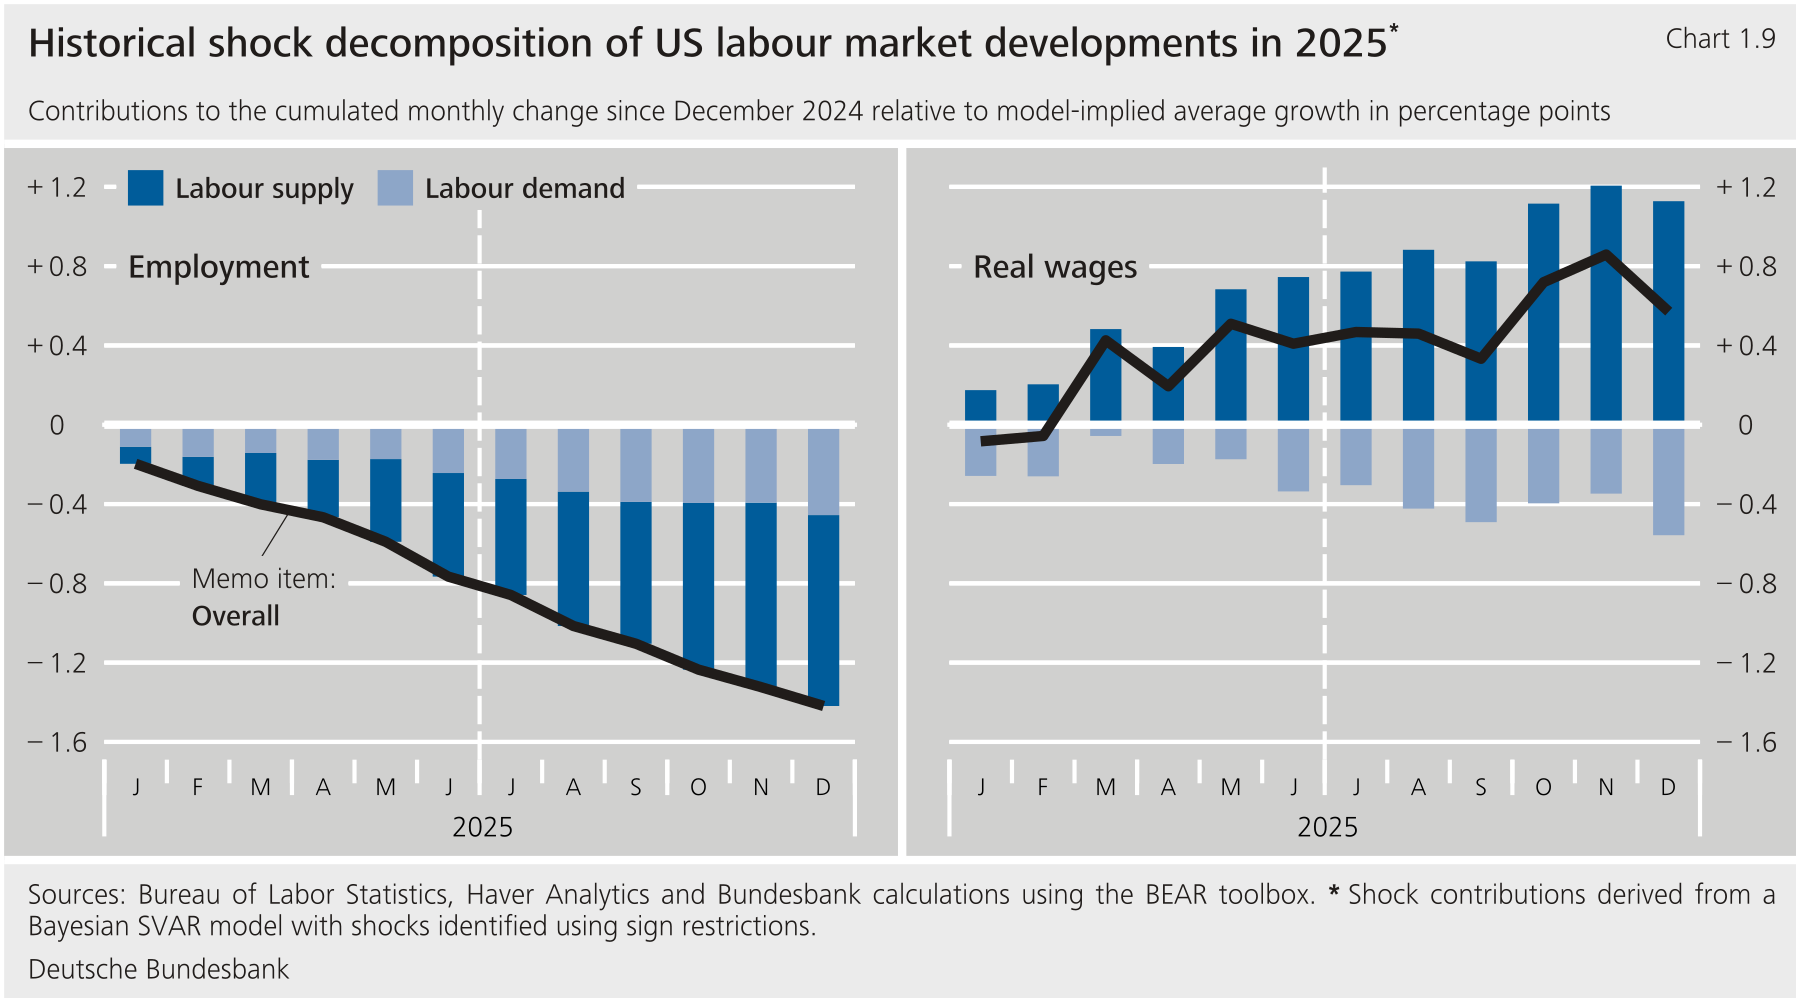
****Empirical analysis also suggests that job growth in the United States has recently been held back by a combination of constrained labour supply and weaker labour demand.** A shock decomposition based on a Bayesian model attributes around two-thirds of the slowdown in employment growth in 2025 to supply-side factors and one-third to demand-side factors.[\[13\]](#_ftn_44fa97b4_13) The slight predominance of supply-side factors thus explains why employees still saw above-average real wage gains despite subdued labour demand.[\[14\]](#_ftn_44fa97b4_14)**{#par-ei8u65}
****On balance, however, labour market conditions in the United States remain solid despite some cooling.** This follows a period of pronounced labour shortages. The unemployment rate has recently returned to a level consistent with normal labour market utilisation. Given that the slowdown in employment growth is partly structural, the unemployment rate is also likely to remain the best indicator for assessing labour market trends going forward.**{#par-ue5255}
{#par-a62573}
****
1. **{#_ftn_44fa97b4_1} As early as its first few days in office, the new government was using executive orders to introduce sweeping measures to limit "unauthorised" migration. General entry bans were imposed on nationals of certain countries. Furthermore, additional funding for border security and the Immigration and Customs Enforcement agency was provided midway through 2025 as part of a major spending package. See The White House (2025a, 2025b, 2025c).**
{#par-ei835u}
2. **{#_ftn_44fa97b4_2} A review of all visa programmes was initiated back in January 2025. Amongst other new measures, fees charged for certain work visas were increased significantly from September onwards. See The White House (2025d, 2025e).**
{#par-auu14a}
3. **{#_ftn_44fa97b4_3} In 2025, only 60,000 people legally crossed official border checkpoints to apply for asylum or immigration proceedings in the United States, compared with nearly one million in 2024. The number of people allowed to remain in the country at least temporarily after crossing the border illegally also declined drastically, while the number of deportations increased markedly. See Congressional Budget Office (2026a).**
{#par-oiee84}
4. **{#_ftn_44fa97b4_4} See Bick and Bloodworth II (2025).**
{#par-e52a63}
5. **{#_ftn_44fa97b4_5} See Congressional Budget Office (2026a).**
{#par-o9a4a2}
6. **{#_ftn_44fa97b4_6} See Congressional Budget Office (2024, 2025).**
{#par-i5464a}
7. **{#_ftn_44fa97b4_7} Calculations of structural employment growth rely on the 's estimated potential labour force participation rate, which is projected to fall slightly from 62.5 % in 2022 to 62.3 % in 2028. See Congressional Budget Office (2026b).**
{#par-euia12}
8. **{#_ftn_44fa97b4_8} Structural employment growth is defined here as the product of the current employment rate and the potential growth of the labour force, which in turn is estimated using demographic data and assumptions about labour force participation. For methodological information, see Gregory and Bick (2025).**
{#par-i8u132}
9. **{#_ftn_44fa97b4_9} See Edelberg et al. (2026).**
{#par-e4o1aa}
10. **{#_ftn_44fa97b4_10} This view is widely shared. Analyses by the Federal Reserve Bank of San Francisco likewise point to a weakening of both labour supply and demand. Estimates by the Federal Reserve Bank of Minneapolis suggest that around 40 % to 60 % of the slowdown in employment growth is attributable to lower immigration, evidenced, amongst other things, by the fact that the deceleration in employment momentum is broadly based across sectors. However, sectors with a particularly high share of workers with a migrant background made no contribution to job growth in 2025. See Bengali et al. (2026) and Mongey (2025).**
{#par-u5e6i7}
11. **{#_ftn_44fa97b4_11} The unemployment rate had already risen in 2024 as the previously exceptionally strong labour market began to normalise. Meanwhile, economic growth remained robust at the time, partly due to strong immigration. See Deutsche Bundesbank (2024).**
{#par-e7365i}
12. **{#_ftn_44fa97b4_12} See Atkinson and Yamco (2026) and Gimbel et al. (2026).**
{#par-ou7717}
13. **{#_ftn_44fa97b4_13} In addition to employment growth, the model includes the rate of change in real wages in the United States. Supply and demand shocks are identified using sign restrictions. The model is estimated using monthly data for the period from January 2010 to December 2025. For a similar approach, see Brinca et al. (2021).**
{#par-uu42e1}
14. **{#_ftn_44fa97b4_14} This assessment largely aligns with the latest findings of a similar analysis by researchers at the Federal Reserve. See also Cascaldi-Garcia and Morales-Jiménez (2026).**
{#par-e8ui39}
**2 Continued moderate growth in the euro area** {#tar-10}
----------------------------------------------------------
****The euro area economy expanded again in the final quarter of 2025.** According to Eurostat's flash estimate, real increased by 0.3 % quarter-on-quarter in the fourth quarter of 2025, or even somewhat more strongly excluding Ireland.[\[5\]](#_ftn_root_5) According to the flash estimate, calendar-adjusted real grew by 1.5 % (or 1.0 % without Ireland) overall in 2025, meaning that the economy in the euro area performed slightly better than had been expected given the trade conflicts. This resilience is likely to have been supported by more favourable energy and commodity prices, improved financing conditions, a stable labour market and, later in the year, expectations of higher spending on infrastructure and defence. However, the strong annual result also points to a solid underlying trend.**{#par-uooa1a}
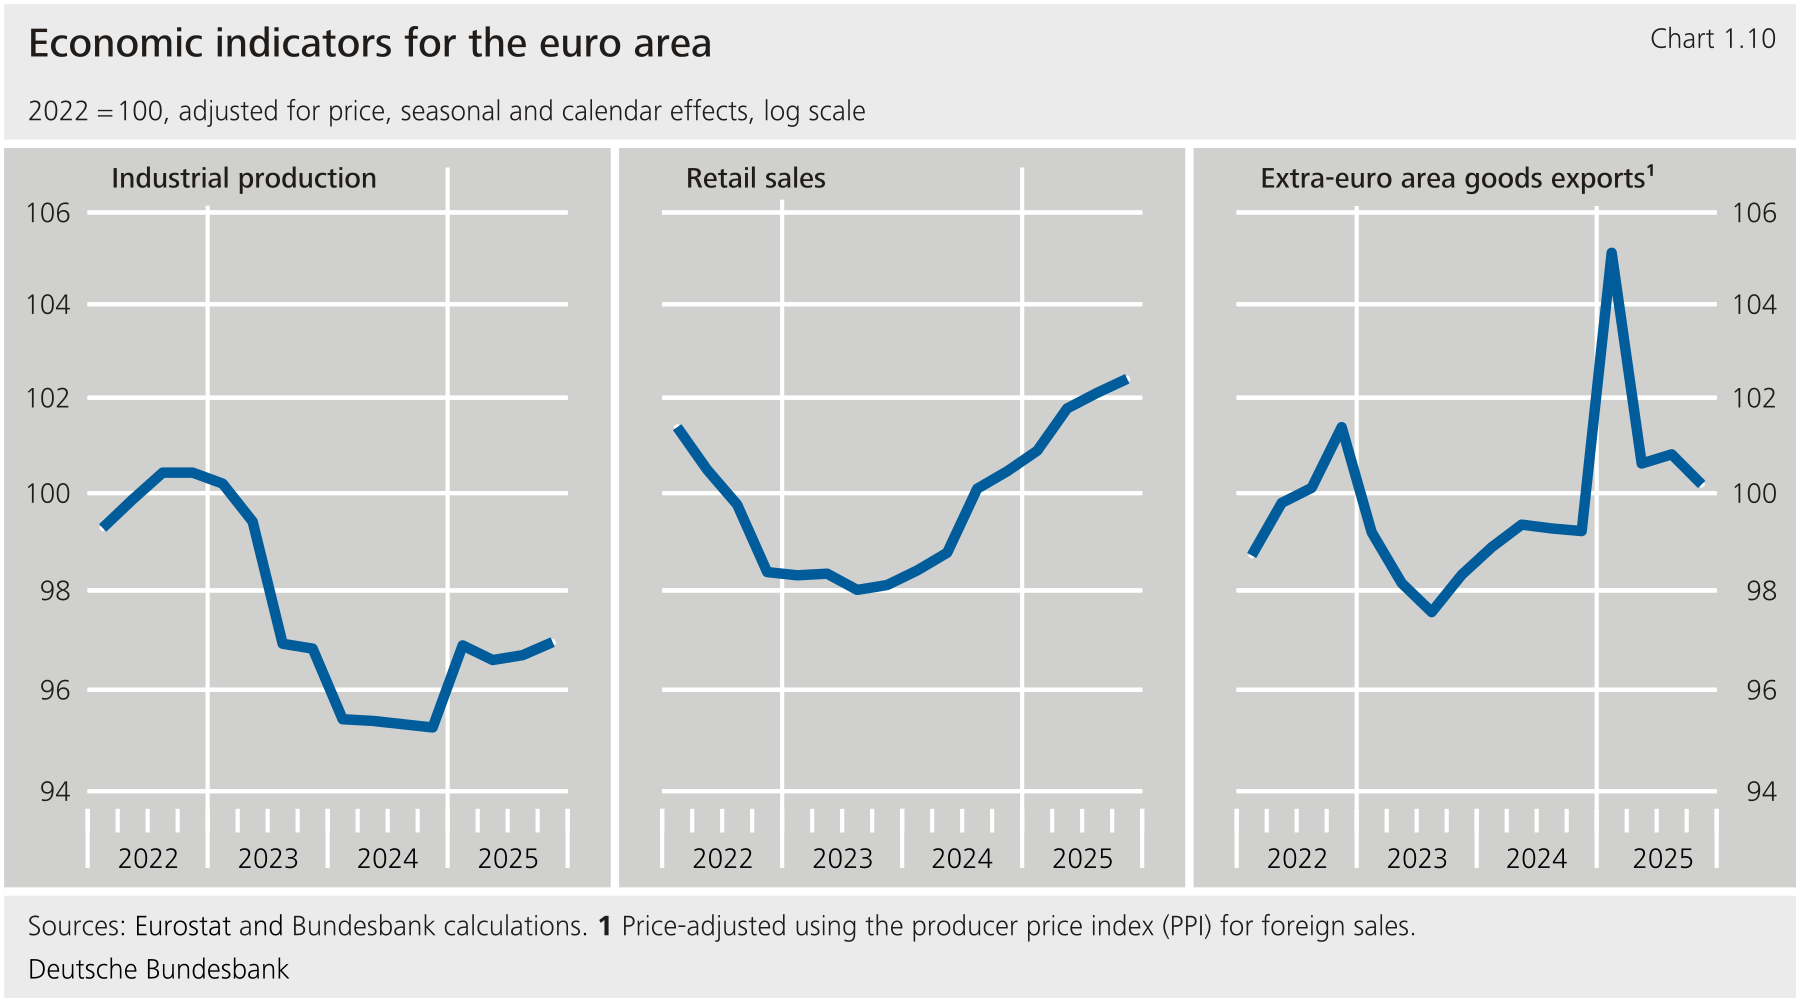
****Private consumption picked up noticeably towards the end of the year.** Retail sales rose moderately and motor vehicle registrations recorded another significant increase. Turnover in the hospitality sector also grew strongly in the first two months of the final quarter. The strengthening of private consumption coincided with a further improvement in consumer confidence, driven in particular by a markedly brighter outlook for the general economic situation as well as slightly improved expectations regarding households' own financial circumstances. This was consistent with continued favourable income growth alongside still moderate inflation rates.**{#par-a91uea}
****Investment activity is likely to have risen further in the past quarter** .[\[6\]](#_ftn_root_6) Construction output recorded a significant rise on average in October and November, driven mainly by an expansion in civil engineering, where infrastructure investment is evidently continuing to support growth. Residential construction, by contrast, stagnated over the same period, although there are signs that this trend may have bottomed out, as the number of building permits for residential properties has risen steadily since the beginning of 2025. Machinery and equipment investment probably expanded again, with domestic sales of capital goods producers rising markedly in real terms in October and November and imports of capital goods posting a small increase. Expenditure on information and communication technologies, as well as on intellectual property products, are likely to have continued to increase on the back of the digitalisation trend.**{#par-e9544e}
****Goods exports to third countries fell markedly.** In addition to the dampening effects of exchange rates, the increase in tariffs is likely to have weighed on foreign trade: exports to the United States fell sharply and were 15 % below the 2024 annual average. Exports to the United Kingdom also declined somewhat. Exports to other countries held up considerably better, particularly to European countries outside the euro area. Exports to China were also up. By product category, the weakness in exports mainly affected intermediate and capital goods. Car exports continued their downward trend, while exports of consumer goods rose slightly. According to balance of payments data, euro area services exports increased somewhat up to November. Imports of goods from third countries fell slightly in the fourth quarter in price-adjusted terms. The slowdown was particularly pronounced for intermediate and consumer goods, while there was a small increase for capital goods.**{#par-o5oi45}
****Manufacturing activity rose moderately in the fourth quarter.** Capital goods production increased despite the slight decline in motor vehicle production. The output of intermediate goods and durable goods also expanded. By contrast, the output of non-durable goods fell markedly, chiefly owing to a downturn in pharmaceutical products. Despite the rise in production, industrial capacity utilisation fell further below its long-term average. According to European Commission surveys, new orders have once again exceeded their long-term average, while order backlogs from both domestic and foreign customers remain well below their long-term average. While higher tariffs in the United States and the weakened competitiveness of European firms in global markets are likely to continue to weigh on activity, companies' competitive position within the single market has improved somewhat over the past year, according to surveys. Price pressures at the producer level eased thanks to lower energy prices. Producer prices fell slightly compared with the previous year, while import prices declined significantly.**{#par-u7e7iu}
{#par-e2uii9}
****
****Expansion in the services sector continued.**Business activity is likely to have increased noticeably in the hospitality sector, and probably also rose in the information and communications sector as well as in business services. It declined only in real estate and in transportation and storage, with the latter weakness likely linked to subdued imports and exports. According to European Commission surveys, almost half of the service providers surveyed currently report no constraints on their business activity, and they complained about insufficient demand less frequently than the long-term average, although labour shortages continue to weigh on parts of the services sector.**{#par-ao3iai}
****Economic output rose in most Member States.**In many places, consumer demand improved and tourism also supported economic activity in view of the travel season being extended into October. In addition, manufacturing also picked up in several Member States despite generally weak exports to non-euro area countries.**{#par-o4686e}
****In France, economic growth lost momentum towards the end of the year.** According to initial estimates, real rose by 0.2 % in the fourth quarter, down from 0.5 % in the previous quarter, bringing growth for 2025 as a whole to 0.9 %. The slowdown mainly reflected weaker investment, with machinery and equipment spending even declining markedly, and although exports, particularly in aviation and shipping, continued to rise briskly, this was accompanied by a significantly negative contribution from inventory reduction. Imports recorded a substantial decline. By contrast, private consumption strengthened noticeably after a prolonged period of weakness. On the production side the slowdown was broad-based. Services activity increased only slightly and construction activity stagnated. Manufacturing edged down after a strong rise in the previous quarter.**{#par-a5a5u6}
{#par-a74489}
**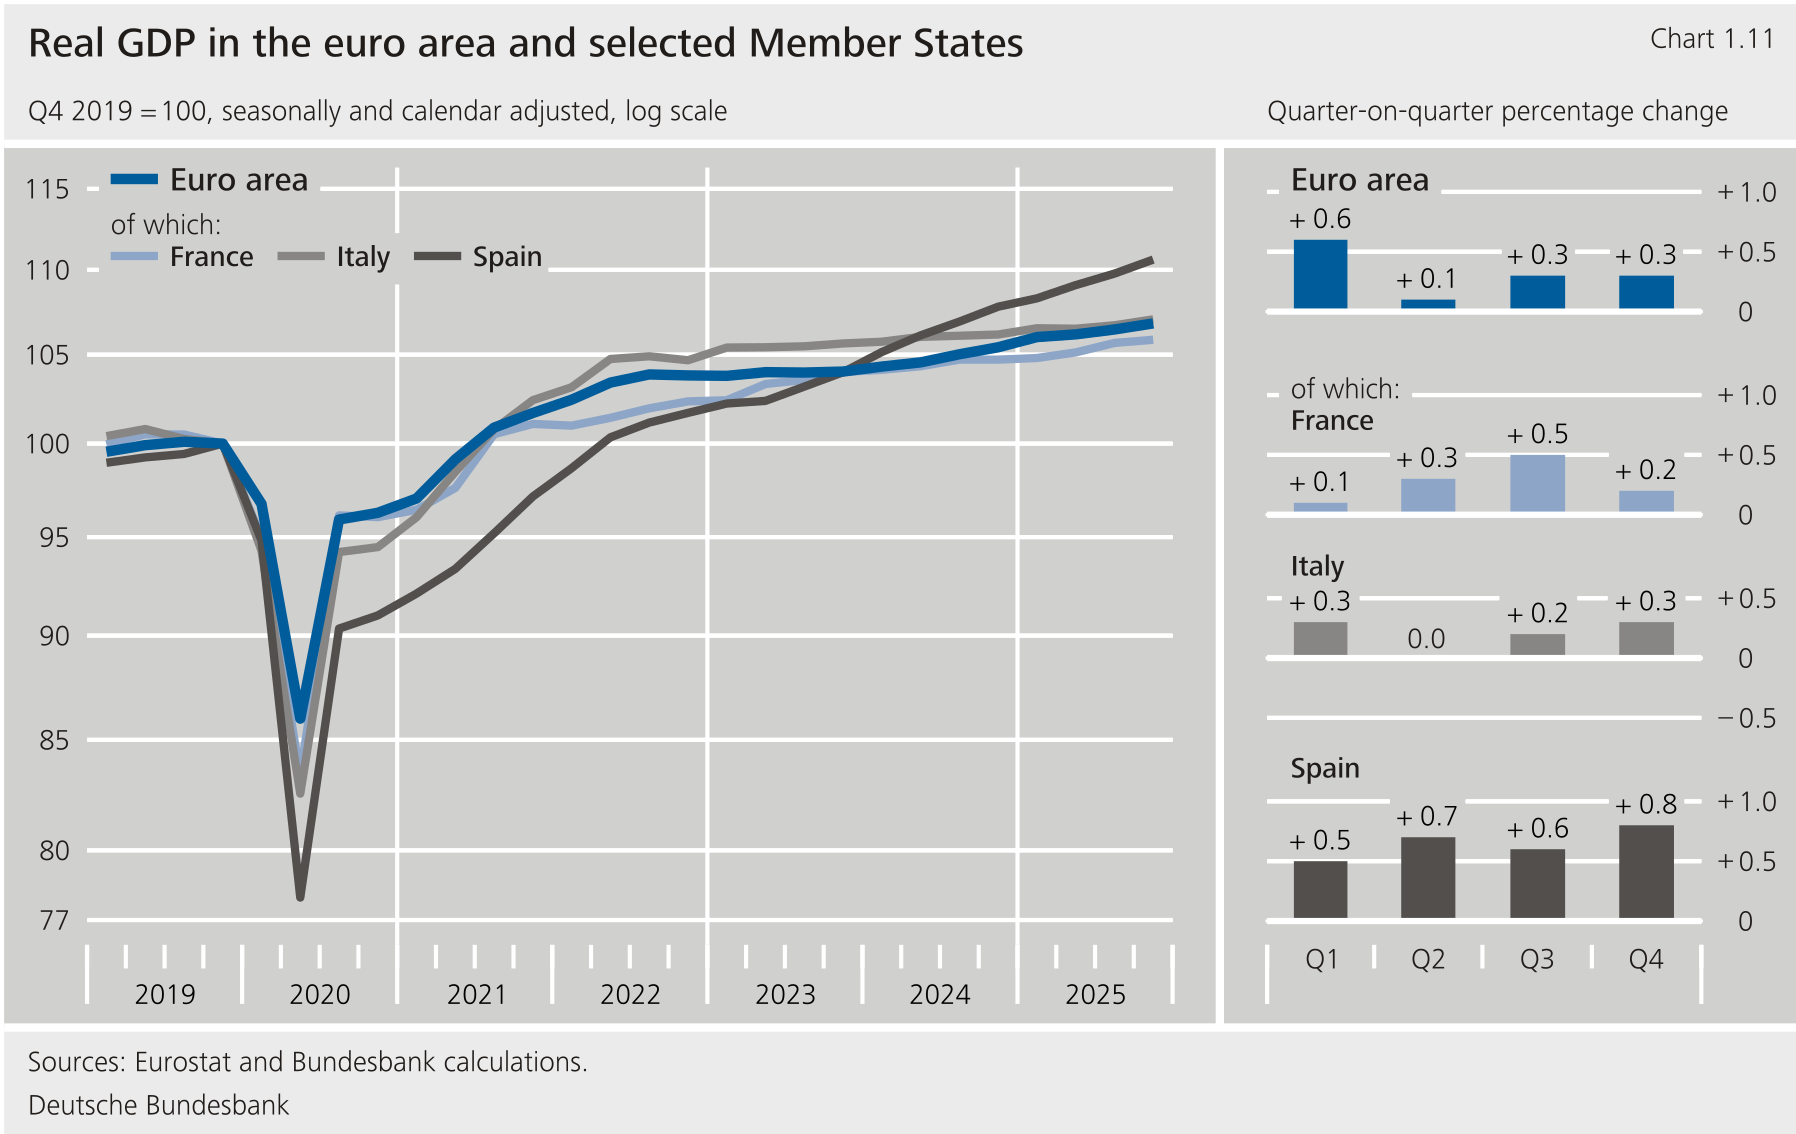**
****In Italy, growth strengthened towards the end of the year.** According to provisional data, real rose by 0.3 % in the fourth quarter, following an increase of 0.2 % in the third quarter. Overall growth for 2025 amounted to 0.7 %. Positive contributions in the fourth quarter probably came mainly from private consumption, supported by a robust labour market and higher disposable incomes. Investment also appears to have increased again. Goods exports likely made only a small contribution to growth. On the production side, activity rose, particularly in manufacturing.**{#par-u3uu51}
****The Spanish economy continued to grow strongly.** According to initial estimates, real rose by 0.8 % in the fourth quarter following 0.6 % in the previous quarter, bringing overall growth for 2025 to 2.8 %. Domestic demand remained buoyant towards the end of the year, as investment activity maintained the very rapid pace recorded in the previous quarter and private consumption again increased sharply. Exports of goods and services recovered after declining in the third quarter. Tourism is likely to have played a key role in this. Imports rose strongly once more in line with dynamic domestic demand. On the production side, construction activity strengthened and services continued to expand vigorously, while manufacturing lost noticeable momentum.**{#par-e5a494}
****The picture for the remaining Member States was mixed.** Real rose markedly in several countries, including the Netherlands, Portugal and Lithuania. In Finland, too, there was distinct growth following a prolonged period of weakness. By contrast, real in Belgium and Austria grew only slightly, while in Estonia it remained stagnant at the level of the previous quarter. Real in Ireland declined somewhat again.[\[7\]](#_ftn_root_7)**{#par-i745ua}
****Labour market conditions remained stable in the fourth quarter of 2025.**Employment increased slightly again, and the unemployment rate remained low at 6.3 %, virtually unchanged since the middle of 2024. Nevertheless, there are still clear signs of a slump in some Member States, notably Germany and France. According to European Commission surveys, labour shortages continued to ease, although they remained above the long-term average, and the job vacancy rate has declined continually since its peak in 2022. Following the pronounced slowdown in wage growth up to mid-2025, growth in gross wages per employee is likely to have eased only slightly in the fourth quarter and to have remained at an elevated level. Persistently strong wage growth in Germany made a noticeable contribution to this.**{#par-i2o1ue}
****The rise in consumer prices slowed somewhat in the fourth quarter of 2025.** The rose by 0.5 % quarter-on-quarter in seasonally adjusted terms, compared with 0.6 % in the third quarter. This was primarily due to weaker price increases for goods. Food inflation was the lowest in six quarters, and prices for non-energy industrial goods were unchanged. These developments likely reflect the appreciation of the euro. By contrast, there is no evidence of a significant dampening effect on prices stemming from a diversion of Chinese exports into the euro area as a result of tariff policy. Energy prices declined slightly, while services prices continued to rise strongly and even somewhat faster than in the previous quarter.**{#par-i5ee31}
{#par-u37185}
**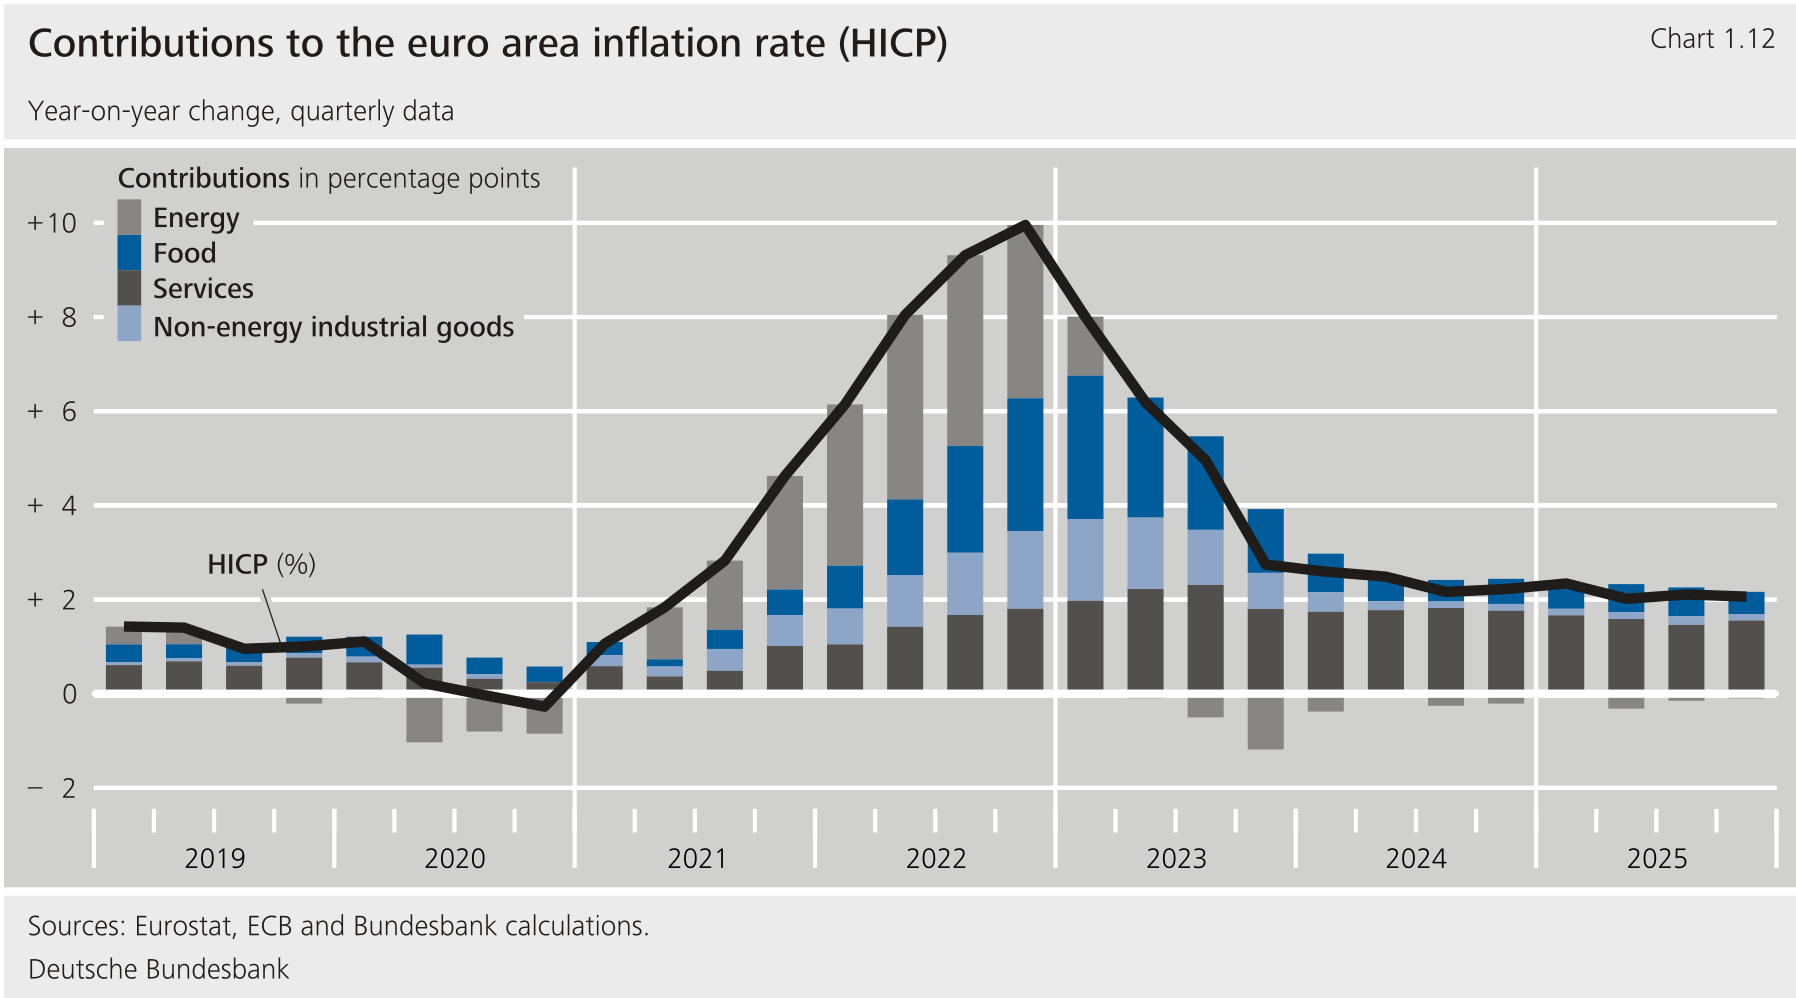**
****Year-on-year inflation remained at 2.1 % in the fourth quarter of 2025.** This was attributable to conflicting trends. Energy prices fell less sharply than in the third quarter, while the inflation rate for food declined by 0.6 percentage points to 2.5 %. Among the less volatile components, inflation in non-energy industrial goods eased to 0.5 %, whereas services inflation rose to 3.4 %. This caused core inflation (excluding energy and food) to edge up slightly to 2.4 %, still well above its longer-term average.**{#par-o665u8}
****The average inflation rate in 2025 fell to 2.1 %.**The core rate likewise declined further to 2.4 %. This reflected reduced price pressures for many commodities, the appreciation of the euro, slower growth in unit labour costs and the lagged effects of restrictive monetary policy. The gap between goods and services inflation remained unusually wide at 2.8 percentage points, compared with a long-term average difference of only about 1 percentage point. Energy made a negative contribution for the third time in a row, prices for non-energy industrial goods again rose by less than 1 % and food inflation stabilised close to its long-term average of just under 3 %. Although services inflation eased somewhat in 2025, it remained well above 3 %.**{#par-e46a1o}
****According to Eurostat's flash estimate, inflation fell markedly in January 2026.** Energy prices recorded another significant decline owing to a temporary drop in energy commodity prices, and services inflation also eased. By contrast, the other components rose at rates similar to those observed in December or slightly faster. Overall, headline inflation stood at 1.7 % and the core rate also edged down to 2.2 %. The substantial methodological changes to the introduced with the January reporting month appear not to have had any significant impact on the path of inflation rates (see the supplementary information entitled "[Recent technical adjustments to the Harmonised Index of Consumer Prices](https://publikationen.bundesbank.de/publikationen-en/reports-studies/monthly-reports/monthly-report-february-2026-988816?article=the-german-economy-988810#Recent-technical-adjustments-to-the-Harmonised-Index-of-Consumer-Prices)" in the section "The German economy").**{#par-a6827o}
{#par-ee6uo3}
**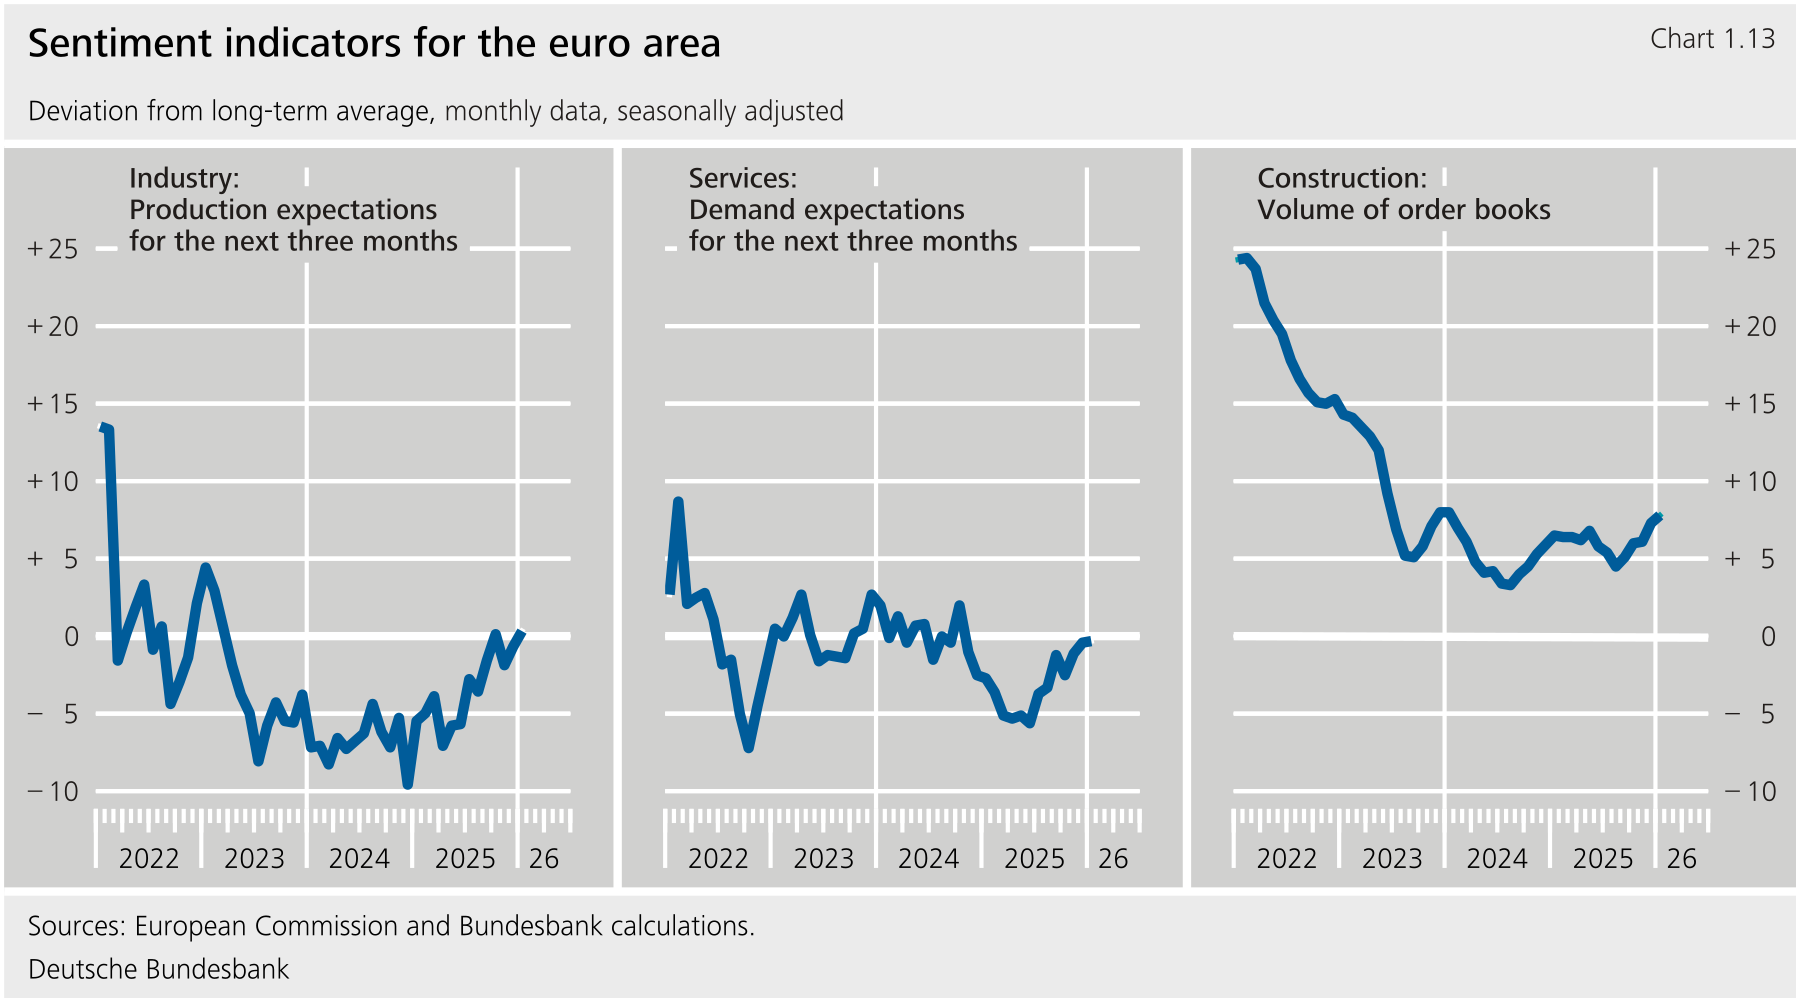**
****Economic activity in the euro area is expected to expand again moderately in the first quarter of 2026.** Sentiment indicators available up to January point to improved production expectations for the next few months in both manufacturing and services. In addition, prospects in construction have brightened thanks to improved order books. Consumer confidence also rose slightly but remained cautious overall. Households are still reluctant to make major purchases and maintain a high propensity to save, even though they now assess their own financial situation very positively. Private consumption is therefore likely to continue expanding. Exports should benefit from the continued robust global economy but will be held back by higher tariffs in the important market and the effective appreciation of the euro against a broad range of trading partners. Economic activity is also likely to be supported by private and public investment in digital transformation, energy and commodity security, defence, and climate adaptation. Nevertheless, private investment is likely to strengthen only gradually given the many challenges and uncertainties. Overall, output in the next few months is expected to continue expanding broadly in line with potential growth. The euro area labour market is likely to remain robust, with unemployment low by long-term standards and employment rising slightly.**{#par-a2252e}
**List of references** {#tar-11}
--------------------------------
**Abelianski, A., A. Breitenfellner and N. Dzubur (2025), [--Mercosur deal: a subtle tradeoff in growth, emissions and global cooperation, Oesterreichische Nationalbank, Bulletin, /2025](https://www.oenb.at/Publikationen/Volkswirtschaft/bulletin/2025/q4-25/q4-25-3.html), pp. 62‑83.**{#par-i7i68o}
**Atkinson, T. and S. Yamco (2026), [Young workers' employment drops in occupations with high exposure](https://www.dallasfed.org/research/economics/2026/0106), Federal Reserve Bank of Dallas, 6 January 2026.**{#par-a9e552}
**Baur, A., L. Flach and I. Gourevich (2025), [Global Europe 2.0 -- Ökonomische Potenziale einer neuen europäischen Freihandelsoffensive](https://www.ifo.de/DocDL/202511-ifo-studie-global-europe-freihandel.pdf), Institut, Center for International Economics, Study No 11/2025.**{#par-a851u4}
**Bengali, L., I. Chen and A. New-Schmidt (2026), [The Recent Slowdown in Labor Supply and Demand](https://www.frbsf.org/research-and-insights/publications/economic-letter/2026/01/recent-slowdown-in-labor-supply-and-demand/), Federal Reserve Bank of San Francisco, Economic Letter, No 2026‑02.**{#par-ua32a9}
**Bernard, S., L. de Greef, I. Hurst, A. I. Kaya, I. Liadze and B. Naisbitt (2024), [The Effects of Higher Tariffs](https://niesr.ac.uk/publications/effects-higher-us-tariffs?type=global-economic-outlook-topical-feature), National Institute of Economic and Social Research, Global Economic Outlook Topical Feature, October 2024, pp. 64‑77.**{#par-o27154}
**Bick, A. and K. Bloodworth II (2025), [What Is Affecting the Data on Shifts in Immigrant and Native-Born Populations?](https://www.stlouisfed.org/on-the-economy/2025/dec/what-is-affecting-cps-data-shifts-immigration-native-born-populations) , Federal Reserve Bank of St. Louis, On the Economy Blog, 29 December 2025.**{#par-i74o51}
**Brinca, P., J. B. Duarte and M. Faria-e-Castro (2021), [Measuring labor supply and demand shocks during -19](https://www.sciencedirect.com/science/article/pii/S0014292121002130), European Economic Review, Vol. 139, October 2021.**{#par-e4499a}
**Cascaldi-Garcia, D. and C. Morales-Jiménez (2026), [Model Perspectives on Supply and Demand Factors behind a Soft Labor Market](https://www.federalreserve.gov/econres/notes/feds-notes/model-perspectives-on-supply-and-demand-factors-behind-a-soft-labor-market-20260130.html), Board of Governors of the Federal Reserve System, FEDS Notes, 30 January 2026.**{#par-uaoa4o}
**Congressional Budget Office (2026a), [The Demographic Outlook: 2026 to 2056](https://www.cbo.gov/publication/61879), 7 January 2026.**{#par-oo4688}
**Congressional Budget Office (2026b), [The Budget and Economic Outlook: 2026 to 2036](https://www.cbo.gov/publication/61882), 11 February 2026.**{#par-o9ie57}
**Congressional Budget Office (2025), ['s Current View of the Economy From 2025 to 2028](https://www.cbo.gov/publication/61738), 12 September 2025.**{#par-a16747}
**Congressional Budget Office (2024), [Effects of the Immigration Surge on the Federal Budget and the Economy](https://www.cbo.gov/publication/60569), 23 July 2024.**{#par-o63517}
**Deutsche Bundesbank (2025), [Global and European setting](https://publikationen.bundesbank.de/content/970800), Monthly Report, November 2025.**{#par-i7o972}
**Deutsche Bundesbank (2024), [Global and European Setting](https://publikationen.bundesbank.de/content/943822), November 2024.**{#par-a8232o}
**Deutsche Bundesbank (2018), [Activities of multinational enterprise groups and national economic statistics](https://www.bundesbank.de/content/766598), Monthly Report, October 2018, pp. 65‑78.**{#par-eoii2e}
**Edelberg, W., S. Veuger and T. Watson (2026), [Macroeconomic implications of immigration flows in 2025 and 2026: January 2026 update](https://www.brookings.edu/articles/macroeconomic-implications-of-immigration-flows-in-2025-and-2026-january-2026-update/), Brookings Research, 13 January 2026.**{#par-ui3215}
**Gimbel, M., M. Kinder, J. Kendall and M. Lee (2026), [Evaluating the Impact of on the Labor Market: November/December Update](https://budgetlab.yale.edu/research/evaluating-impact-ai-labor-market-novemberdecember-cps-update), The Budget Lab at Yale, January 2026.**{#par-uo4452}
**Gregory, V. and A. Bick (2025), [Breakeven Employment Growth: A Simple but Useful Benchmark](https://www.stlouisfed.org/on-the-economy/2025/apr/breakeven-employment-growth-simple-useful-benchmark), Federal Reserve Bank of St. Louis, On the Economy Blog, 15 April 2025.**{#par-ao1892}
**Hagemejer, J., P.-T. Stoll, B. Rudloff and K. Mensah (2025), [An update on the economic, sustainability and regulatory effects of the trade part of the -Mercosur Partnership Agreement](https://www.europarl.europa.eu/RegData/etudes/STUD/2025/754476/EXPO_STU%282025%29754476_EN.pdf), Study requested by the Committee on International Trade of the European Parliament, June 2025.**{#par-iou6ie}
**Hantzsche, A., M. Lopresto and G. Young (2018), [Using NiGEM in uncertain times: Introduction and overview of NiGEM](https://niesr.ac.uk/publications/using-nigem-uncertain-times-introduction-and-overview-nigem?type=national-institute-economic-review), National Institute of Economic and Social Research, National Institute Economic Review, Vol. 244, pp. R1-R14.**{#par-ee4u15}
**Hinz, J., R. Langhammer, H. Mahlkow and V. Thakur (2026), [The --India Trade Deal: Strategic Diversification in an Era of Uncertainty,](https://www.kielinstitut.de/fileadmin/Dateiverwaltung/IfW-Publications/fis-import/b8c8f99b-1df5-4f59-b948-43bc8275d45d-KPB202.pdf) Kiel Institute for the World Economy, Kiel Policy Brief No 202.**{#par-e4828e}
**International Monetary Fund (2026), [World Economic Outlook Update: Global Economy: Steady amid Divergent Forces](https://www.imf.org/en/publications/weo/issues/2026/01/19/world-economic-outlook-update-january-2026), January 2026.**{#par-i3ie6u}
**Mongey, S. (2025), [Immigration can't explain declining employment growth](https://www.minneapolisfed.org/article/2025/immigration-cant-explain-declining-employment-growth), Federal Reserve Bank of Minneapolis, 31 October 2025.**{#par-eu42ea}
**The White House (2025a), [Protecting the American People Against Invasion](https://www.whitehouse.gov/presidential-actions/2025/01/protecting-the-american-people-against-invasion/), Presidential Action, 20 January 2025.**{#par-o7ueuo}
**The White House (2025b), [Securing our Borders](https://www.whitehouse.gov/presidential-actions/2025/01/securing-our-borders/), Presidential Action, 20 January 2025.**{#par-e4179i}
**The White House (2025c), [Restricting the Entry of Foreign Nationals to Protect the United States from Foreign Terrorists and Other National Security and Public Safety Threats](https://www.whitehouse.gov/presidential-actions/2025/06/restricting-the-entry-of-foreign-nationals-to-protect-the-united-states-from-foreign-terrorists-and-other-national-security-and-public-safety-threats/), Presidential Action, 4 June 2025.**{#par-e39uu5}
**The White House (2025d), [Protecting the United States from Foreign Terrorists and other National Security and Public Safety Threats](https://www.whitehouse.gov/presidential-actions/2025/01/protecting-the-united-states-from-foreign-terrorists-and-othernational-security-and-public-safety-threats/), Presidential Action, 20 January 2025.**{#par-euie64}
**The White House (2025e), [Restriction on Entry of Certain Nonimmigrant Workers](https://www.whitehouse.gov/presidential-actions/2025/09/restriction-on-entry-of-certain-nonimmigrant-workers/), Presidential Action, 19 September 2025.**{#par-e19254}
1. **{#_ftn_root_1} See International Monetary Fund (2026).**
{#par-u4ue58}
2. **{#_ftn_root_2} India had previously concluded trade agreements with the Member States and Australia involving extensive tariff reductions and had also reached an economic cooperation agreement with the United Kingdom. At the beginning of February, India reached a trade deal with the United States providing for a reduction in tariffs on Indian goods from 50 % to 18 %. In return, India apparently undertook to halt its oil purchases from Russia and instead source energy from the United States.**
{#par-eeaou7}
3. **{#_ftn_root_3} See Deutsche Bundesbank (2025).**
{#par-u9125i}
4. **{#_ftn_root_4} This is due to delays in the release of official statistics following the government shutdown in autumn 2025.**
{#par-e27e4a}
5. **{#_ftn_root_5} The statistical reporting of in Ireland is heavily influenced by the activities of multinational companies. See Deutsche Bundesbank (2018)**
{#par-i995ei}
6. **{#_ftn_root_6} Excluding Ireland. The statistical reporting of corporate investment overall, but particularly in the area of intellectual property, has been heavily influenced by the activities of multinational companies for many years now. See Deutsche Bundesbank (2018).**
{#par-e926i1}
7. **{#_ftn_root_7} Given the sharp increase at the beginning of the year and overall growth of just over 13 % in 2025, this decline reflects the volatile investment patterns of multinational enterprises.**
{#par-a13e57}
*[IMF]: International Monetary Fund
*[Q4]: fourth quarter
*[CPS]: Certification Practice Statement
*[AI]: artificial intelligence
*[VAT]: value added tax
*[FRBSF]: Federal Reserve Bank of San Francisco
*[**EU**]: European Union
*[EFTA]: Europäische Freihandelsassoziation
*[HICP]: Harmonised Index of Consumer Prices
*[EU]: European Union
*[COVID]: coronavirus disease
*[CBO]: Congressional Budget Office
*[GDP]: gross domestic product
*[OECD]: Organisation for Economic Co-operation and Development
*[SVAR]: structural vector autoregression
*[ifo]: economic research institution
*[CPB]: Central Planning Bureau
*[**IMF**]: International Monetary Fund
*[**US**]: United States
*[US]: United States