# The impact of demographic change on labour supply and growth in Germany – challenges and scope for action
* [*1 Introduction*](#tar-1 "1 Introduction")
* *[*Changed employment structure against the backdrop of weak labour market dynamics*](#tar-2 "Changed employment structure against the backdrop of weak labour market dynamics")*
* **[*2 Demographic change is reducing labour supply and weighing on economic growth*](#tar-3 "2 Demographic change is reducing labour supply and weighing on economic growth")
* *[*2.1 The potential labour force is shrinking for a variety of reasons*](#tar-4 "2.1 The potential labour force is shrinking for a variety of reasons")***
* ***[](#tar-5 "")***
* ***[](#tar-6 "")***
* ***[*Productivity and labour market effects of generative artificial intelligence in German enterprises*](#tar-7 "Productivity and labour market effects of generative artificial intelligence in German enterprises")
* *[*2.2 Demographic ageing is weighing on economic growth and productivity growth*](#tar-8 "2.2 Demographic ageing is weighing on economic growth and productivity growth")****
* ***[*Arithmetical contribution of demographic ageing to GDP growth*](#tar-9 "Arithmetical contribution of demographic ageing to GDP growth")***
* ***[](#tar-10 "")***
* ***[*3 Labour market-oriented immigration on the decline*](#tar-11 "3 Labour market-oriented immigration on the decline")***
* ***[](#tar-12 "")***
* ***[](#tar-13 "")***
* ***[*4 Levers for labour supply in Germany*](#tar-14 "4 Levers for labour supply in Germany")
* *[*4.1 Female labour force participation up thanks to part-time work*](#tar-15 "4.1 Female labour force participation up thanks to part-time work")****
* ***[](#tar-16 "")***
* ***[](#tar-17 "")
* *[*4.2 Part-time employment rate of older people high and rising*](#tar-18 "4.2 Part-time employment rate of older people high and rising")****
* ***[](#tar-19 "")
* *[*4.3 Build on labour market achievements*](#tar-20 "4.3 Build on labour market achievements")****
* ***[*5 Potential for higher labour input*](#tar-21 "5 Potential for higher labour input")***
* ***[](#tar-22 "")***
* ***[](#tar-23 "")***
* ***[*6 Economic policy implications*](#tar-24 "6 Economic policy implications")***
* ***[*Technical annex: Methodology for estimating the effects of demographic ageing on growth using regional data*](#tar-25 "Technical annex: Methodology for estimating the effects of demographic ageing on growth using regional data")***
* ***[*List of references*](#tar-26 "List of references")***
****Over the long term, the key drivers of economic growth are innovation, technological advances, and productivity gains. However, the weak growth in Germany's potential output over the next ten years will also be strongly influenced by labour input. One key reason for this is the decline in labour supply as a result of demographic change.****{#par-eu9e34}
****Demographic change is squeezing Germany's labour supply primarily through two channels. First, the number of persons of working age will decline, especially in the coming years as the baby boomers enter retirement. Second, the share of older persons among the working-age population is rising. This lowers the labour force participation rate, as older workers tend to have lower participation compared with younger workers (age structure effect).****{#par-o447aa}
****It is not only Germany's future growth that is affected by the labour supply shortages. Bundesbank calculations show that the age structure effect has, in arithmetical terms, already resulted in a decline in economic growth of around 0.4 percentage point per year over the past ten years. In the coming years, this negative effect is likely to increase to around 0.6 percentage point per year. The shrinking population will then contribute to growth diminishing by an additional 0.2 percentage point. Further analyses show that demographic ageing also has an impact via an indirect channel in that it is slowing productivity growth in Germany. This means that demographic ageing is weighing on both labour input and productivity. In the past, high immigration and rising labour force participation among women and older people counteracted these dampening effects. However, these counteracting impulses are likely to be less pronounced in the coming years.****{#par-ee2179}
****When estimating the potential for higher labour input, it is worth considering labour force participation and hours worked among different population groups. The labour force participation rates of older people and women in Germany are now quite high by European standards. However, under the existing framework conditions, older people frequently retire before reaching the statutory retirement age. Furthermore, in many cases, older people and women work part-time with low average weekly hours of work. This results in low average hours of work. However, this is mainly a reflection of the fact that many of the people who now work part-time would not have worked at all in the past. Despite this development -- which is, in fact, positive -- there are indications that women, in particular, often want to increase their number of working hours beyond their existing hours. It is not uncommon that the existing framework conditions restrict women's incentives and opportunities to increase their hours of work. These include inadequate childcare facilities and adverse financial incentives to work for married second earners.****{#par-e47o43}
****A key lever for mitigating the economic repercussions of demographic change is thus to increase the number of hours worked by part-time employees. However, there is also scope for action with regard to labour force participation and immigration. If this were utilised, potential growth could be considerably higher. This would require better framework conditions in terms of economic policy. The present article discusses various measures that would contribute to this.****{#par-e412o3}
***1 Introduction*** {#tar-1}
-----------------------------
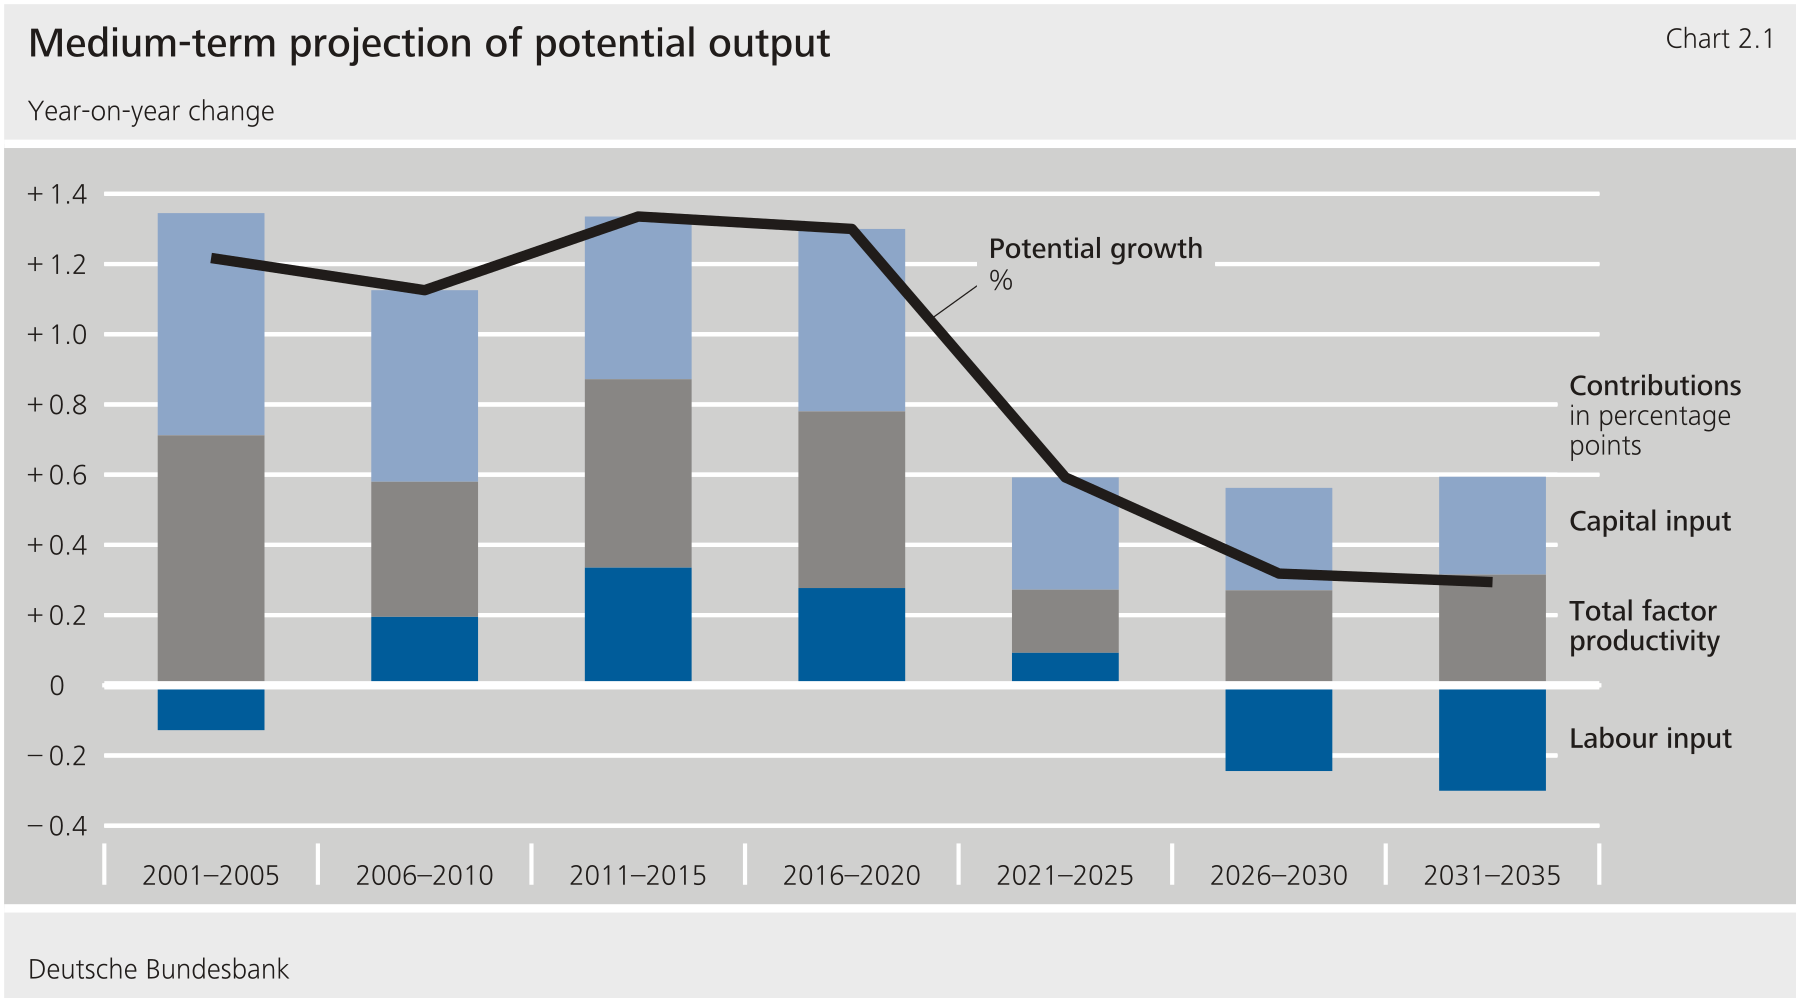
*****This article examines the impact of demographic change on labour supply and economic growth in Germany.** Growth in potential output is determined by developments in technological advances, capital stock, and labour input. Over the long term, the main drivers of growth and prosperity are productivity gains through innovation and the successful use of new technologies. However, due to demographic ageing in Germany, the decline in labour input will be a key reason for the weak growth in Germany's potential output over the next ten years. Demographic change has been shaping developments in Germany for a longer period of time now. However, an especially large number of people will enter retirement over the coming years. In addition, in the past, the impact of demographic ageing on labour input and growth has long been masked by high immigration and rising labour force participation among women and older people. For these reasons, demographic pressures will become more apparent in the future. This situation raises the following question: which components of labour input could help mitigate the expected decline in labour input, and how much potential is there to do so?***{#par-o5i8ao}
{#par-o12i8u}
******
*****Macroeconomic growth remains an important target variable for economic policy, even for an ageing and prospectively shrinking population.** Per capita growth is often used as the usual metric of welfare. Nevertheless, per capita growth is also under pressure from demographic change. For instance, demographic ageing reduces the share of employed persons in the population and thus the labour input per inhabitant. Demographic ageing can also weaken productivity growth. The number of employed persons that have to support the overall population and, in particular, the growing number of older people is also crucial with regard to social security systems. In addition, the financial leeway available for defence, infrastructure, education and other government tasks is dependent on aggregate economic output. The same applies to the sustainability of public finances. Given the major challenges in the coming years, aggregate growth therefore remains of key significance for economic policy.***{#par-aaa145}
*****The labour market has been a stabilising factor in recent years. Demographic change also contributed to this.** Despite the various economic crises and, in some cases, weak macroeconomic developments over the past ten years, unemployment rose only in phases and only moderately. At the same time, employment remained stable overall for a long period of time. Many enterprises initially refrained from cutting jobs, partly because they feared increasing shortages of skilled labour. This is because many people are currently reaching or approaching retirement age. Furthermore, additional jobs were created, especially in the health and social work sectors. Demographic change is causing personnel requirements in these sectors to rise (see the supplementary information entitled "[Changed employment structure against the backdrop of weak labour market dynamics](#Changed-employment-structure-against-the-backdrop-of-weak-labour-market-dynamics)").***{#par-auu932}
****While demographic ageing will increasingly weigh on growth, its impact on labour input can be mitigated.** Labour supply will continue to decline as a result of the ageing of the population. However, there is still considerable potential for counteracting this. This holds particularly true with regard to the hours worked by part-time employees. However, in order to exploit this potential, further reforms are likely to be necessary. This article sheds light on the outlook for the coming years and discusses options for bolstering the supply of labour.**{#par-ie57u2}
**Changed employment structure against the backdrop of weak labour market dynamics** {#tar-2}
---------------------------------------------------------------------------------------------
****Demographic change has altered the structure of employment in Germany.** At the same time, structural change has been driven by the evolving international environment, technological innovations, the energy transition, and decarbonisation.[\[1\]](#_ftn_4d938dfe_1) While total employment has remained broadly stable thus far, developments in individual sectors have varied considerably. In particular, employment rose in the health and social work sectors. In these sectors, there has been an increase in demand as a result of demographic ageing -- for example, in the areas of old-age care and medical care. Highly skilled business-related services as well as areas such as energy and water supply, education, and security also gained in importance.**{#par-oio3aa}
{#par-ue5e27}
**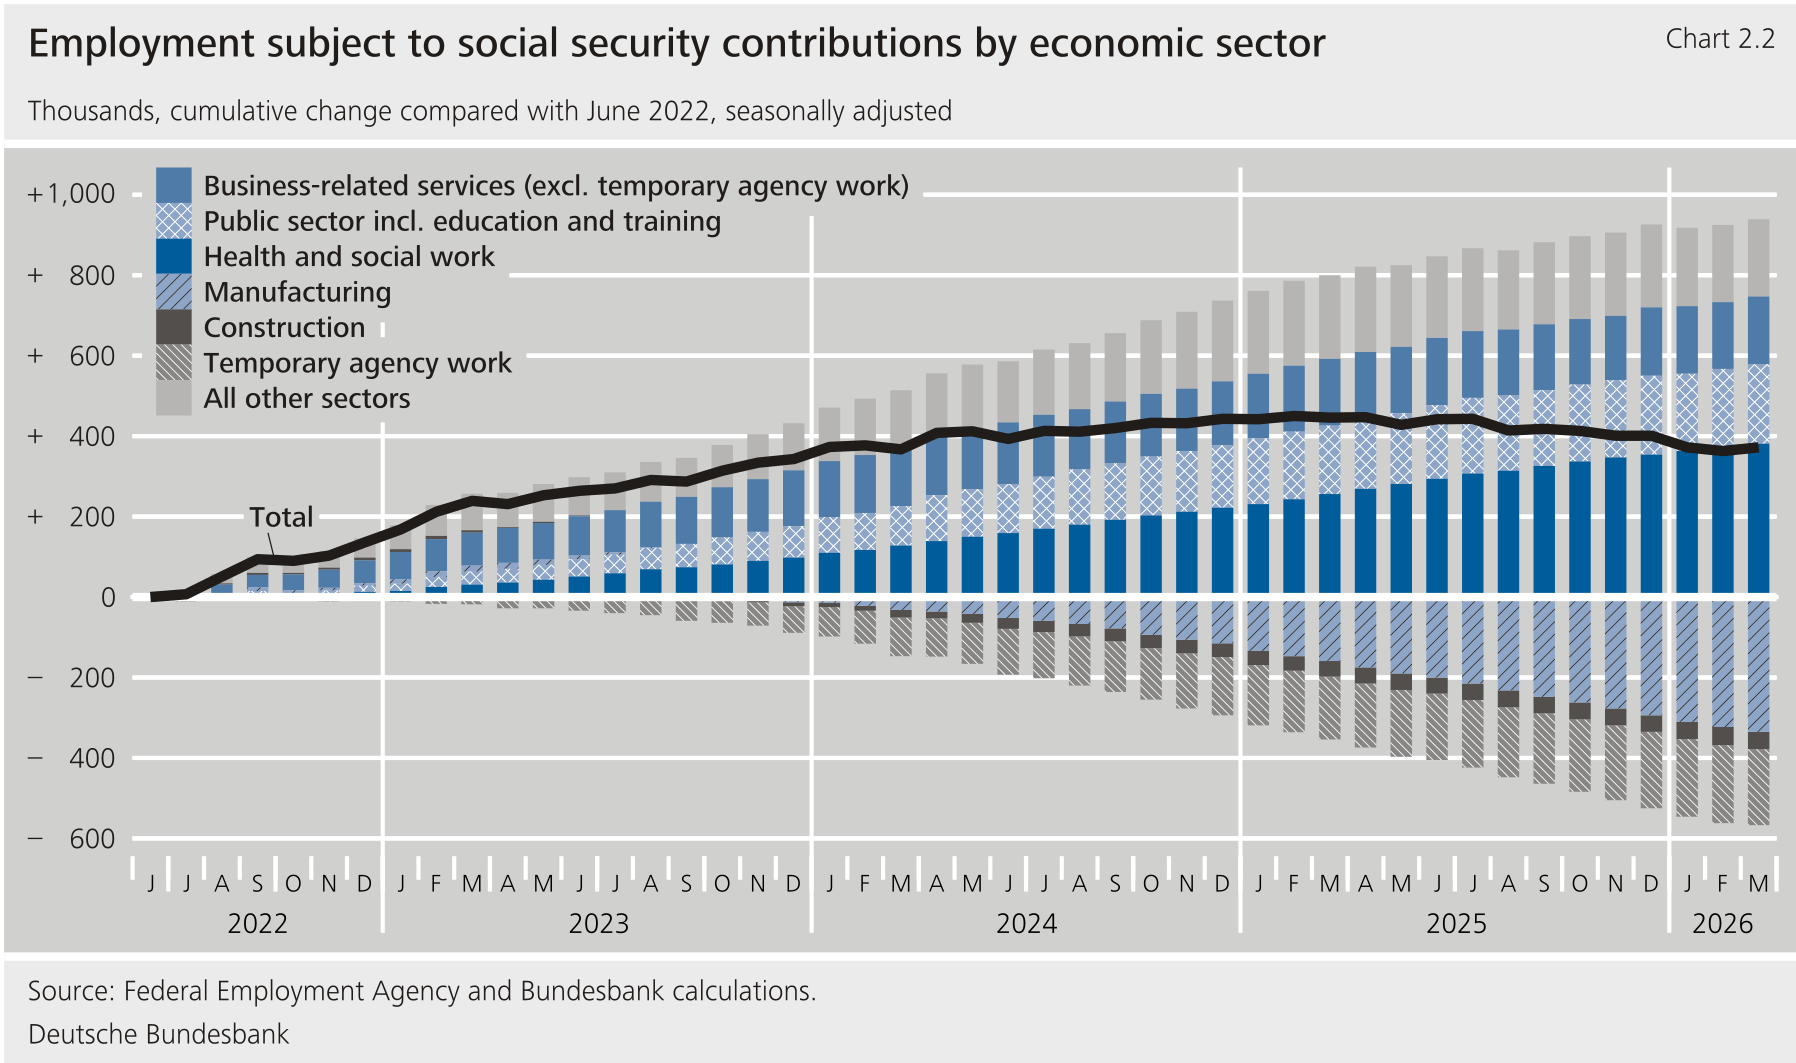**
****The manufacturing sector reduced employment.** Over the past three years, the number of employees subject to social security contributions in the industrial sector has fallen by 350,000, or just over 5 %. At first, there were cuts mainly to the number of temporary agency workers employed in industry. Later, however, the cuts increasingly affected core staff as well. In this context, many enterprises are reducing jobs through natural fluctuation and by refraining from hiring new staff. These cuts were increased further through offers of severance payments.[\[2\]](#_ftn_4d938dfe_2) Compulsory redundancies have played only a subordinate role thus far.**{#par-a5a85e}
{#par-e85821}
**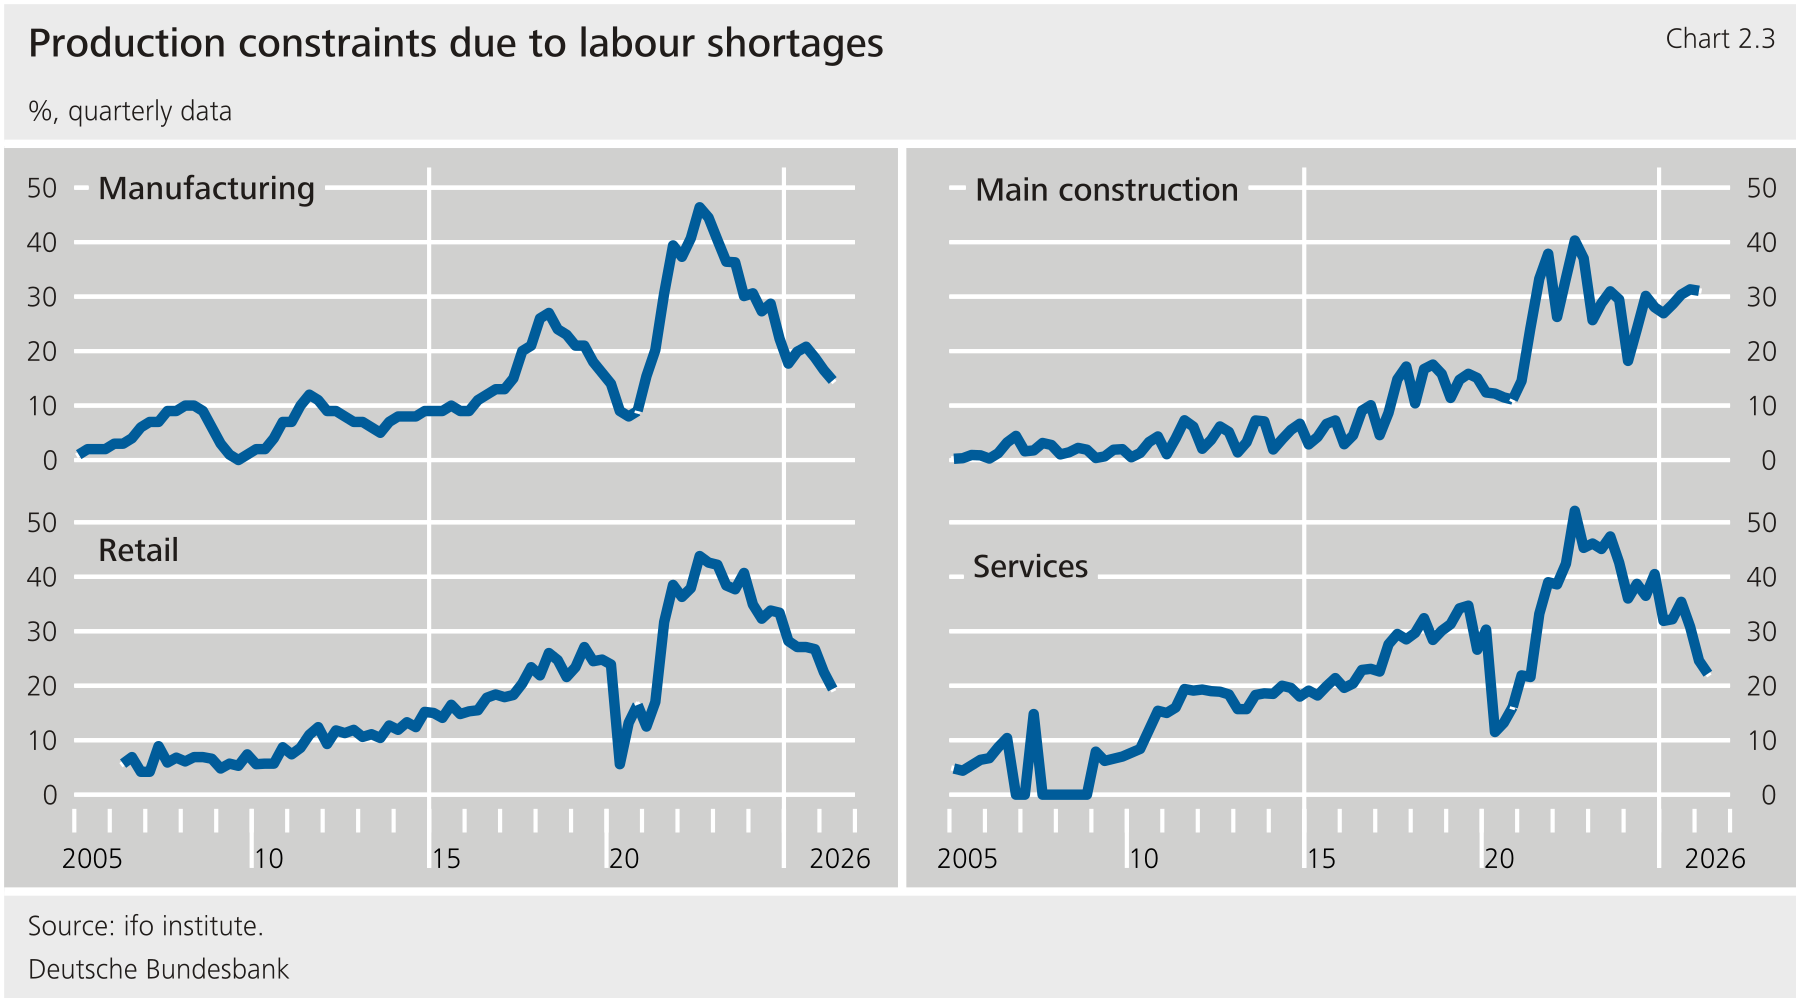**
****Demographic and technological change contributed to the shortage of skilled workers.** First, there are a high number of age-related departures from working life compared with significantly smaller younger age cohorts. Second, the shifts in labour demand are also entailing considerable change among the various occupational groups. There is a need for workers to acquire new skills in order to keep pace with technological change. In industry, for example, the number of people in traditional manufacturing occupations has been declining for a number of years now. By contrast, there is an increasing need for workers in the mechatronics, energy and electrical professions as well as in the technical research, development, construction, and production management professions, which often come with greater requirements in terms of skills and qualifications. Qualifications and labour market needs could diverge more frequently in future.**{#par-e52o76}
****The shortage of skilled workers kept unemployment low for a longer period of time.** By historical standards, unemployment in Germany remains low and total employment is also only slightly below the record level reached at the start of 2025. For instance, despite growth stagnating on balance since the end of 2022, many firms initially refrained from dismissals and hoarded workers. This is because they feared that it would be more difficult to find staff in the future once the baby boomers reached retirement age. At the same time, demographic trends made it possible to increasingly reduce employment through natural fluctuation.[\[3\]](#_ftn_4d938dfe_3) Despite weak economic activity, labour market tightness -- as measured by the ratio of the number of vacancies to the number of unemployed persons -- thus remained high for a long period of time. This is because, given the shortage of skilled workers, enterprises kept vacant positions open for longer than they had in the past.**{#par-ua7999}
{#par-eie643}
**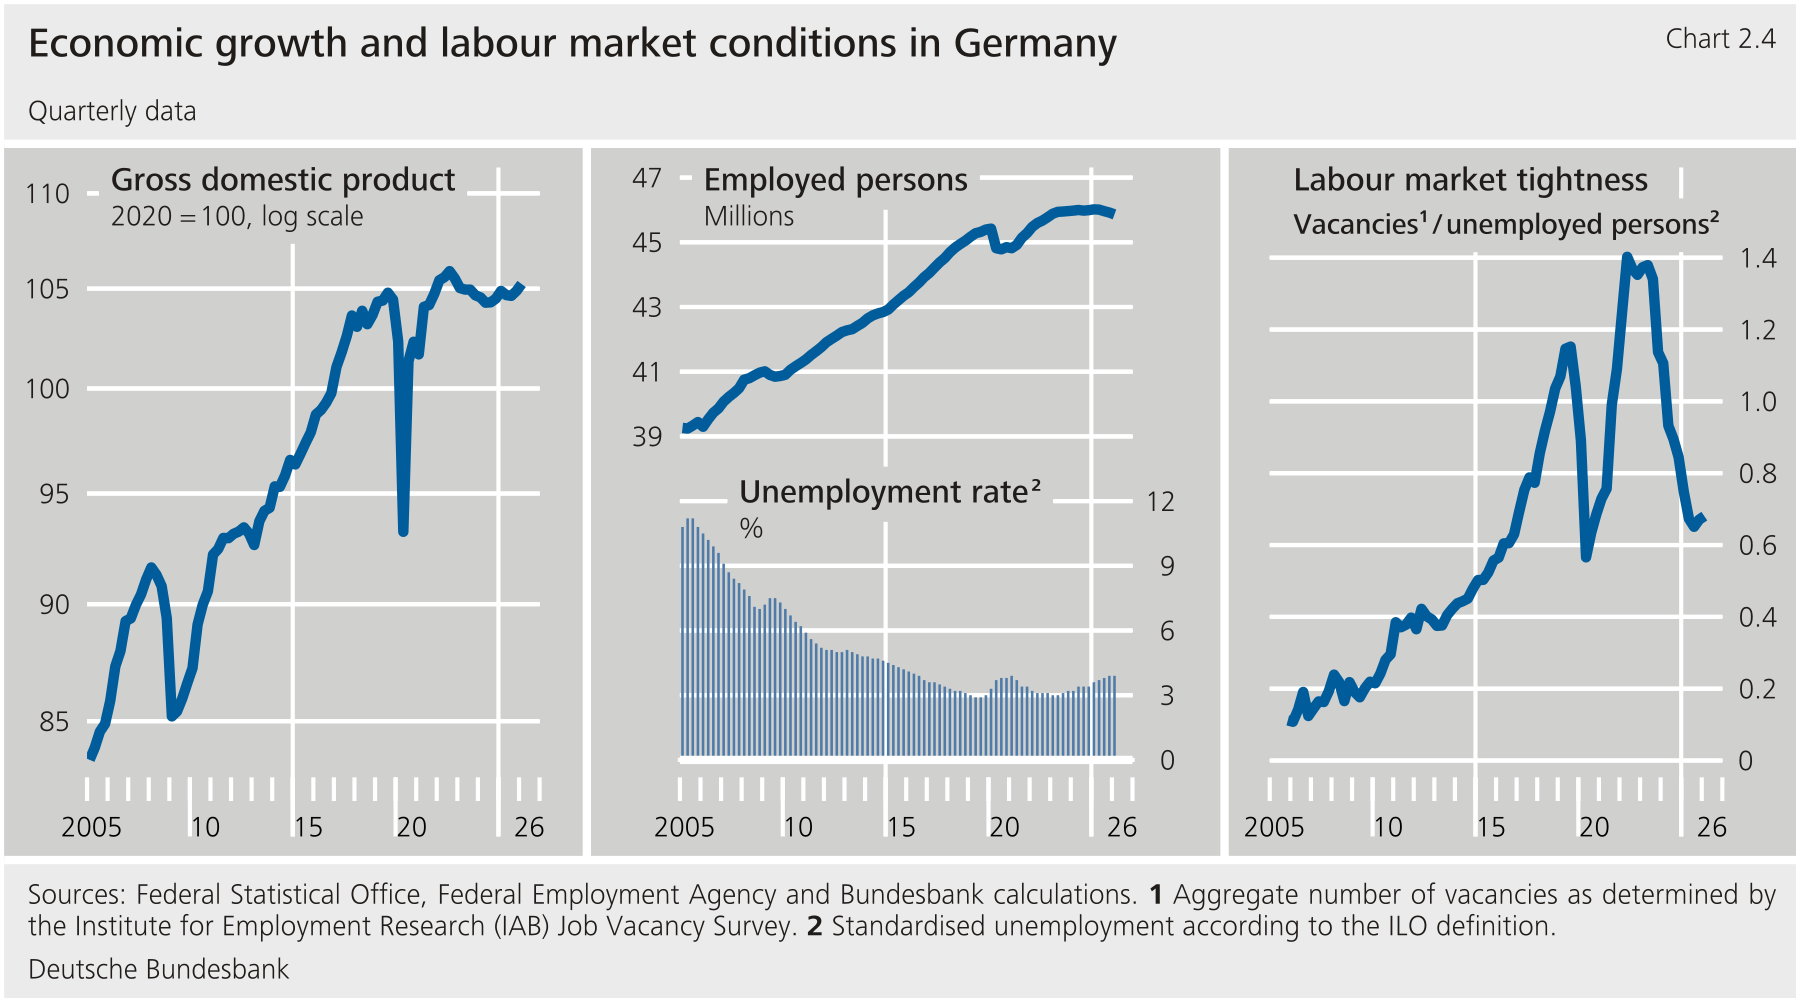**
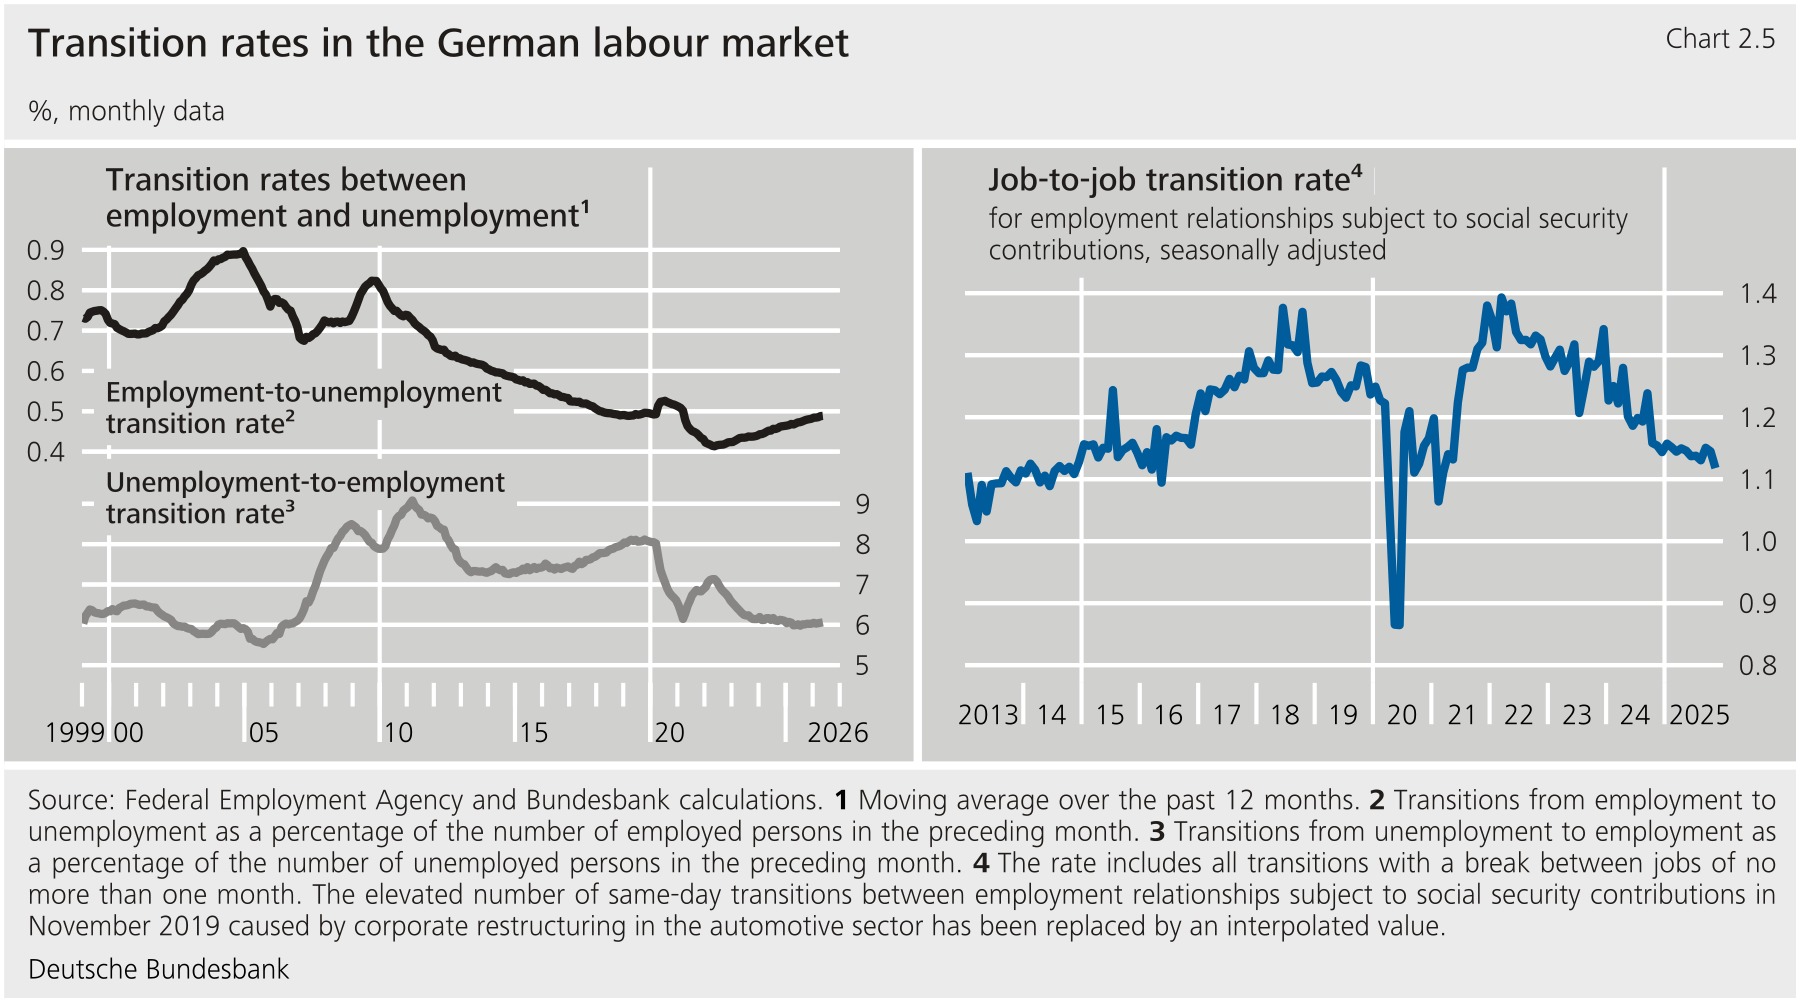
****Nevertheless, the weakness in economic activity has had a visible impact on the labour market: at first, it was mainly reflected in the considerably lower number of new job offerings.** As a result, the transition rate from unemployment to employment fell to a historical low.[\[4\]](#_ftn_4d938dfe_4) There was also a decline in employees transferring directly between enterprises. While transitions from employment to unemployment rose somewhat, they remained at a low level until recently. Overall, labour market dynamics thus remained weak.[\[5\]](#_ftn_4d938dfe_5)**{#par-io652i}
{#par-u21o22}
****
1. **{#_ftn_4d938dfe_1} See Deutsche Bundesbank (2025a, 2026a).**
2. **{#_ftn_4d938dfe_2} See Deutsche Bundesbank (2026b).**
3. **{#_ftn_4d938dfe_3} See Deutsche Bundesbank (2025b).**
4. **{#_ftn_4d938dfe_4} See Hertweck (2026a).**
5. **{#_ftn_4d938dfe_5} The weak labour market dynamics may have additionally weighed on productivity growth. See Deutsche Bundesbank (2022, 2024a, 2025c).**
**2 Demographic change is reducing labour supply and weighing on economic growth** {#tar-3}
-------------------------------------------------------------------------------------------
### **2.1 The potential labour force is shrinking for a variety of reasons** {#tar-4}
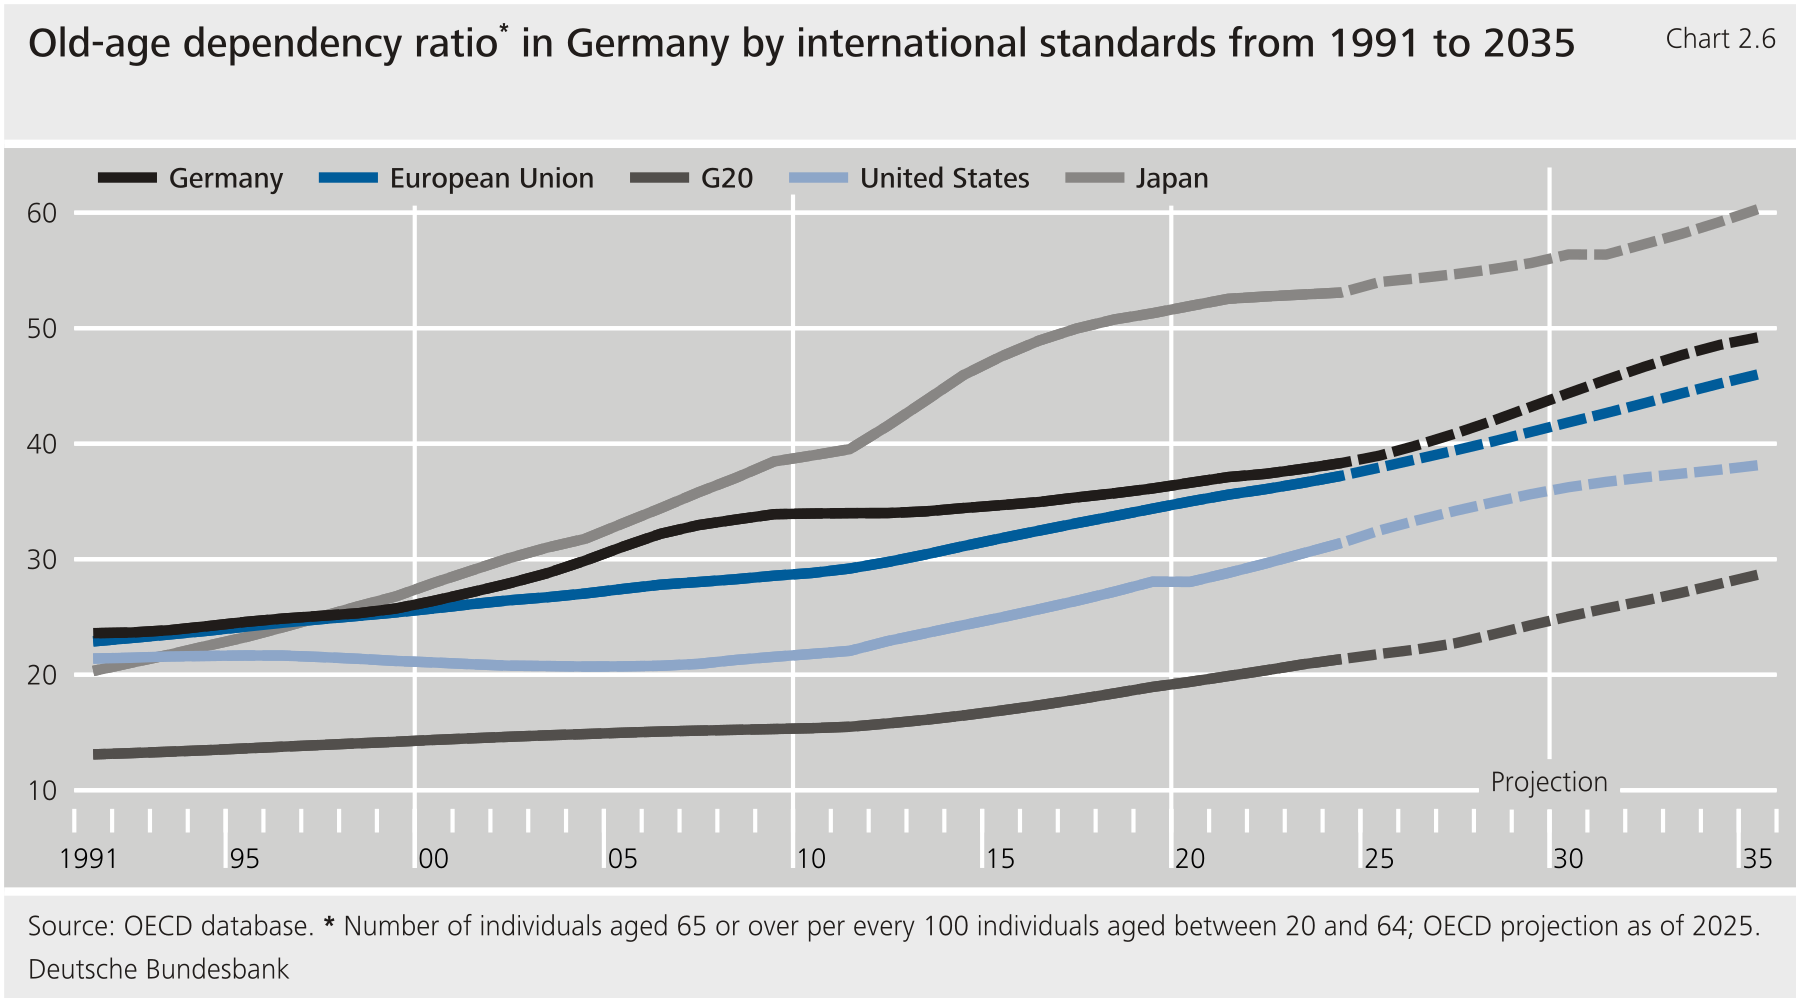
****Demographic change in Germany is pronounced by international standards.** Following the baby boom in post-war Germany, birth rates have persistently fallen since the early 1970s, and life expectancy has risen. Since then, the average number of children per woman has fluctuated around 1.4 children per woman.[\[1\]](#_ftn_root_1) This corresponds to around two-thirds of the basic population replacement rate from one generation to the next (2.1 children per woman). This process is similar in many demographically "mature" industrial countries and is reflected in significantly rising old-age dependency ratios. Currently, the baby boomer generation is increasingly entering retirement and the old-age dependency ratio is rising to a greater degree.[\[2\]](#_ftn_root_2)**{#par-i53i62}
**** {#tar-5}
-----------------------------------------------------------------------------------------------------------------------------------------------------------------------------------------------------------------------------------------------
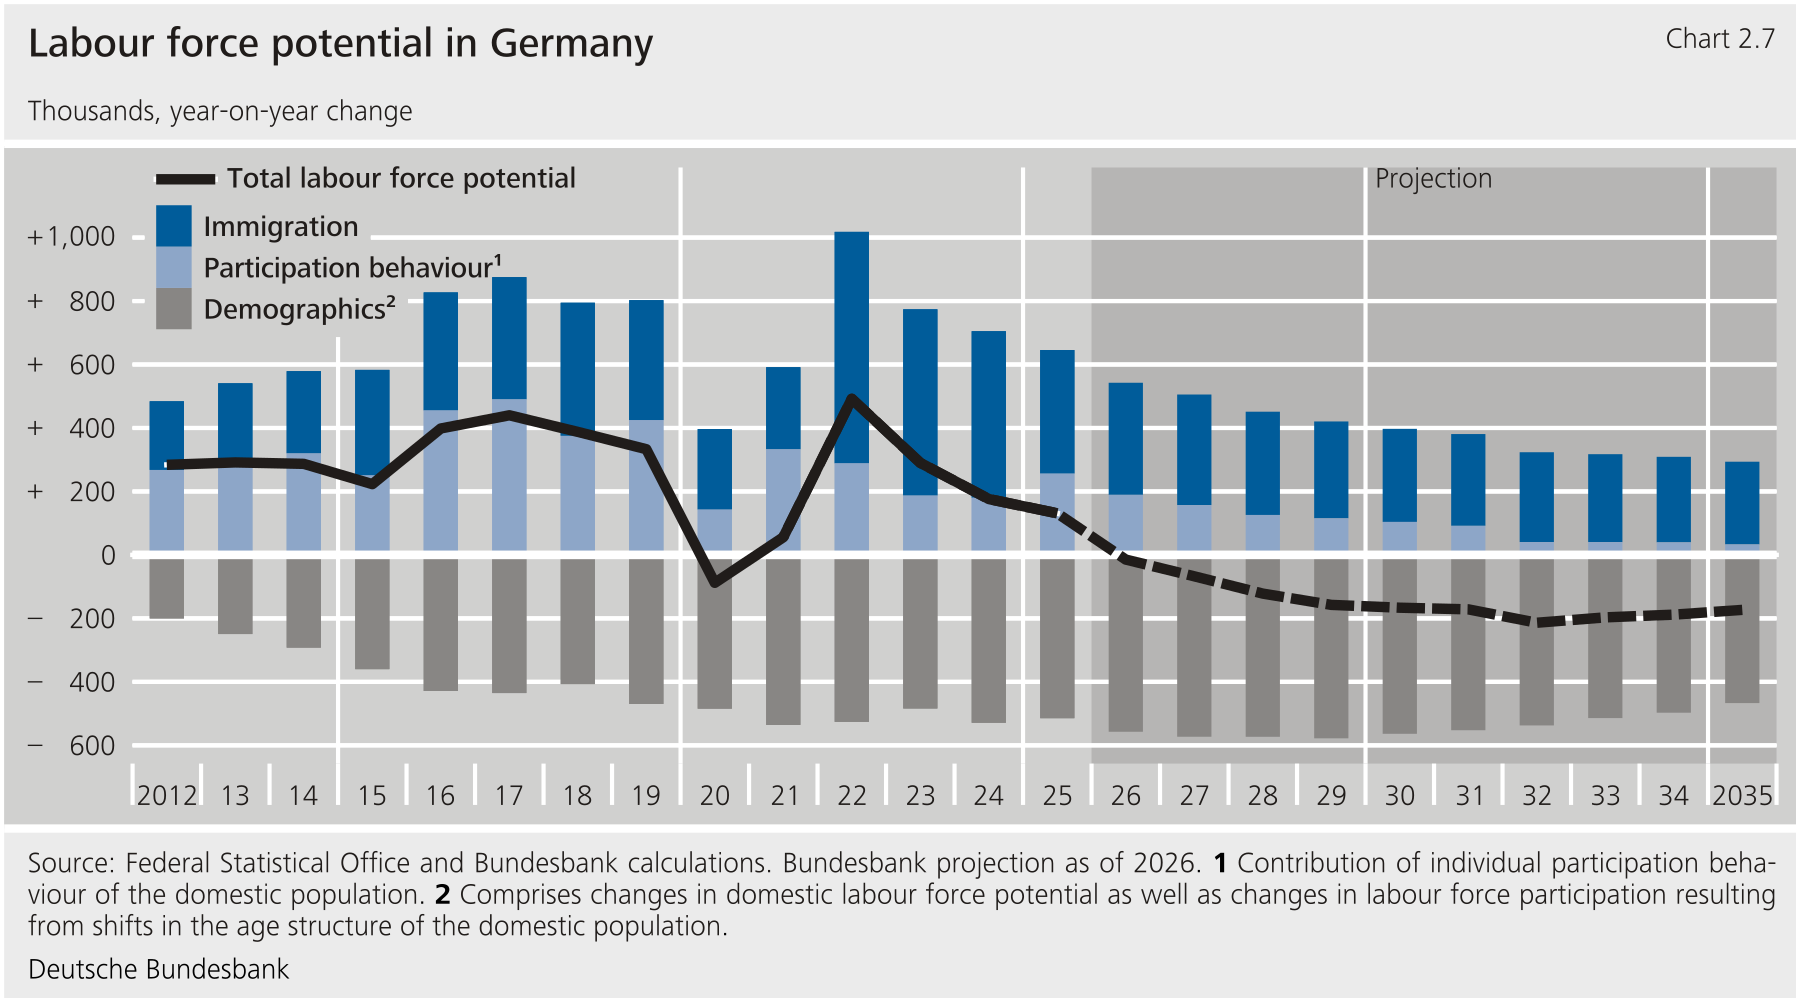
****Demographic change is reducing labour supply in several ways.** First, the working age population is in decline. In Germany, it is falling at an increasing rate. Second, there is a rising share of older persons, who have a lower labour force participation rate compared to younger age groups, while there is a declining share of prime age workers, who have high labour force participation rates. For instance, the now ever-growing generation of those aged 55 to 64 as well as the group of those aged 65 to 74, which will grow strongly in the coming years, have considerably lower labour force participation rates than the cohort of those aged 35 to 54. Taken in isolation, this shift in the age structure is reducing the aggregate labour force participation rate and the potential labour force.[\[3\]](#_ftn_root_3) In recent years, this age structure effect has been offset by rising individual labour force participation within individual population groups as well as by immigration. In future, however, these counteracting impulses are likely to be less pronounced.**{#par-a13a99}
****If immigration is factored out, Germany's population has been in decline for some time now.** In past years, immigration has been more than able to offset the excess of deaths over births among the domestic population. In future, however, it will probably be insufficient to compensate for the decline in the domestic population.**{#par-oe5o2o}
**** {#tar-6}
-----------------------------------------------------------------------------------------------------------------------------------------------------------------------------------------------
****Demographic change is also dampening the average number of hours worked.**Older employed persons more frequently work part-time or in marginal employment. The average number of hours worked among those aged 55 to 64 is somewhat lower than the working hours of those aged 35 to 54, while the number of hours worked among those aged 65 to 74 is around half that of those aged 35 to 54. As the share of older persons in the labour force rises, the average number of hours worked among all employees will therefore fall.**{#par-oo4287}
****The increasing use of artificial intelligence** ()**has barely reduced the demand for labour thus far.** The rapid proliferation of could reduce firms' needs for staff and thus lower labour demand. However, a new survey conducted by the Bundesbank shows that there have been only minor macroeconomic employment effects thus far, irrespective of workers' qualifications and professional experience (see the supplementary information entitled "[Productivity and labour market effects of generative artificial intelligence in German enterprises](#Productivity-and-labour-market-effects-of-generative-artificial-intelligence-in-German-enterprises)"). On average, German enterprises do not expect that there will be any significant employment effects in the coming years, either.[\[4\]](#_ftn_root_4) For the time being, the decline in labour supply due to demographic change is therefore unlikely to coincide with lower labour demand due to .**{#par-u4847i}
**Productivity and labour market effects of generative artificial intelligence in German enterprises** {#tar-7}
---------------------------------------------------------------------------------------------------------------
****The economic consequences of generative artificial intelligence** ()**are potentially significant, but remain highly uncertain.** In particular, assessments of its impact on productivity and employment vary significantly.[\[1\]](#_ftn_4d2e8ce0_1) Furthermore, focus is increasingly moving to potential consequences for individual demographic groups, such as those for entry-level workers.[\[2\]](#_ftn_4d2e8ce0_2) Business surveys can provide important information here. The Bundesbank regularly uses its survey of firms (-F) to monitor the use of in the German corporate sector and its consequences. In the first quarter of 2026, this survey again asked more than 7,000 enterprises about their use of generative .[\[3\]](#_ftn_4d2e8ce0_3)**{#par-ei9o2e}
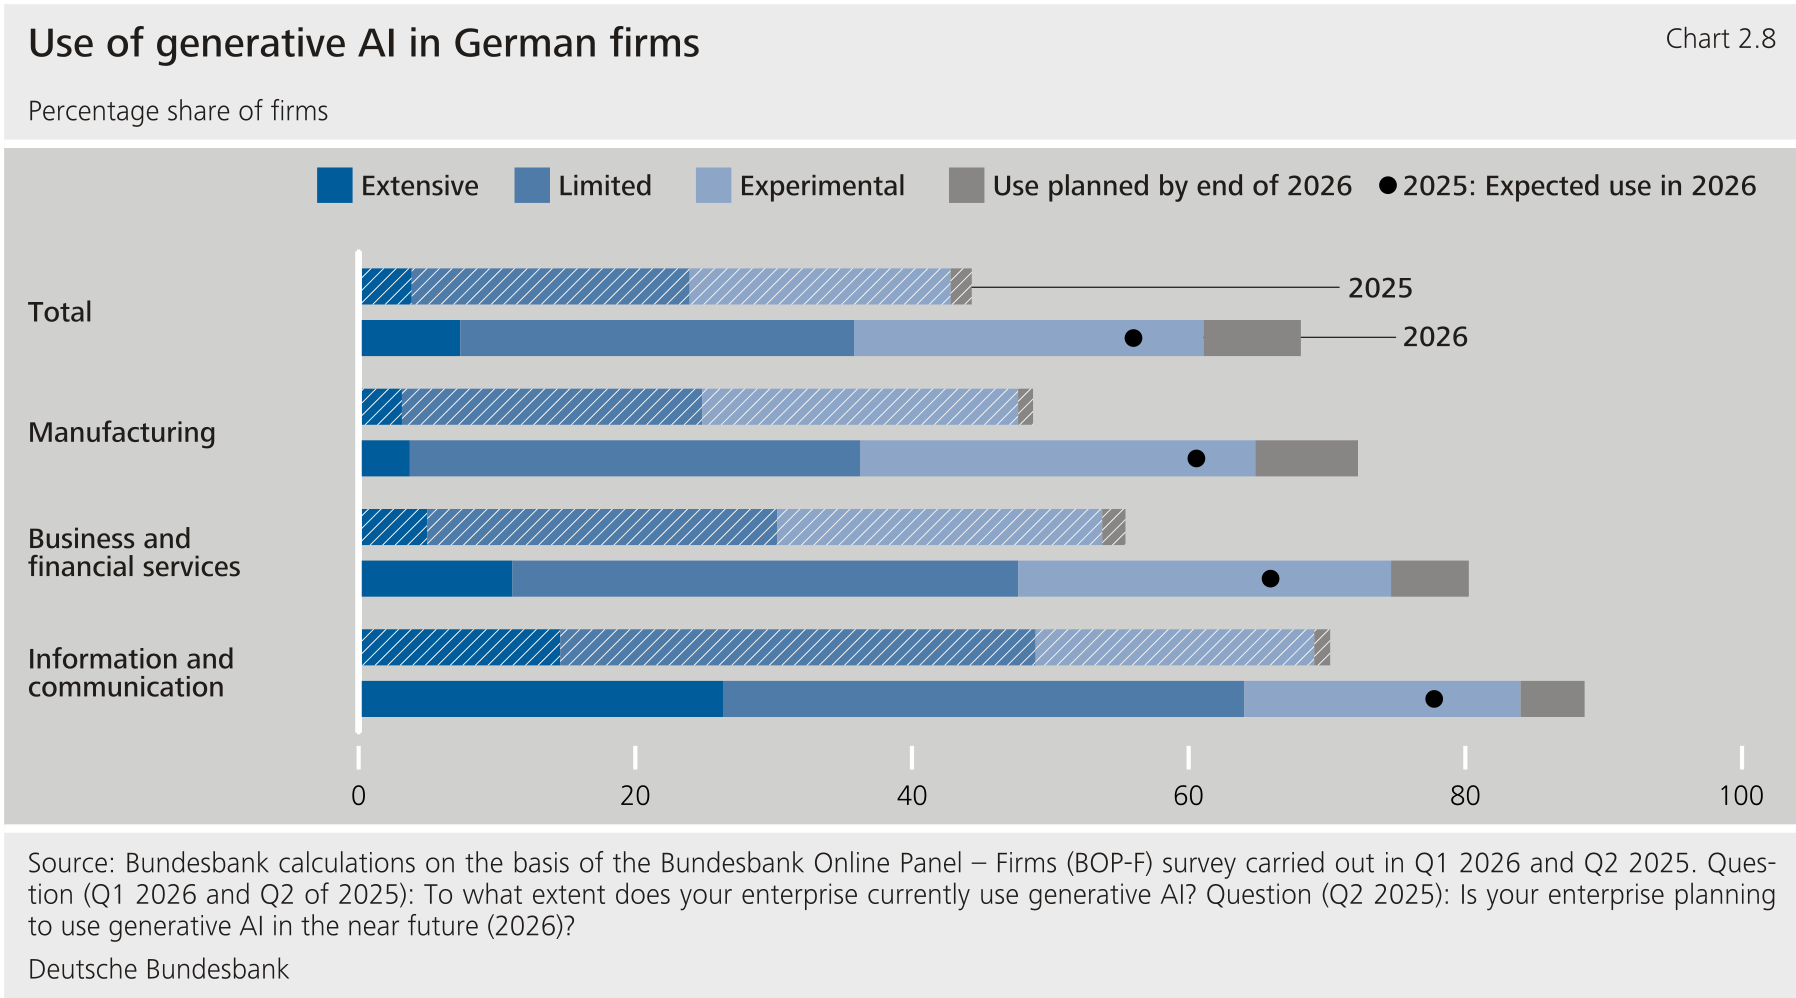
****The use of generative** **continues to rise sharply in 2026.** According to information provided by firms, the share of firms currently using or expecting to use by the end of the year increased from 44 % in 2025 to 68 %. The use of is thus spreading at a significantly more rapid pace than had been expected a year ago.[\[4\]](#_ftn_4d2e8ce0_4) In the second quarter of 2025, only 56 % of firms expected to use generative in 2026.[\[5\]](#_ftn_4d2e8ce0_5) Intensity of use continues to rise in 2026. Around 7 % of firms use generative extensively and just over 28 % to a limited extent. A further 25 % use it for experimental purposes. Around 7 % expect to introduce by the end of the year.**{#par-i7781i}
****use is rising in 2026 across all sectors of the economy and across all firm sizes.** Nevertheless, the sectoral differences remain large. Firms in the information and communication sector are still leading the way. adoption in the manufacturing sector is rising at a similar rate to the average in the economy as a whole. However, the share of limited and experimental use is somewhat more pronounced in this sector. Usage is also increasing consistently by enterprise size in 2026. The utilisation rate for small enterprises is lower overall and is growing more slowly than for large enterprises. By contrast, where small firms use generative , they use it more intensively than large firms on average.**{#par-ie6a3i}
{#par-a692i3}
****
****Just under half of the firms that made greater use of generative** **in 2025 were already expecting positive productivity effects due to the increased uptake of the technology.** Around 46 % of firms reported labour productivity growth of 1 % or more. A similar number of firms reported that use had not changed their labour productivity compared with the previous year, while only 8 % reported a decline. The reported productivity impact is closely linked to intensity of use. For firms with increasing but still experimental use of , around 28 % reported productivity gains. Among firms with extensive use, this share was 83 %. On average, firms with increased use reported an attributed productivity effect of around 1.2 %.[\[6\]](#_ftn_4d2e8ce0_6)**{#par-oo7819}
****In macroeconomic terms, productivity effects are likely to be significantly smaller.** A rough calculation results in a macroeconomic effect of around 0.5 % for 2025.[\[7\]](#_ftn_4d2e8ce0_7) A contribution of this magnitude would be considerable. It would be somewhat higher than growth in labour productivity per person employed in the aggregate economy, which was 0.3 % in 2025 (following − 0.6 % in 2024 and − 1.5 % in 2023). Without the roughly calculated contribution, labour productivity growth would therefore have been negative in 2025, all things being equal. The size of the effect is consistent with other survey results.[\[8\]](#_ftn_4d2e8ce0_8) Here, too, positive assessments predominate. However, the -F figures presented here do not capture measured productivity effects. Rather, they reflect effects that enterprises attribute to generative . Such assessments can provide important indications, but can also overstate the actual effects.[\[9\]](#_ftn_4d2e8ce0_9)**{#par-oo4673}
{#par-i45858}
**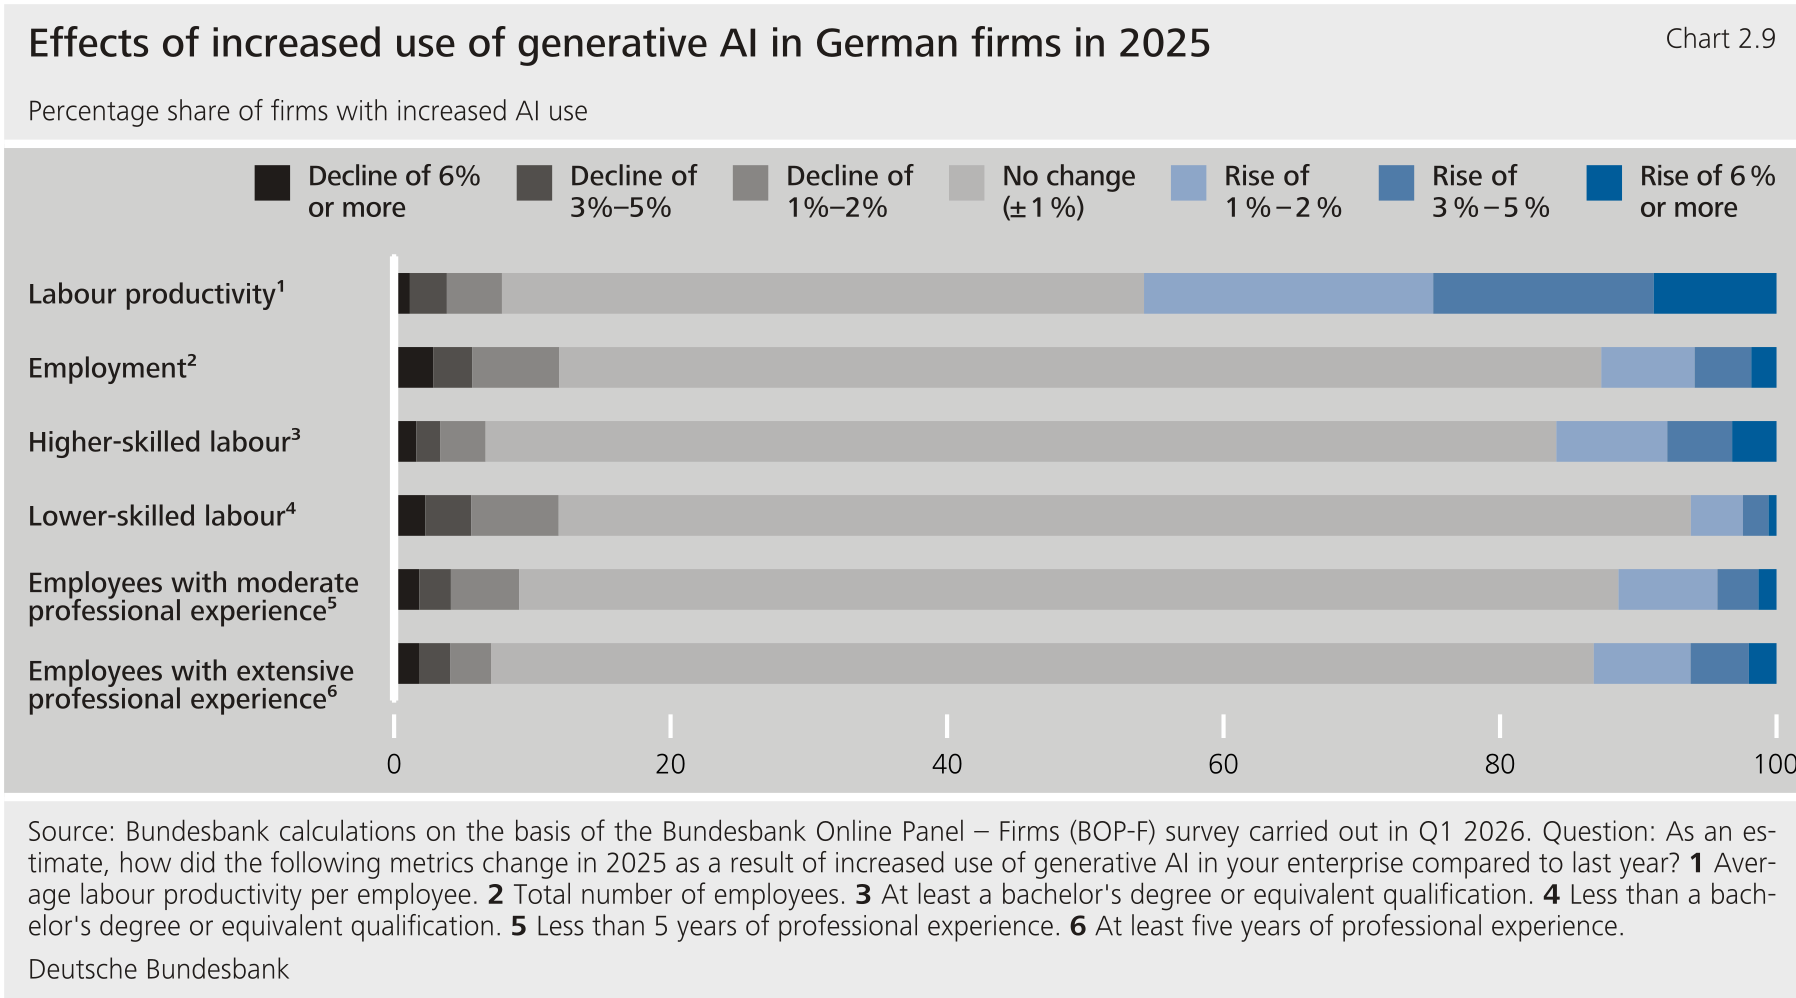**
****For 2025, most enterprises reported no notable employment effects due to increased use of generative** . Otherwise, positive and negative responses roughly balanced each other out. On average, this meant that there was virtually no effect on employment in arithmetical terms. Generative is therefore unlikely to have caused much change in employment in macroeconomic terms so far. A similar picture emerged in another internationally comparable -F question in the first quarter of 2026 on the expected effect of on employment over the next three years. German firms expected hardly any changes, while responses in the United Kingdom and the United States were significantly more negative.[\[10\]](#_ftn_4d2e8ce0_10)**{#par-oie3a3}
****The employment effects of generative** **were also largely balanced out when broken down by qualifications and professional experience.** Around 80 % of firms with increased use saw virtually no change for the individual groups. Only at the margins were slight differences observed. Positive data predominated for higher-skilled employees with at least a bachelor's degree or a comparable degree and for employees with at least five years of professional experience. The picture was somewhat more negative for lower-skilled employees. No clear pattern emerged for entry-level workers. There were no significant differences between the sectors either. The results therefore currently tend to suggest strictly limited shifts within the workforce rather than marked changes in employment. From a macroeconomic perspective, the effects are also unlikely to be of much significance so far. These marginal effects are also noteworthy because studies for the United States suggest that generative impairs employment opportunities for entry-level workers in activities with high exposure to .[\[11\]](#_ftn_4d2e8ce0_11)**{#par-a96875}
1. **{#_ftn_4d2e8ce0_1} See (2025).**
2. **{#_ftn_4d2e8ce0_2} See Brynjolfsson et al. (2025), as well as, inter alia, The Economist (2026) and The New York Times (2025).**
3. **{#_ftn_4d2e8ce0_3} For details on the -F survey, see Boddin et al. (2023). The -F survey already asked questions on use in the second quarters of 2024 and 2025; see Deutsche Bundesbank (2024b, 2025d, 2026c). In addition to recording the rate of adoption, each survey focused on a specific topic. The survey conducted in the second quarter of 2024 asked about objectives of use, amongst other things. In the second quarter of 2025 information on use intensity, spending on generative and expected economic effects was collected. The survey results presented in the first quarter of 2026 focused on labour market effects more strongly, among other factors.**
4. **{#_ftn_4d2e8ce0_4} Previous data show that enterprises are well able to estimate their future use of . According to the -F survey, around 90 % of firms that reported in the second quarter of 2025 that they wanted to introduce generative by the end of the year that also participated in the 2026 survey did in fact report generative use in the 2026 survey.**
5. **{#_ftn_4d2e8ce0_5} See Deutsche Bundesbank (2026c).**
6. **{#_ftn_4d2e8ce0_6} The possible responses to the impact of an increased use of generative on labour productivity and employment are broken down into seven intervals: decrease by 6 % or more, decrease by 3 % to 5 %, decrease by 1 % to 2 %, no or minor change (±1 %), increase by 1 % to 2 %, increase by 3 % to 5 %, and increase by 6 % or more. For the calculation of average effects, categories are given the values − 6 %, − 4 %, − 1.5 %, 0 %, 1.5 %, 4 % and 6 %. The lower bound is therefore used conservatively for the open-ended outer categories in each case. All statistics are calculated using firm weights to obtain representative estimates.**
7. **{#_ftn_4d2e8ce0_7} The rough calculation assumes no productivity effects for enterprises without increased use of generative . This includes firms that use generative but have not increased their use of it, as well as those that do not use the technology. Potential negative general equilibrium effects, for example as a result of crowding-out or competitive effects, are thus not taken into account.**
8. **{#_ftn_4d2e8ce0_8} See Kerkhof et al. (2024).**
9. **{#_ftn_4d2e8ce0_9} See Baslandze et al. (2026).**
10. **{#_ftn_4d2e8ce0_10} See Yotzov et al. (2026).**
11. **{#_ftn_4d2e8ce0_11} See Brynjolfsson et al. (2025).**
### **2.2 Demographic ageing is weighing on economic growth and productivity growth** {#tar-8}
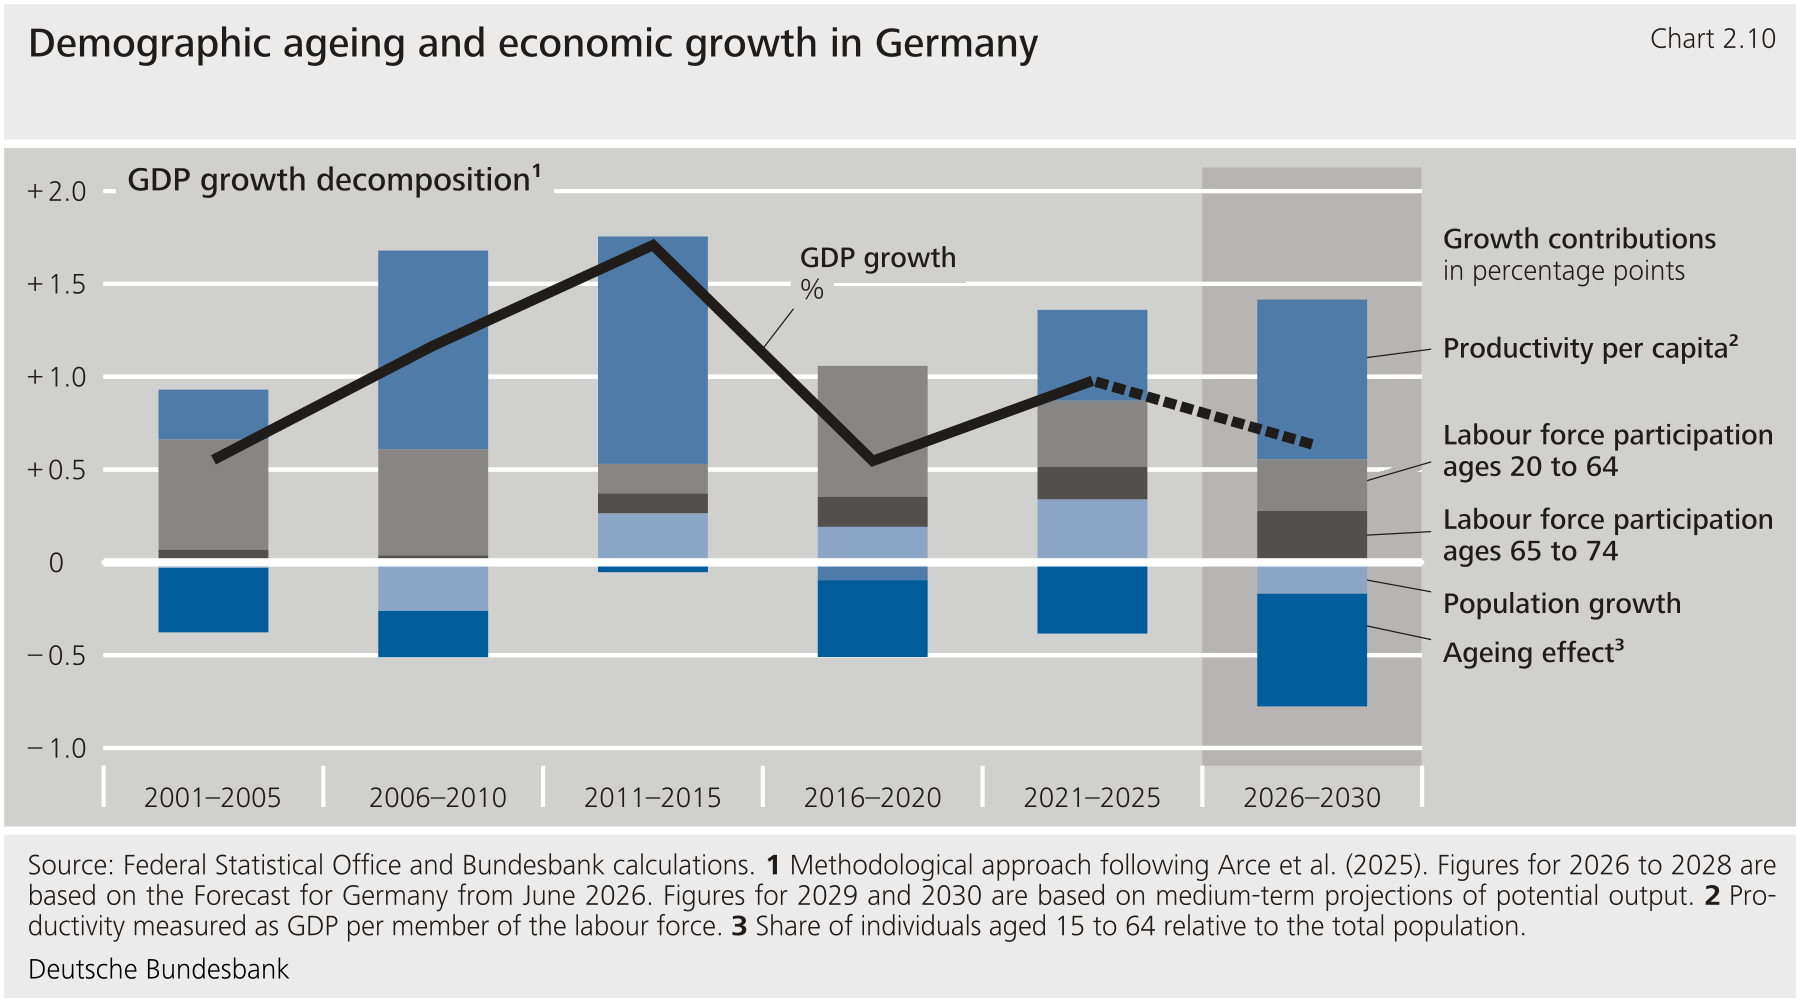
****The contributions to economic growth of the various factors of demographic change can be determined arithmetically.** This is achieved through a growth decomposition exercise. The starting point here is to consider aggregate output as a product of the population size, the share of the population in working age, the labour force participation rate, and output per member of the labour force (see the supplementary information entitled "[Arithmetical contribution of demographic ageing to growth](#Arithmetical-contribution-of-demographic-ageing-to-GDP-growth)").**{#par-a4a87i}
**Arithmetical contribution of demographic ageing to growth** {#tar-9}
----------------------------------------------------------------------
****In order to analyse the impact of demographic change on economic growth, growth in** **is decomposed into multiple components, following Arce et al. (2025).** This starts from an equation that allows to be represented as a product of population, age structure, labour force participation and economic output per member of the labour force. This decomposes growth into the contributions of these individual factors. In this way, it is possible to quantify the contributions to economic growth of population development, ageing, labour force participation and economic performance.**{#par-ia5o27}
**\\( Y = \\frac{Y}{LF_{15−74}} \\times \\frac{LF_{15−74}}{LF_{15−64}} \\times \\frac{LF_{15−64}}{WAP_{15−64}} \\times \\frac{WAP_{15−64}}{POP} \\times POP \\)**{#par-o76726}
**Population growth captures changes in the total population (\\( POP \\)). Ageing is measured as the share of the total population comprised by the working-age population (aged 15 to 64) (\\( \\frac{WAP_{15−64}}{POP} \\)). If this share declines because the share of older people increases (age structure effect), this results in a negative contribution to growth. Labour force participation is divided into two components. The first captures changes in the propensity to work among the group aged 15 to 64 (\\( \\frac{LF_{15−64}}{WAP_{15−64}} \\)). The second measures the increasing labour force participation of the group aged 65 to 74 (\\( \\frac{LF_{15−74}}{LF_{15−64}} \\)). This provides evidence of the extent to which a higher rate of labour force participation amongst older people and other groups, particularly women, has been able to mitigate demographic pressures. The remaining component measures gross domestic product per member of the labour force (\\( \\frac{Y}{LF_{15−74}} \\)) and can be interpreted as a comprehensive measure of economic performance. It captures, amongst other things, productivity gains and capital deepening.**
****According to the** **growth decomposition exercise, demographic ageing will weigh more heavily on economic growth in the coming years than it has thus far.** Over the past 15 years, population growth from high net immigration has provided a marked boost to growth. Over the next five years, however, the population is likely to shrink. This is due, in part, to both the increasing excess of deaths over births as well as lower expected immigration. Taken in isolation, this is likely to reduce growth by around 0.2 percentage point per year. A more significant factor in the decline in labour supply, however, is the effect of changes in the age structure. This has already been considerably weighing on growth over the past ten years. During this period, its contribution to growth averaged − 0.4 percentage point per year. By 2030, its estimated negative contribution is likely to increase to − 0.6 percentage point per year. At the same time, the rising propensity to work in the past provided strong impetus for economic growth. However, these contributions have recently declined.[\[5\]](#_ftn_root_5)**{#par-u49124}
**** {#tar-10}
----------------------------------------------------------------------------------------------------------------------------------------------------------------------------------------------------------------
****In addition to labour supply, demographic change can also affect productivity growth.** A reduced labour supply might encourage firms to invest more in digitalisation or automation, thereby bolstering productivity.[\[6\]](#_ftn_root_6) However, productivity growth could also be dampened by demographic ageing. Studies show that start-up and innovation activity is lower in countries with older populations.[\[7\]](#_ftn_root_7) In addition, consumption patterns tend to change with age. Demand for services with comparatively low productivity is likely to rise.[\[8\]](#_ftn_root_8)**{#par-ue6735}
****This article aims to isolate the effect of demographic change on productivity by analysing demographic developments across individual regions.** As the population ages, technology and economic policy often change at the same time. These developments may themselves be a response to demographic ageing. As a result, it is often unclear which aspects of productivity growth are actually attributable to demographic change itself. From a methodological point of view, this means that its impact is difficult to isolate from other developments. However, as the rate of demographic ageing varies between regions, there is scope to draw comparisons.[\[9\]](#_ftn_root_9) These can be used to estimate the causal effect of demographic ageing on productivity growth.[\[10\]](#_ftn_root_10)**{#par-u3oi6u}
****Novel estimates for Germany show that demographic ageing hindered productivity growth.** The results show that an increase of 1 % in the share of the population aged 60 to 74 (among those aged 20 to 74) reduced hourly productivity by around 0.1 %.[\[11\]](#_ftn_root_11) Overall, in the period from 2000 to 2021, the dampening effect on growth in aggregate labour productivity amounted to around 0.1 percentage point per year. Demographic ageing thus played a role in the already prolonged weakness in productivity growth in Germany.[\[12\]](#_ftn_root_12)**{#par-i43a41}
**3 Labour market-oriented immigration on the decline** {#tar-11}
-----------------------------------------------------------------
****In addition to the domestic population, immigration played an important role for labour input in Germany.** Its contribution to employment growth has recently shrunk significantly, however. The developments over the past years provide indications of the outlook for immigration and its importance for labour supply in the years ahead.**{#par-o11919}
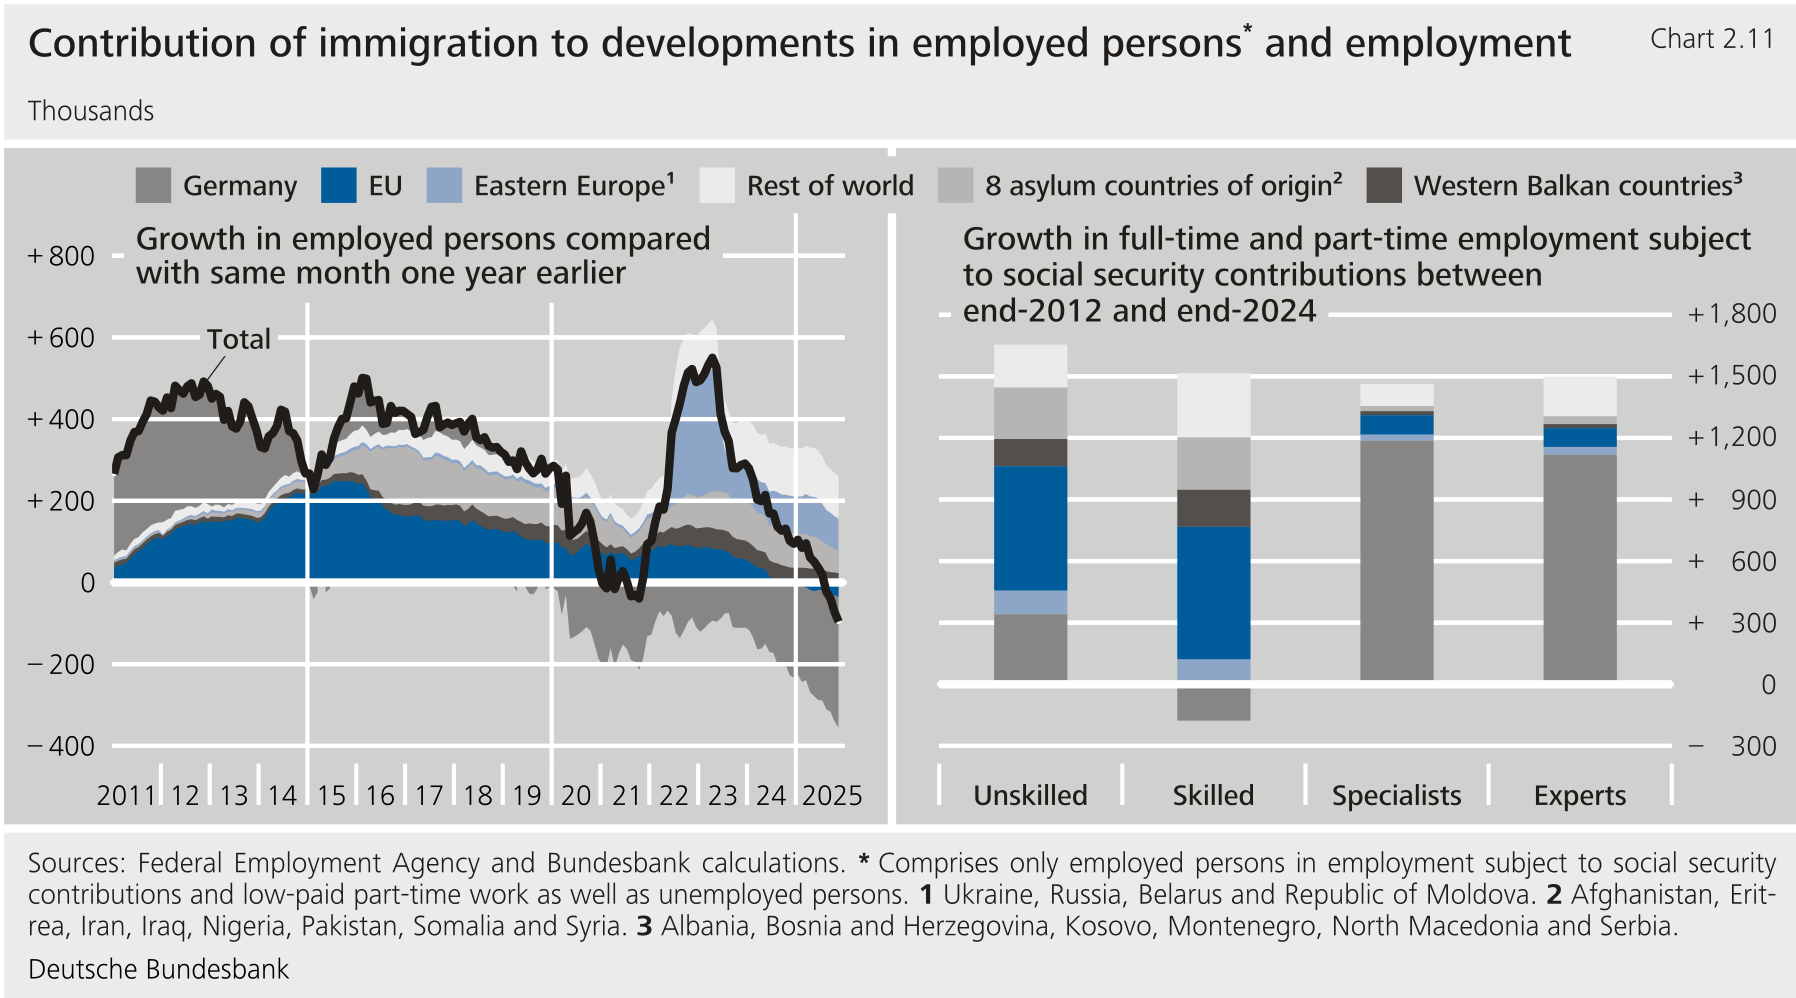
****The structure of immigration to Germany has undergone fundamental change over the past decade and a half.** Following a period of low immigration rates in the 2000s, the expiry of the restrictions on free movement of labour in May 2011 for the Central and Eastern European countries that joined the as of 2004 marked an important turning point.[\[13\]](#_ftn_root_13) In the years that followed, labour market-oriented immigration increased considerably. More recently, however, it has been in decline and refugee migration has gained in importance.**{#par-a78a65}
**** {#tar-12}
----------------------------------------------------------------------------------------------------------------------------------------------------------------------------------------------------------------------------------------------
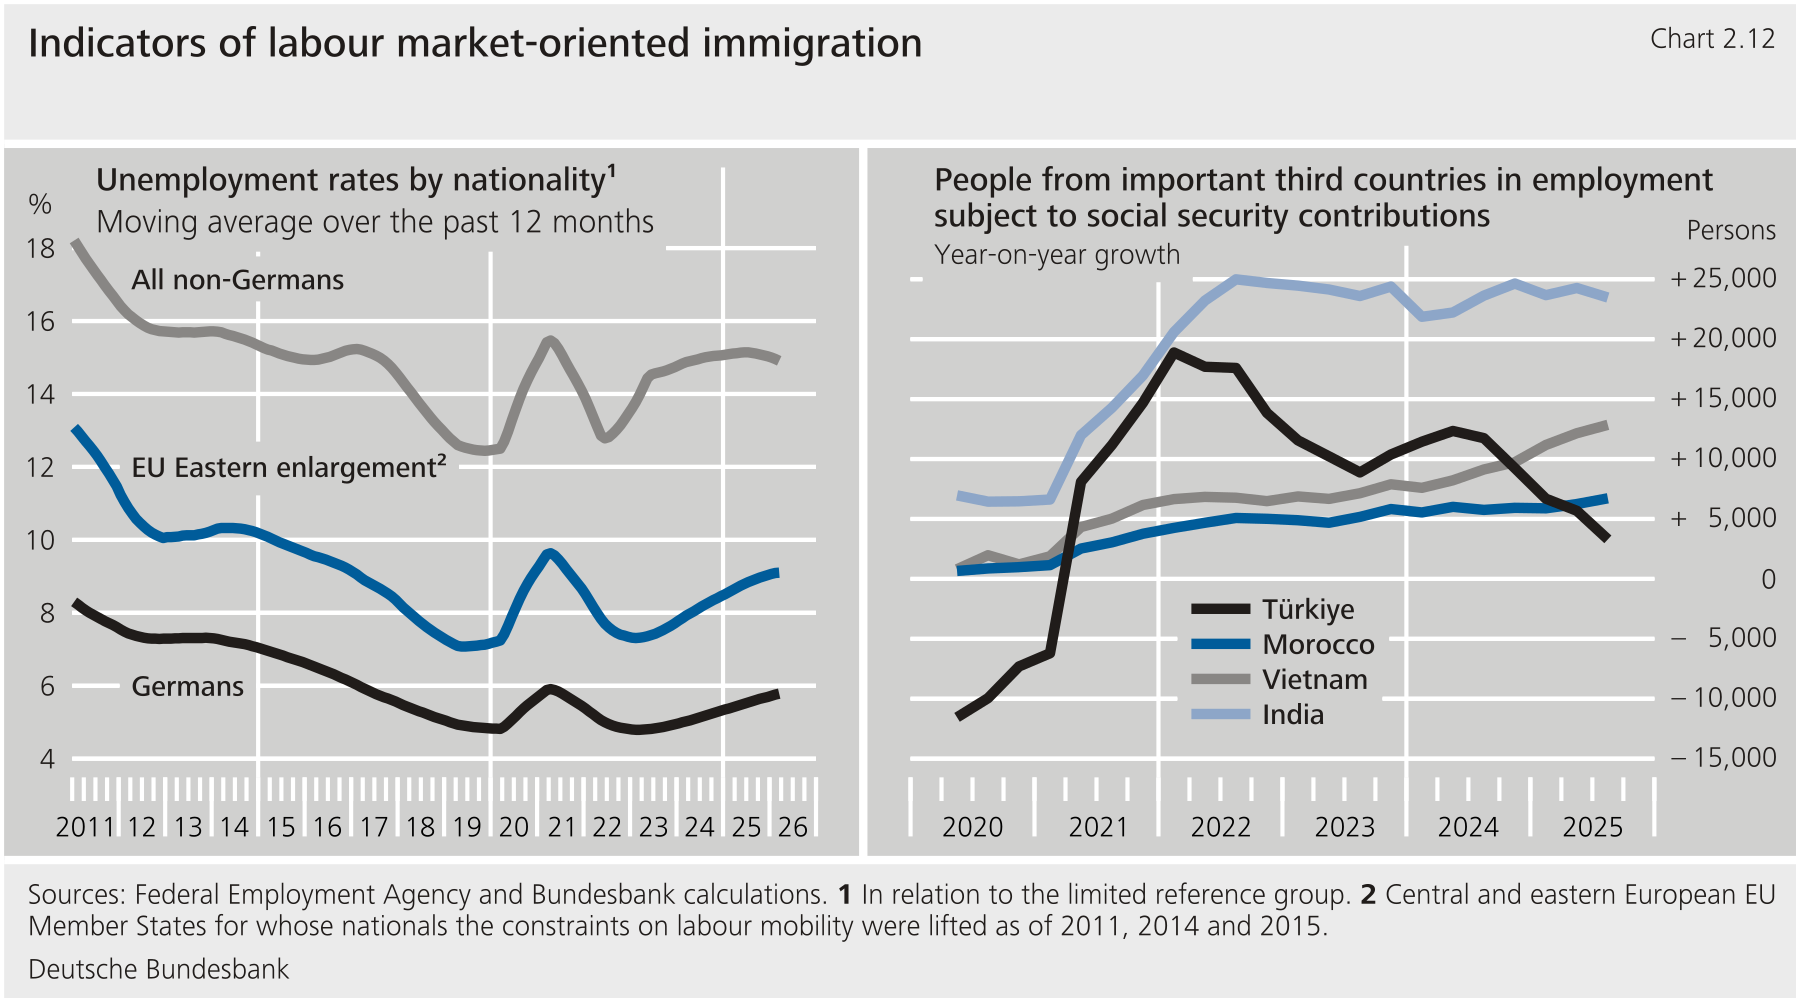
****In the 2010s, labour market-oriented immigrants from the new** **Member States gave a considerable boost to employment growth in Germany.** [\[14\]](#_ftn_root_14)The main reason why they made such a strong contribution to Germany's potential labour force was that they often possessed the skills that were needed in Germany. That observation is borne out by the relatively low unemployment rate among people from those countries in Germany.[\[15\]](#_ftn_root_15) In addition, many labour market entrants educated and trained in Germany were increasingly looking to take on higher-skilled jobs (those of specialists or experts). The age groups entering retirement, however, had previously, for the most part, been working in middle-skilled professions (skilled workers). This, too, pushed up demand -- in particular for skilled workers, but also for relatively low-skilled labour (helpers).[\[16\]](#_ftn_root_16) Immigration, then, has not only added considerably to employment growth in Germany, but also supported structural change in the labour market.**{#par-u66a29}
****Immigration from other** **Member States has been in significant decline in net terms for some years now, and has now largely dried up.** In part, this is because more than one-third of labour market-oriented immigrants leave Germany again within two years.[\[17\]](#_ftn_root_17) To date, labour market-oriented immigration from third (non-) countries has been unable to offset that decline. While skilled labour from countries like India, Vietnam and Morocco has grown in importance, labour market-oriented immigration overall has fallen well short of 2010s levels for a number of years now. In addition, the high migration gains seen in the 2010s seem unlikely to return because many of those migrants' home countries are now facing demographic challenges similar to those in Germany.**{#par-ieo18i}
**** {#tar-13}
---------------------------------------------------------------------------------------------------------------------------------------------------------------------------------------------------------------
****Refugee migration has become more important for the German labour market.** That was the case initially for migration from the eight most important asylum countries of origin, which include Syria. As of 2022, that held true for refugee movements from Ukraine as well. Refugees mainly come to Germany seeking protection -- that is, because they are fleeing war, violence and persecution. It tends to take longer to integrate them into the labour market than labour market-oriented immigrants. Refugees differ significantly from labour market-oriented immigrants in terms of both their demographic structure and skills. What is more, refugees include children, young people and single parents who, in the short term, are only available to the labour market to a limited extent or not at all. In addition, insufficient childcare facilities, language barriers or cultural obstacles sometimes prevent these people from being integrated sooner. Because of this, it often takes years to integrate refugees into the labour market. But over the long run, refugee migration has also added distinctly to employment growth.**{#par-e76u9e}
**4 Levers for labour supply in Germany** {#tar-14}
---------------------------------------------------
****When assessing the possible levers for boosting labour input, it is worth considering the labour force participation of different population groups and the hours they work.** The main population groups of interest here are women and older people. This is because the labour force participation of men has been comparatively high for a long time and the vast majority of men work full-time.[\[18\]](#_ftn_root_18) Furthermore, very little can be changed about the demographically-induced contraction of the domestic population.**{#par-ioou34}
****Labour force participation among women and older people has increased significantly over the past two decades.** This raises the question as to whether there is scope for higher labour input and what role the prevailing framework conditions play in this regard.**{#par-aia2a8}
### **4.1 Female labour force participation up thanks to part-time work** {#tar-15}
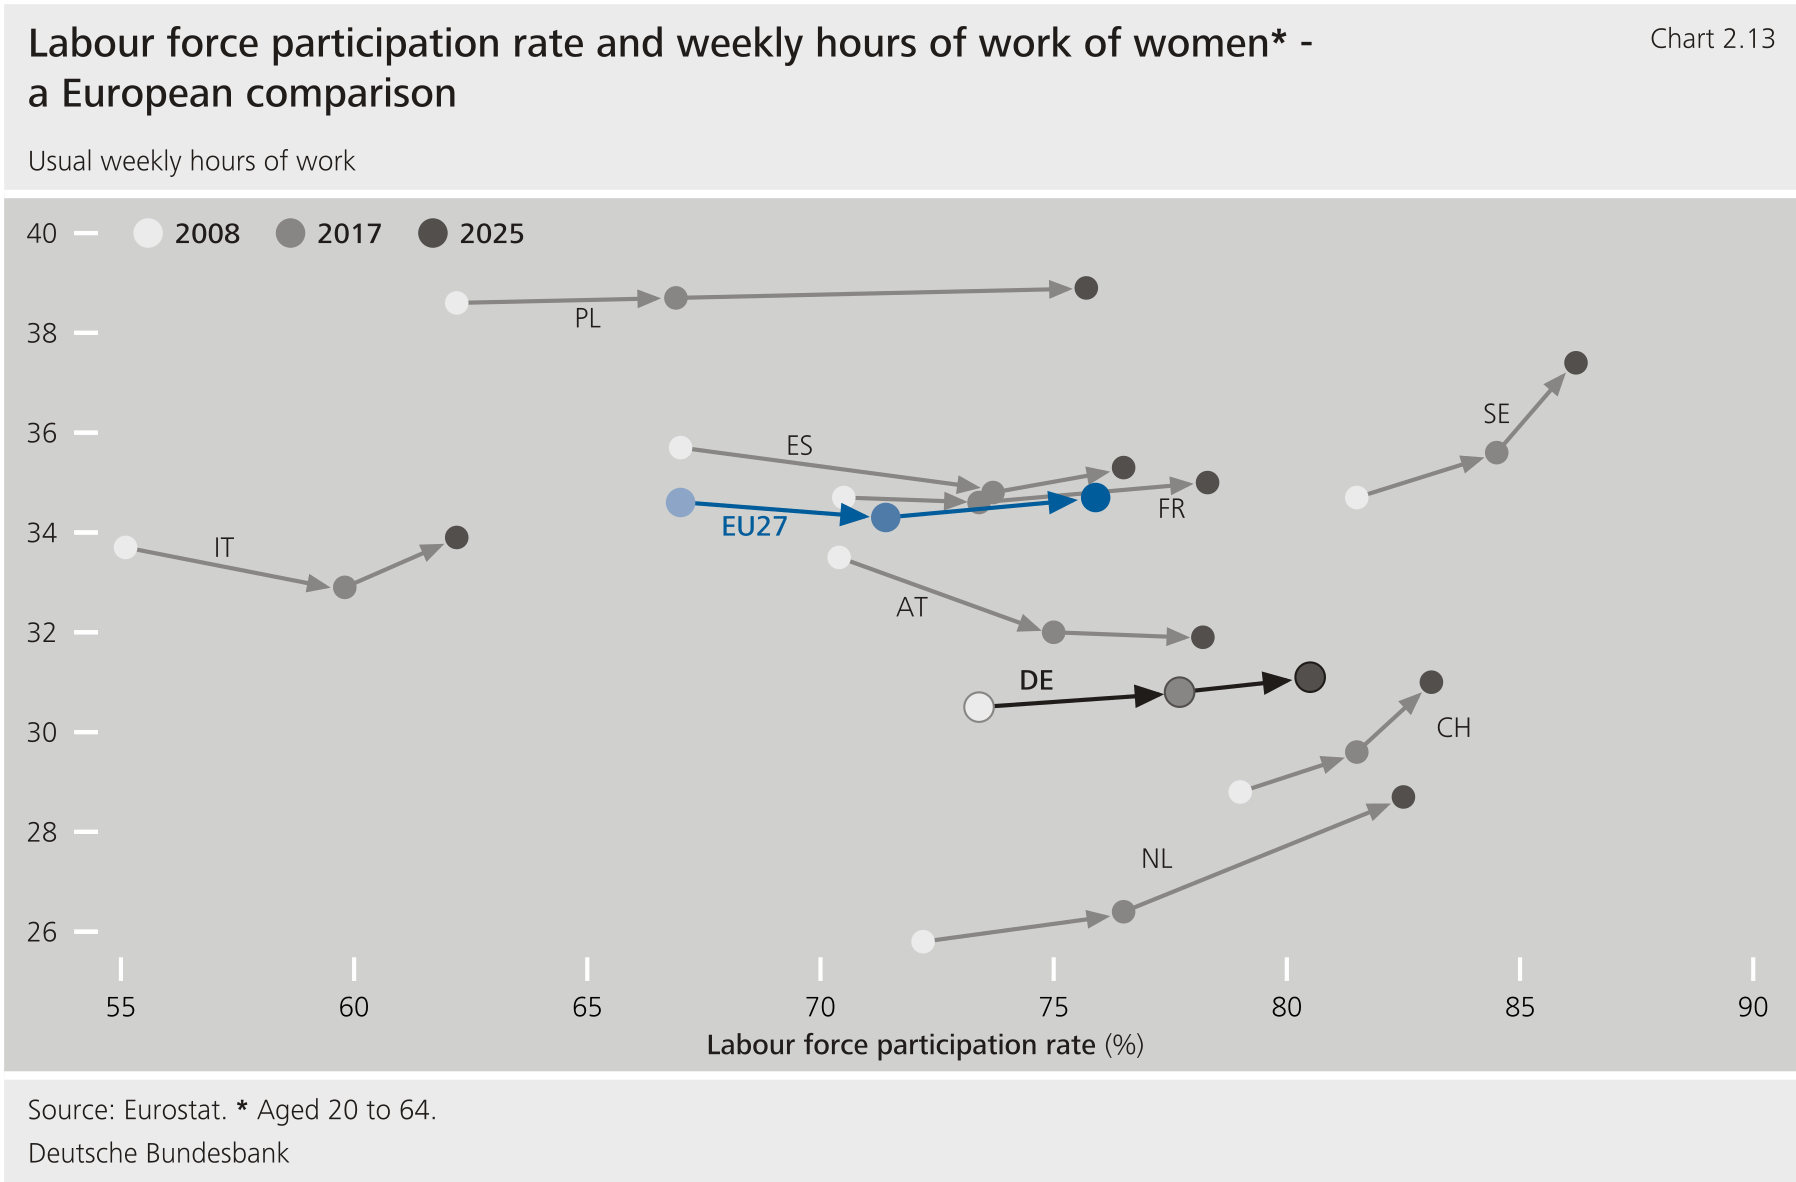
****Female participation in Germany has risen significantly in the past years, but mainly as a result of part-time employment.** Between 2008 and 2025, the labour force participation rate of women increased from 73 % to 81 %, which was higher than the average.[\[19\]](#_ftn_root_19) At the same time, Germany narrowed the gap to countries with traditionally high levels of female employment, such as Sweden. But while more women were in work, the majority of this growth was in part-time work. Accordingly, women's average usual weekly hours of work remained low by European standards. At the same time, there are surveys that have found that many women in part-time jobs want to increase their working hours.[\[20\]](#_ftn_root_20) In other Member States with high female participation rates, women's average weekly hours of work have also risen significantly since 2017.**{#par-i723u7}
**** {#tar-16}
----------------------------------------------------------------------------------------------------------------------------------------------------------------------------------------------------------------------------------------------------------
****Studies attribute the high percentage of women in Germany working part-time by international standards to a combination of institutional, financial and cultural factors.** [\[21\]](#_ftn_root_21)In general, high benefit withdrawal rates give part-time employees less of an incentive to raise their weekly hours of work.[\[22\]](#_ftn_root_22) This is because a part-time employee who works more will often have any government benefits reduced or pay higher taxes and social security contributions. Difficulties in balancing work and family life because, say, childcare facilities are insufficient or absent altogether are regarded as another key obstacle to a higher labour supply of women in particular.[\[23\]](#_ftn_root_23) In addition, studies show that adverse financial incentives to work can dampen the labour supply of second earners.[\[24\]](#_ftn_root_24) That usually concerns married women.[\[25\]](#_ftn_root_25)Factors reported in this regard notably include joint income taxation of married couples, non-contributory co-insurance of spouses in the statutory health insurance scheme, the entitlement of civil servants' spouses to claim healthcare subsidies up to certain income thresholds, as well the possibility of working in marginal employment at the same time.[\[26\]](#_ftn_root_26)**{#par-au4348}
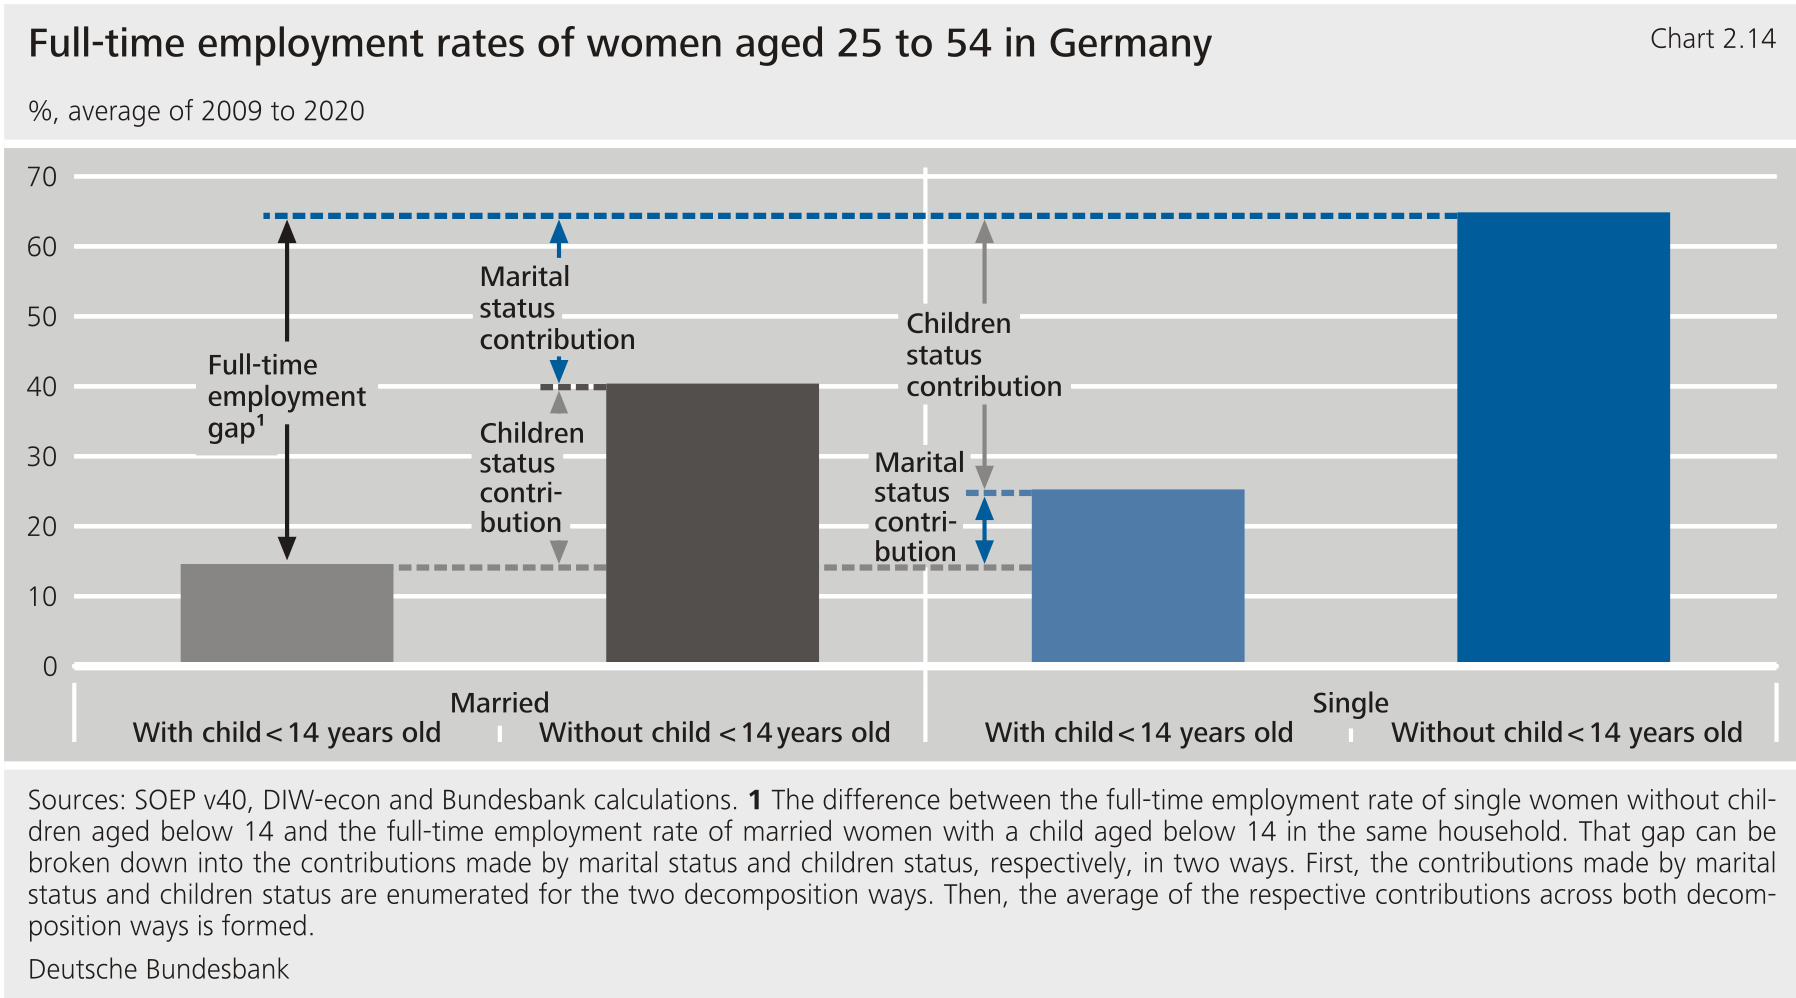
****Using a novel analysis of** **data, it is possible to assess the significance of adverse financial incentives to work relative to the childcare situation in a labour supply decision.** [\[27\]](#_ftn_root_27) In this exercise, the average full-time employment rate of single women without children is compared with that of married women with at least one child under the age of 14 in their own household.[\[28\]](#_ftn_root_28) The difference can be broken down into the contributions made by marital status and children status, respectively. The "marital status contribution" captures differences between married and single women, each exclusively with and without children. It therefore largely reflects the adverse financial incentives to work associated with the marital status of being married. The "children status contribution", meanwhile, records differences between women with the same marital status with and without children. It thus roughly reflects the more difficult conditions that working women with children face. It is not possible to isolate the significance of prevailing role models with this approach. Those role models will probably help shape the contributions of both the marital and children statuses.**{#par-a25ae6}
****The findings suggest that both limited childcare opportunities and adverse financial incentives to work for married women contributed to the comparatively low full-time employment rate of women in Germany.** [\[29\]](#_ftn_root_29) In arithmetical terms, around two-thirds of the gap in the full-time employment rate between single women without children and married women with children is attributable to the fact that the latter have children. Roughly one-third is explained by the contribution of the marital status of "married". The finding that the full-time employment rate is lower among married women, both those with and without children, still holds when married women are compared only with those single women who co-habit with a partner in a shared household without being married. It would therefore appear that the contribution of the marital status of "married" originates not from co-habiting with a partner but from characteristics that are specifically associated with the legal status of "married".**{#par-a2u482}
**** {#tar-17}
---------------------------------------------------------------------------------------------------------------------------------------------------------------------------------------------------------------------------
****The relative significance of marital status and children in the household differs by household situation and phase of life.** The full-time employment rate declines significantly with the number of children and rises noticeably with the age of the youngest child. This suggests that balancing work and family life becomes increasingly challenging as the number of children rises. But even when children are older, full-time employment rates are still significantly lower than they are for childless women.[\[30\]](#_ftn_root_30) Moreover, as women's level of education rises, full-time employment rates rise significantly and the contribution made by the marital status of "married" becomes less important.[\[31\]](#_ftn_root_31) Meanwhile, the contribution of the marital status of "married" gains in importance if the spouse has a higher level of education and thus typically a higher income. Consistent with this, a higher joint income is taxed more under the progressive tax regime. For this reason, any additional work done by a second earner will be subject to relatively high tax rate, even if their own individual income is fairly low, thus significantly reducing the incentive to work.**{#par-uo8o9a}
### **4.2 Part-time employment rate of older people high and rising** {#tar-18}
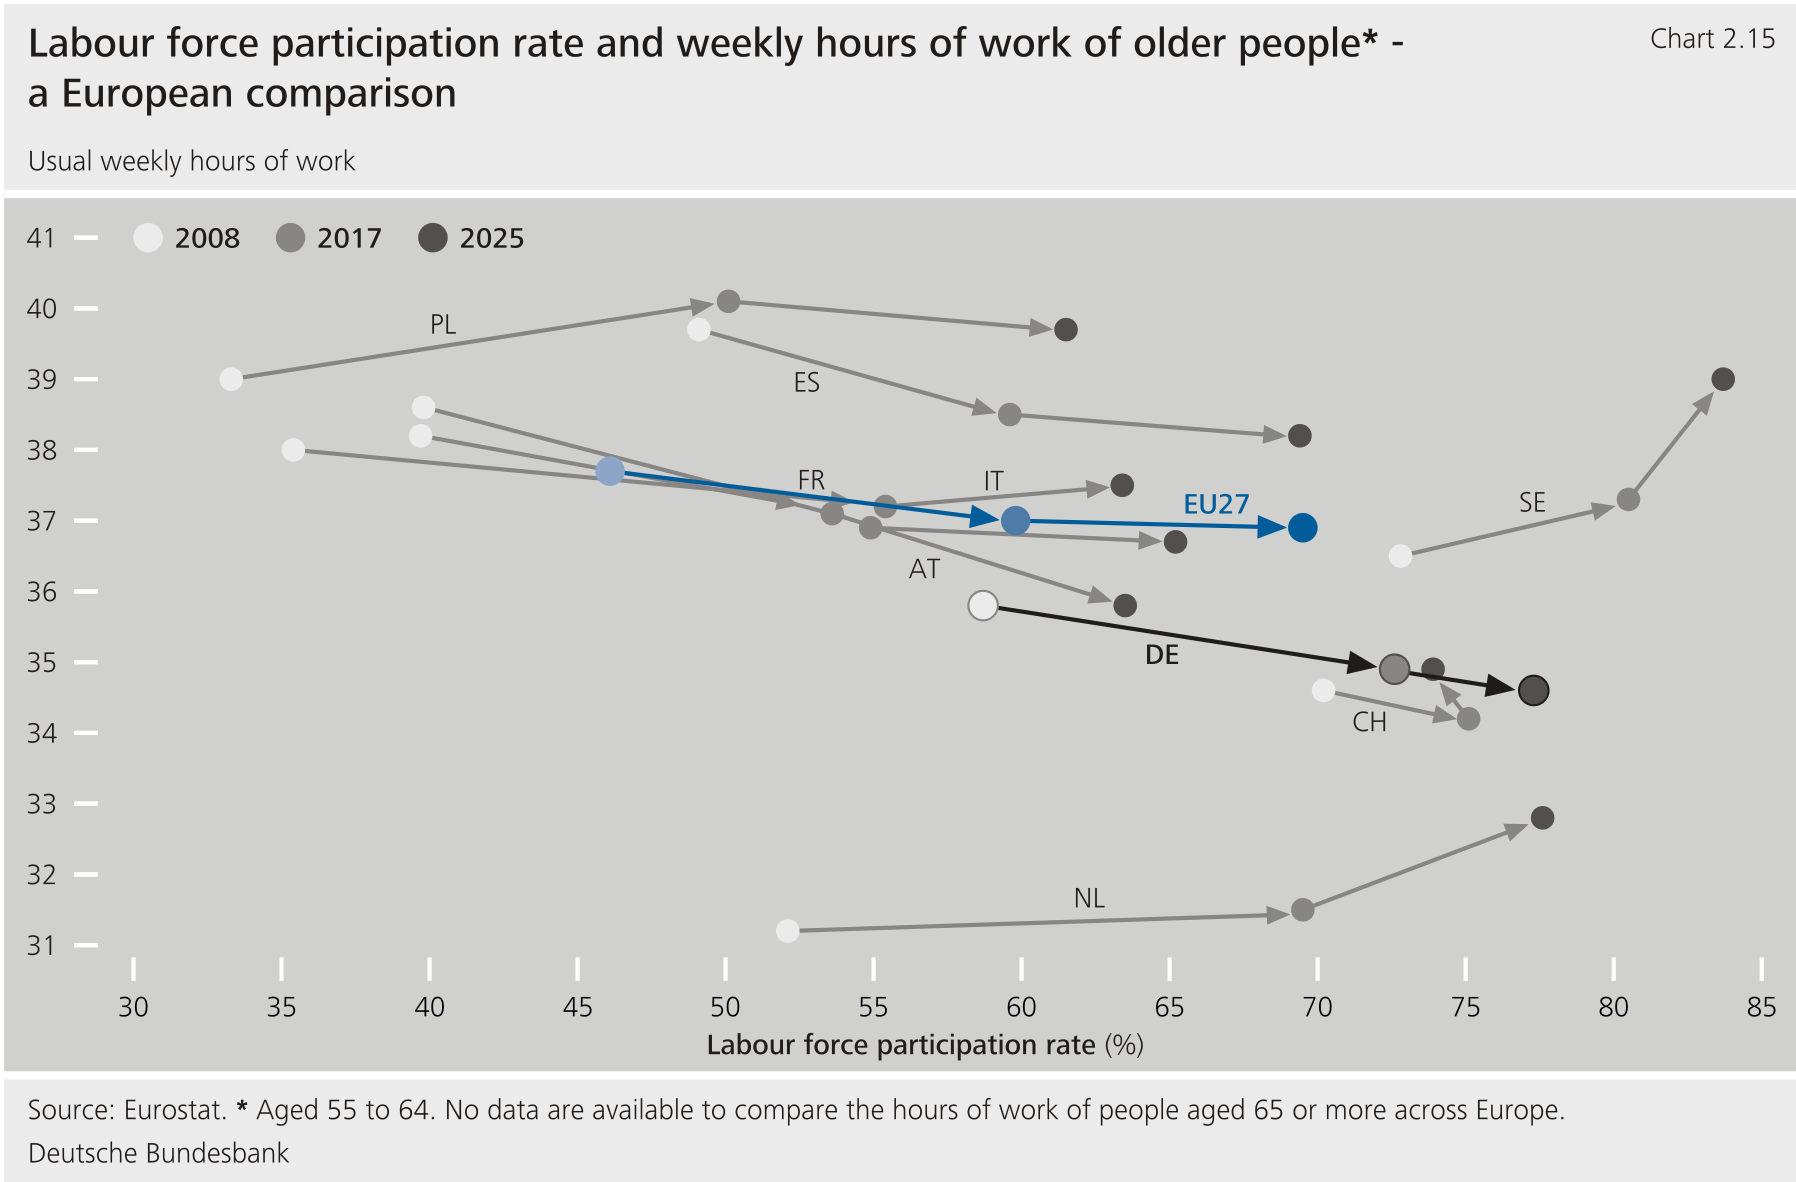
****Participation among people aged 55 to 64 in Germany has also risen significantly in recent years, while their average hours of work have fallen.** Between 2008 and 2025, this age group's labour force participation rate rose from 59 % to 77 % and is now higher than the EU27 average.[\[32\]](#_ftn_root_32) Their average usual weekly hours of work, meanwhile, dropped from 35.9 to 34.2 hours and remained well below the European average. Many additional employed persons in this age group work part-time or are using glidepaths into retirement.**{#par-a6eo1e}
**** {#tar-19}
-----------------------------------------------------------------------------------------------------------------------------------------------------------------------------------------------------------------------------------------------------------------
****The current framework conditions provide incentives to retire early.** The statutory age of retirement age in 2024 was 66 years. According to the German Pension Insurance, the average age at which people retired to draw an old-age pension in 2024 was far lower than that, at 64.7 years. One important reason for that is the option of drawing a full pension -- that is, a pension with any benefit reductions -- after 45 years of contributions. This is the second most frequent point at which people enter retirement, after the statutory retirement age. In 2024, roughly 269,000 people, or around 29 % of all new retirees, retired in this manner.[\[33\]](#_ftn_root_33) It is often said that this rule enables people in physically or mentally stressful jobs to retire earlier. A study, however, shows that this channel was also being used by many people who did not work in such demanding professions.[\[34\]](#_ftn_root_34) What is more, the fairly small deductions that are applied when people retire early are another factor that weakens the incentives for older people to work.[\[35\]](#_ftn_root_35)**{#par-a8ae75}
### **4.3 Build on labour market achievements** {#tar-20}
****The comparatively low average weekly hours of work in Germany show, first and foremost, that women and older people have been successfully integrated into the labour market.** Thus, today's part-time workers tend to be people who, in the past, would have stopped working or would not have been working in the first place. This has been due, in part, to reforms such as expanding childcare facilities, raising the statutory age of retirement and limiting the scope for retiring early.**{#par-a8ou7o}
****Nevertheless, the existing framework conditions discourage women and older people from working more in some cases.** A higher labour input would strengthen not just growth, but the financing of the social security funds as well. Reforms that raise the incentives to work would therefore deliver twin benefits: they would increase total hours worked, thus boosting growth, and they would curb the demographically-induced rise in social security contributions.[\[36\]](#_ftn_root_36) This is because higher labour force participation and longer working hours reinforce the funding base of the social security funds. By the same token, permanently higher contribution rates would weaken incentives to work and dampen labour input.[\[37\]](#_ftn_root_37) That is relevant in Germany, in particular, because the tax and social security burden is already high by international standards.[\[38\]](#_ftn_root_38)**{#par-u89o83}
**5 Potential for higher labour input** {#tar-21}
-------------------------------------------------
****Scenarios for immigration, labour force participation and hours worked are considered to create an estimate for the scope for a higher potential labour force over the medium term.** The analyses so far show that women, older people and immigrants have made a considerable contribution to the expanded labour supply in Germany in recent years. Overall, the question arises as to what degree more immigration, higher hours worked for part-time employees and a further increase in labour force participation can mitigate the reduction in labour input due to demographic change. Scenarios are defined and extrapolated to answer this question.**{#par-i96a35}
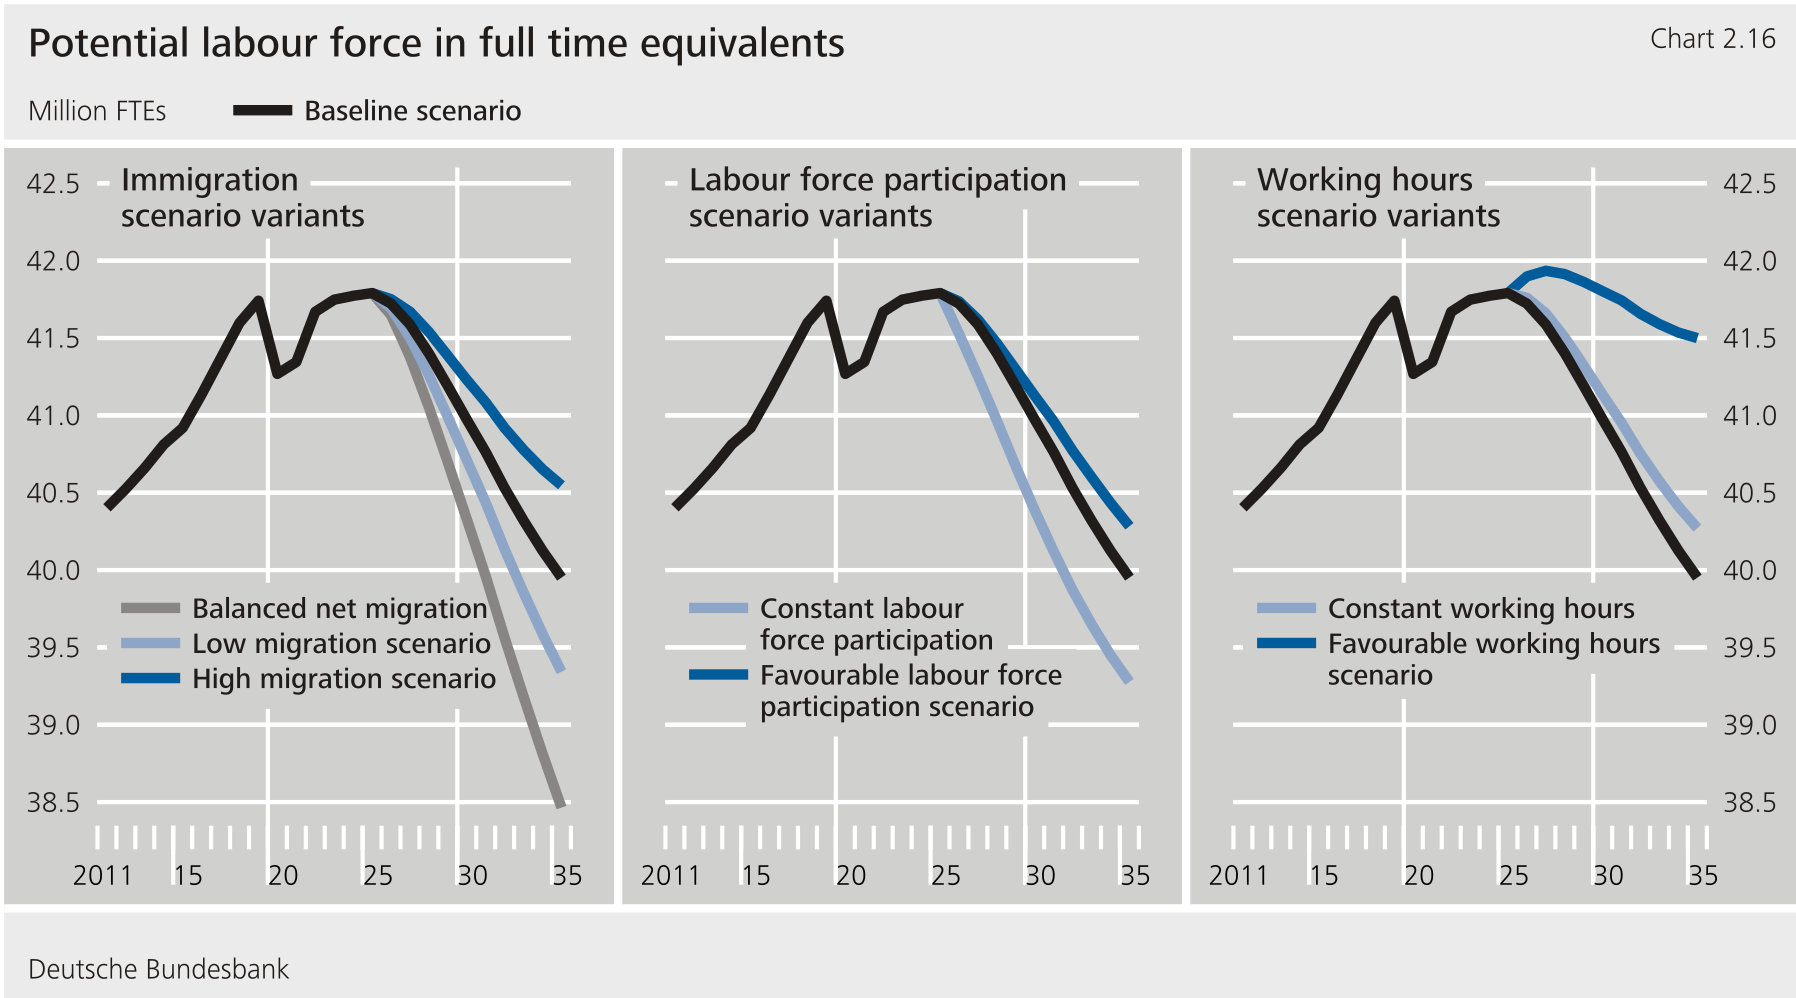
****The baseline scenario depicts the likely evolution of potential labour supply.** It assumes that immigration will moderate somewhat compared with recent years, that age-specific labour force participation will continue to rise -- taking into account the already sharp rise in labour force participation rates -- and that the current downward trend in hours worked will weaken. This baseline scenario takes into account changes in the economic policy framework provided that these have already been adopted or planned out in sufficient detail by the Federal Government. The projection of the potential labour force extends over the next ten years up to 2035. It is calculated in full-time equivalents () to reflect the impact of hours worked.[\[39\]](#_ftn_root_39)**{#par-ae14i4}
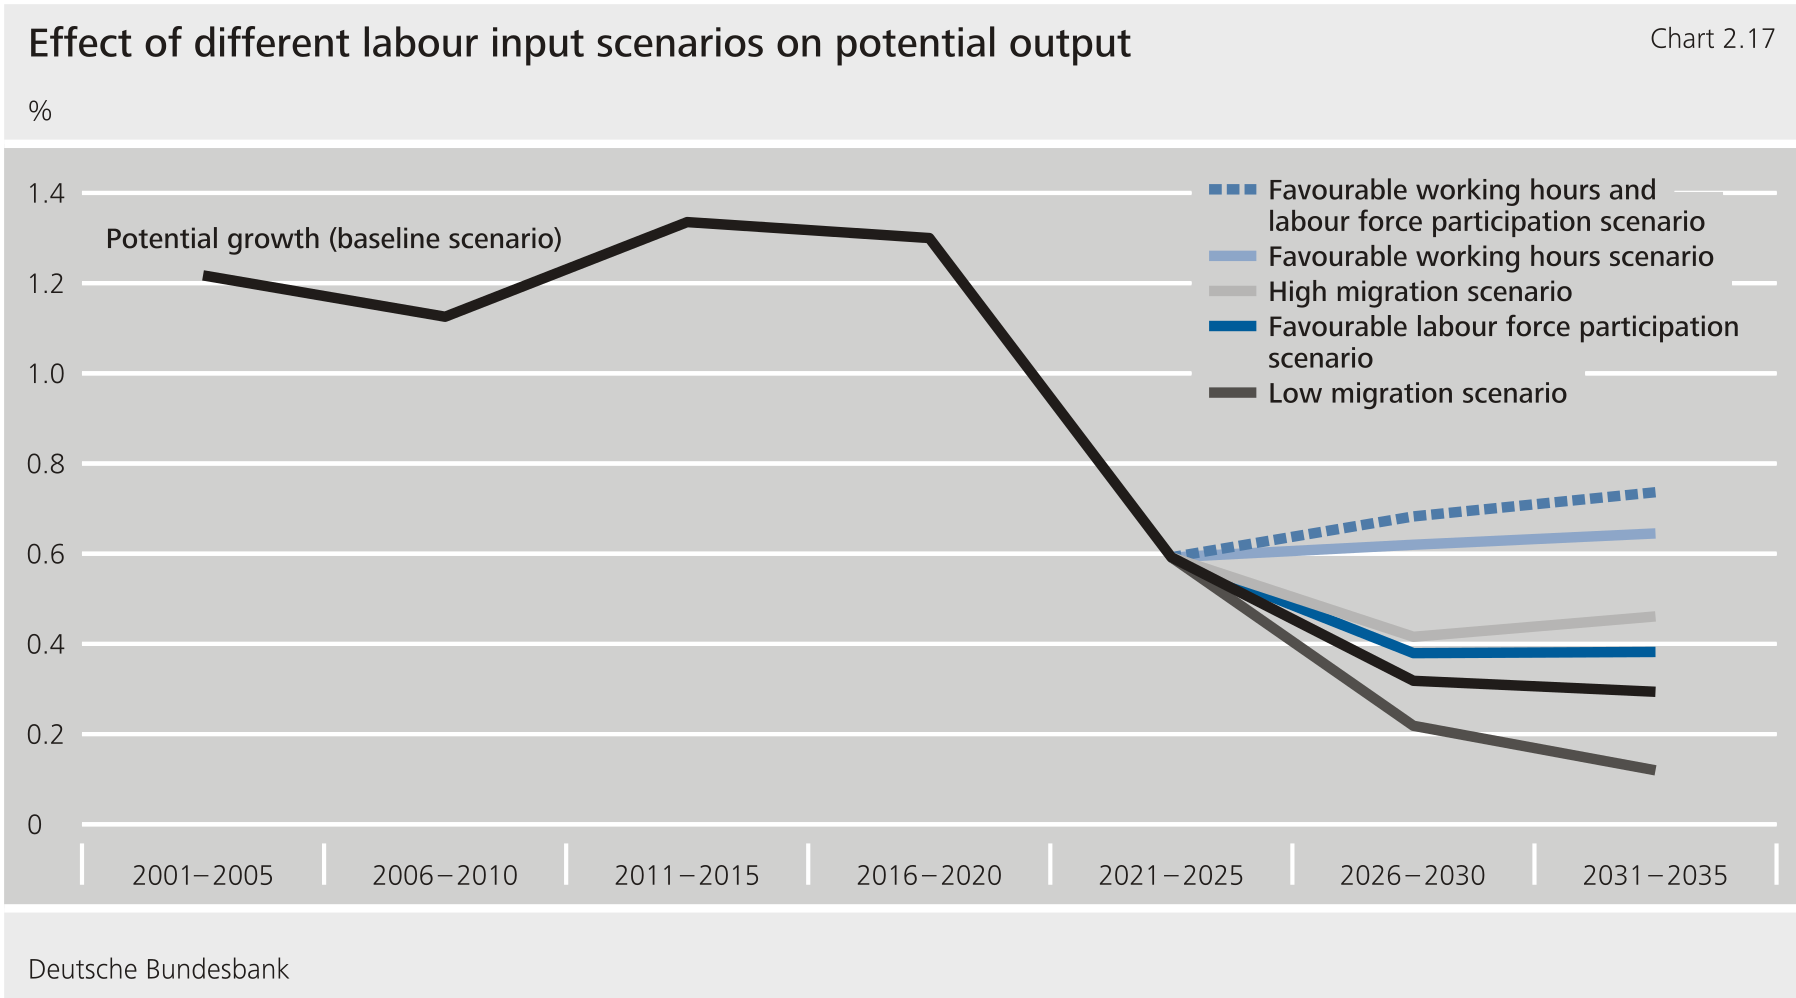
****In the baseline scenario, the potential labour supply will decline from this year onwards.** It will fall by just under ½ % on average per year over the next ten years. Despite the assumed further rise in age-specific labour force participation, the negative effects of demographic ageing are predominant. On balance, the resulting decline in labour input reduces potential output growth by 0.3 percentage point per year. The decline in labour input is thus an important factor in the weak potential growth of only 0.3 % per year.**{#par-io7114}
****To illustrate the potential for a greater labour supply, the analysis features varied scenarios for immigration, labour force participation and hours worked.** In the baseline scenario, net immigration is assumed to be 250,000 persons per year.[\[40\]](#_ftn_root_40) Between 2010 and 2025, net immigration -- excluding the exceptionally high influxes of refugees in 2015 and 2022 -- averaged around 370,000 persons per year. However, it has declined significantly of late and amounted to 235,000 persons in 2025, according to data from the Federal Statistical Office. The variant migration scenarios include a high average (annual net immigration of 350,000 persons over the medium term, based on the volume in recent years), a low average (150,000 persons) and a balanced level of migration.[\[41\]](#_ftn_root_41) With regard to labour force participation, the favourable scenario is based on coupling the retirement age to life expectancy after 2031.[\[42\]](#_ftn_root_42) In addition, it is assumed that labour force participation rates in Germany will gradually increase further up to 2035, converging with Swedish levels. This is because Sweden is considered an example of best practice in Europe in terms of labour force participation. This particularly applies to women and older people.[\[43\]](#_ftn_root_43) The favourable scenario for hours worked mainly assumes that women would work longer hours.[\[44\]](#_ftn_root_44) In another variant with constant individual working time behaviour -- in which only the age structure effect has an impact -- the result lies between the favourable and the baseline scenario.**{#par-i9e75o}
****The strongest stabilising effect for the labour supply occurs in the scenario featuring an increase in hours worked.** In this scenario, the average hours worked increase by 1.3 hours per week compared with the basic variant. This would close slightly less than half of the gap of around 3 hours per week compared with the average of other countries. By contrast, the reserves available to increase the labour force participation rate -- beyond what was already expected -- are only relatively small. With regard to migration, it is unlikely that the high numbers of immigrants in recent years will be maintained over the next few years. If immigration stopped entirely or was only at a low level, this would place a considerable further strain on labour input.**{#par-oa81ea}
**** {#tar-22}
--------------------------------------------------------------------------------------------------------------------------------------------------------------------------------------------------------------
****Extending labour input would significantly strengthen potential growth.** In the scenario with higher hours worked, potential growth would be 0.6 % per year on average between 2026 and 2035. The average annual growth rate would thus be 0.3 percentage point higher than in the baseline scenario. In addition to the direct potential effects of a higher total hours worked, positive indirect effects on capital input also play a role here. This is because, in the medium term (i.e. between 2029 and 2035), developments in the formation of tangible capital are assumed to be based on developments in the labour supply.[\[45\]](#_ftn_root_45) If hours worked and labour force participation rise simultaneously, potential growth could even be 0.4 percentage point higher than in the baseline scenario. By contrast, if there were no improvements and net immigration fell to 150,000 persons per year, potential growth would be 0.1 percentage point lower per year.[\[46\]](#_ftn_root_46) In the balanced net migration scenario, potential growth per year would be 0.3 percentage point lower.**{#par-e57e21}
**** {#tar-23}
-----------------------------------------------------------------------------------------------------------------------------------------------------------------------------------------------------------------------------
****The scenarios show that the demographic decline in labour input can be mitigated at least in part.** The scenarios regarding hours worked and labour force participation reflect potential that is not fully exploited under the current framework conditions. Increased hours worked and greater labour force participation appear to be achievable if reforms are implemented. By contrast, the scope for immigration is more limited. Given demographic ageing is also happening in many countries of origin, the higher immigration scenario is unlikely to be permanently achievable solely due to better framework conditions. Nevertheless, reforms remain important to promote labour market-oriented immigration.**{#par-i7ua63}
**6 Economic policy implications** {#tar-24}
--------------------------------------------
****Demographic change can hardly be halted, but its economic consequences can be limited.** In the coming years, it will significantly dampen labour input and growth. Many employed baby boomers will then retire. The Federal Government has already initiated individual measures to strengthen incentives to work and limit rising social security contributions. These include reforms to the basic allowance system and projects intended to dampen the rise in social security contribution rates for the statutory health and long-term care insurance schemes. Nevertheless, there are still considerable additional opportunities for action.**{#par-a3e4o1}
****An important lever for increasing the labour supply is likely to be to improve the framework conditions for longer hours worked for part-time employees.** Further expansion of childcare could facilitate full-time and near-full-time employment. Despite progress, there are still gaps in care. This applies not only to the number of spots, but also to childcare hours and reliability.[\[47\]](#_ftn_root_47) In addition, the tax and social contributions system could be used to strengthen incentives to work for second earners. Amongst other things, changes are currently being discussed to the non-contributory co-insurance scheme for the statutory health and long-term care insurance schemes, to marginal employment ("mini-jobs") and to splitting income taxation between married couples. A (moderate) reduction in the non-contributory co-insurance scheme is currently being discussed as part of the reform plans for the statutory health insurance scheme and the long-term care insurance scheme. In addition, the lump-sum contribution rate in marginal employment is set to rise to the average contribution rate. There are various reform proposals for splitting income taxation between married couples, which can also increase incentives to work for second earners. These differ greatly in their effects on labour supply and tax revenue, as well as in their legal scope.[\[48\]](#_ftn_root_48)**{#par-u9822a}
****Other factors are relevant in terms of overall incentives to work.** For example, it is important to limit the foreseeable sharp rise in contribution rates for the social security funds as far as possible. This would also be helped by increased labour input. The high benefit withdrawal rates are also important.[\[49\]](#_ftn_root_49) It is certainly also a factor here that transfers in the event of unemployment are geared to the willingness to work.**{#par-iea9i5}
****Labour supply can also be strengthened by reducing incentives to retire early.** Data on the actual retirement age suggest that individual age limits play an important role. The option of a full pension after 45 years of insurance contributions provides considerable incentives for early retirement. In addition, the pension reductions for early retirement appear to be too low overall. Moreover, it has become apparent that, when the minimum ages are raised, the actual retirement age follows the statutory retirement minimum ages fairly closely. To extend working lives, it is therefore important to link the statutory retirement age (for the period after 2031) and the minimum age for retiring early on a reduced pension to life expectancy. Additional years of life should be partly spent in a longer period of employment. These measures would not only increase the labour supply but also limit the increase in social security contribution rates.[\[50\]](#_ftn_root_50)**{#par-oeiu9a}
****Qualified immigration from third countries should be facilitated further.** The Skilled Immigration Act (Fachkräfteeinwanderungsgesetz) already creates a comparatively liberal framework for this. However, bureaucratic obstacles to visas, recognition of educational qualifications and integration continue to make immigration of skilled workers considerably more difficult. More digitalisation, uniform procedures and central points of contact could speed up processes. The planned Work and Stay Agency could help here. However, rapid and consistent implementation is crucial. At the same time, Germany should retain foreign skilled workers more strongly in the long term, for example through better integration, language promotion and reliable prospects for staying.**{#par-o3ii2a}
****Further education is becoming increasingly important as a result of technological and structural change.** Expertise is becoming obsolete more quickly and job profiles are constantly changing. Employed persons and enterprises should therefore make greater joint efforts to promote further training. Labour market policy can also strengthen incentives for qualifications. Stronger incentives could be gained, in particular, by the low-skilled unemployed for longer-term training measures. Especially in times of rapid technological change, current skills are becoming increasingly important in order to use new technologies profitably for higher productivity growth.**{#par-o972i6}
**Technical annex: Methodology for estimating the effects of demographic ageing on growth using regional data** {#tar-25}
-------------------------------------------------------------------------------------------------------------------------
****An instrumental variables approach from the literature is used to estimate the causal growth effects of demographic ageing.** [\[51\]](#_ftn_root_51) The data basis comprises regional data on , total hours worked and persons in employment from the regional accounts of the federal states as well as population data at district level (400 districts) from the Federal Statistical Office (Destatis) for the period from 2000 to 2021.[\[52\]](#_ftn_root_52) The causal estimation of ageing effects is complicated by possible interactions between demographic ageing and growth (endogeneity). For example, regional differences in economic output can affect migration or mortality.[\[53\]](#_ftn_root_53) Younger people may, for instance, increasingly move to districts where the economic output is high or expected to be high. On the other hand, higher economic growth can lead to a greater increase in life expectancy than in less rapidly growing regions. This can be the case, for example, if economic development contributes to rising living standards and healthier lifestyles.**{#par-a124u6}
****The econometric estimation regresses the change in** **per capita on the change in the population share of older people.****{#par-e3u6e7}
**$$ \\begin{align} ln \\left(\\frac{GDP_{s,t+z}}{N_{s,t+z}} \\right) − ln \\left(\\frac{GDP_{s,t}}{N_{s,t}} \\right) \&= \\beta \\left\[ln \\left(\\frac{A_{s,t+z}}{N_{s,t+z}} \\right) − ln \\left(\\frac{A_{s,t}}{N_{s,t}} \\right) \\right\] \\\\ \&+ X′_{s,t} \\delta_t + \\gamma_s + \\gamma_t + \\gamma_{Federal\\ state,t} \\\\ \&+ \\varepsilon_{s,t+z} \\end{align} $$**{#par-u6o853}
**The focus here is the share of persons aged between 60 and 74 years of age in the number of persons aged between 20 and 74 years of age (\\( \\frac{A}{N} \\)). As a robustness test, different time horizons (\\( z \\)) are used to calculate growth rates.[\[54\]](#_ftn_root_54) The estimated elasticity \\( \\beta \\) measures the effect of the population structure on per capita ( in relation to the number of persons aged between 20 and 74 years; \\( \\frac{GDP}{N} \\)). The vector \\( X \\) contains control variables. This is how effects resulting from district-specific differences in the sectoral structure of the economy are taken into account. This is achieved by factoring in district-variable and time-variable sectoral employment shares in the estimation. In addition, various district-invariant and time-invariant fixed effects are taken into account in the estimation.[\[55\]](#_ftn_root_55) This addresses cyclical and price effects at the federal and state levels (\\( \\gamma_t \\) and \\( \\gamma_{Federal\\ state,t} \\)). Fixed effects (for the trend; \\( \\gamma_s \\)) at the district level are taken into account as well. These fixed effects are intended to help adjust the results for effects arising from transfers or commuting.[\[56\]](#_ftn_root_56) \\( \\varepsilon_{s,t} \\) is the disturbance term for district-specific per capita growth. In order to be able to draw conclusions on aggregate growth and productivity effects, in the estimation the observations are weighted by the population in the starting year. The coefficients are estimated using two-stage least squares.**{#par-u89481}
****District-specific variations in demographic developments independent of economic output are used as an instrument for the actual change in the population structure.****{#par-u5411u}
**$$ \\Delta \\left( \\frac{\\hat A_{s,t+z}}{\\hat N_{s,t+z}} \\right) = ln \\left( \\frac{\\hat A_{s,t+z}}{\\hat N_{s,t+z}} \\right) − ln \\left( \\frac{A_{s,t}}{N_{s,t}} \\right) $$**{#par-a65758}
**where**{#par-oo8372}
**$$ \\hat A_{s,t+z} = \\sum_{60 \\leq j \\leq 74} \\hat N_{j,s,t+z} = \\sum_{60 \\leq j \\leq 74} N_{j,s,t} \\cdot SP(z)_{j,t} $$**{#par-a1422i}
**$$ \\hat N_{s,t+z} = \\sum_{20 \\leq j \\leq 74} \\hat N_{j,s,t+z} = \\sum_{20 \\leq j \\leq 74} N_{j,s,t} \\cdot SP(z)_{j,t} $$**{#par-eii338}
**As survival probabilities of individuals change little over time, the population of a district can be predicted with a high degree of accuracy. This means that for rates of change between points in time \\( t \\) and \\( t+z \\), the age coefficient in each district is extrapolated \\( z \\) years into the future based on the actual population of a district in the starting year \\( t \\) (initial age structure). The estimation results are thus adjusted for interactions between economic output and migration. The number of inhabitants is extrapolated for different ages using aggregate statistical survival probabilities (\\( SP \\)) based on data from the Federal Statistical Office.[\[57\]](#_ftn_root_57)**{#par-iui9io}
****According to estimation results, demographic ageing significantly dampened** **per capita in Germany** (Table 2.1). The results are statistically highly significant and very similar for different time horizons of growth rates. They show that an increase of 1 % in the share of the population aged 60 to 74 (among those aged 20 to 74) reduced per capita (of those aged 20 to 74) by around 0.2 %.**{#par-oo6a6e}
****According to the first-stage** **regression, the instruments are strong.** [\[58\]](#_ftn_root_58) Despite the high correlation between the instrument and the instrumented change in the age structure, there are large differences between the instrumental variables (IV) estimators and the simple ordinary least squares () estimators for the ageing effect.[\[59\]](#_ftn_root_59) This suggests that interactions between economic output and ageing play an important role.[\[60\]](#_ftn_root_60)**{#par-a2a1oe}
|-----------------------------------|------------------|------------------|------------------|
| **Table 2.1: Main estimate results** ||||
| **Variablen** | **3-year rates** | **5-year rates** | **7-year rates** |
| Dependent variable | Δ ( (GDP/N) \\) |||
| Panel A: Reduced-form estimator | |||
| Δ \\( ( \\hat{A} / \\hat{N} ) \\) | − 0.253\*\*\* | − 0.222\*\*\* | − 0.201\*\*\* |
| Δ \\( ( \\hat{A} / \\hat{N} ) \\) | (0.062) | (0.070) | (0.070) |
| Dependent variable | Δ\\( (A/N) \\) |||
| Panel B: First-stage estimator | | | |
| Δ \\( ( \\hat{A} / \\hat{N} ) \\) | 0.952\*\*\* | 0.934\*\*\* | 0.939\*\*\* |
| Δ \\( ( \\hat{A} / \\hat{N} ) \\) | (0.014) | (0.018) | (0.018) |
| First-stage F-statistic | 304.89 | 227.22 | 258.42 |
| Dependent variable | Δ\\( (GDP/N) \\) |||
| Panel C: Instrument estimator | |||
| Δ\\( (A/N) \\) | − 0.265\*\*\* | − 0.239\*\*\* | − 0.214\*\*\* |
| Δ\\( (A/N) \\) | (0.066) | (0.076) | (0.076) |
| Dependent variable | Δ\\( (GDP/N) \\) |||
| Panel D: estimator | |||
| Δ\\( (A/N) \\) | − 0.077 | − 0.049 | − 0.087 |
| Δ\\( (A/N) \\) | (0.059) | (0.064) | (0.066) |
| Number of observations | 2,800 | 1,600 | 1,200 |
| Source: Bundesbank calculations. Notes: Cluster-robust standard errors (at district level) in brackets. Each observation is weighted by the population of the initial period. Control variables: District dummies; year dummies; federal state dummies interacted with year dummies; the logarithm of the share of employed persons in the initial period working in each of the following () sectors: A (agriculture), B-E (production sector excluding construction), F (construction), G-J (trade, transportation and storage, accommodation and food service activities, information and communication), K-N (financial and insurance activities, business services), O-T (public services). The variables on the sectoral employment structure are also interacted with year dummies to allow the impact of the initial economic structure to vary by year. Regressions with 3-year windows cover the years 2003, 2006, 2009, 2012, 2015, 2018, and 2021. Regressions with 5-year windows cover the years 2006, 2011, 2016, and 2021. Regressions with 7-year windows cover the years 2007, 2014, and 2021. ||||
{#par-o219oe}
****A decomposition analysis provides insights into which channel may be particularly hindering growth.** The impact of demographic ageing on per capita can be broken down into the following components:**{#par-u7o2a8}
* **per hour worked (labour productivity);**
* **hours per employed person (average hours worked by employed persons);**
* **as well as the ratio of employed persons to total population (encompasses the labour force participation rate and the employment rate).**
****According to the decomposition analysis, around half of the negative marginal effect on per capita** **is attributable to an ageing-related reduction in labour productivity** (Table 2.2).[\[61\]](#_ftn_root_61)The results show that an increase of 1 % in the share of the population aged 60 to 74 (among those aged 20 to 74) reduced hourly productivity by around 0.1 %. The productivity effect is also statistically significant over different growth rate time horizons. By contrast, the results do not show any negative ageing effect on average hours worked in the past.[\[62\]](#_ftn_root_62) The remaining half of the marginal effect is therefore attributable to a negative impact on participation behaviour.[\[63\]](#_ftn_root_63) Further regressions suggest that the adverse effect of demographic ageing on participation behaviour is mainly driven by the labour force participation rate (rather than the employment rate).[\[64\]](#_ftn_root_64)**{#par-e4oa83}
****The results can be used to infer past macroeconomic effects.** The estimated elasticities for the ageing effect on per capita and labour productivity, in conjunction with aggregated data, can be used to calculate macroeconomic growth and productivity effects. In Germany, the share of older persons (share of people aged 60 to 74 in the population aged 20 to 74) rose by around 13 % between 2000 and 2021.[\[65\]](#_ftn_root_65) According to the estimated elasticity, this means that in the hypothetical scenario without demographic ageing, per capita would have been 2.6 % higher in 2021 than with actual ageing. This corresponds to a decline in the annual growth rate of per capita of 0.12 percentage point as a result of the age structure effect. The productivity effect for the same period is − 1.3 %, or − 0.06 percentage point per year.**{#par-u341o4}
****The regional estimates are likely to provide a lower bound for the macroeconomic impact of ageing on** **per capita and productivity.** Macroeconomic effects (that is, aggregate trends) that have uniform effects across Germany or a federal state are, by construction, not taken into account in the regional estimate. However, the population is actually trending older across the whole country. Many economic consequences of demographic change (such as fiscal burdens or weaker innovation) affect all regions and can only be captured to a limited extent using regional comparisons. In addition, general equilibrium effects are hardly taken into account in this partial equilibrium framework.[\[66\]](#_ftn_root_66) Adjustment mechanisms can partially cushion economic burdens. For example, workers, firms and capital can be diverted between regions. However, if regional demographic ageing follows a common trend, such evasive action is much more difficult. The regional estimates presented are therefore likely to tend to underestimate the actual macroeconomic impact.**{#par-a9ii32}
|------------------------|------------------|------------------|----------------|----------------|
| **Table 2.2: Decomposition analysis** |||||
| Dependent variable | Δ\\( (GDP/N) \\) | Δ\\( (GDP/H) \\) | Δ\\( (H/L) \\) | Δ\\( (L/N) \\) |
| | (1) | (2) | (3) | (4) |
| Panel A: 3-year rates | ||||
| Δ\\( (A/N) \\) | − 0.261\*\*\* | − 0.180\*\*\* | 0.015 | − 0.091\*\* |
| Δ\\( (A/N) \\) | (0.065) | (0.051) | (0.011) | (0.039) |
| Number of observations | 2,758 | 2,758 | 2,758 | 2,758 |
| Panel B: 5-year rates | ||||
| Δ\\( (A/N) \\) | − 0.240\*\*\* | − 0.124\*\* | 0.008 | − 0.108\*\* |
| Δ\\( (A/N) \\) | (0.076) | (0.057) | (0.010) | (0.045) |
| Number of observations | 1,576 | 1,576 | 1,576 | 1,576 |
| Panel C: 7-year rates | ||||
| Δ\\( (A/N) \\) | − 0.215\*\*\* | − 0.108\* | 0.004 | − 0.097\*\* |
| Δ\\( (A/N) \\) | (0.076) | (0.056) | (0.011) | (0.040) |
| Number of observations | 1,182 | 1,182 | 1,182 | 1,182 |
{#par-ae81o3}
**List of references** {#tar-26}
--------------------------------
**Acemoglu, D. and P. Restrepo (2017), [Secular Stagnation? The Effect of Aging on Economic Growth in the Age of Automation](https://www.doi.org/10.1257/aer.p20171101). American Economic Review Vol. 107(5), pp. 174-179.**{#par-a422e5}
**Aksoy, Y., H. S. Basso, R. P. Smith and T. Grasl (2019), [Demographic Structure and Macroeconomic Trends](https://www.doi.org/10.1257/mac.20170114), American Economic Journal: Macroeconomics, Vol. 11(1), pp. 193-222**{#par-o144iu}
**Arce, O., A. Consolo, A. Dias da Silva and M. Weissler (2025), [Foreign workers: a lever for economic growth.](https://www.ecb.europa.eu/press/blog/date/2025/html/ecb.blog20250508~897078ce87.en.html) The Blog, 8 May 2025.**{#par-o9i6a6}
**Baslandze, S., Z. Edwards, J. R. Graham, T. McClure, M. Sparks, B. Meyer, S. Ravindranath Waddell and D. Weitz (2026), [Artificial Intelligence, Productivity, and the Workforce: Evidence from Corporate Executives](https://doi.org/10.29338/wp2026-04), Working Paper 2026-4, Federal Reserve Bank of Atlanta.**{#par-auaa5a}
**Bick, A. and N. Fuchs-Schündeln (2018), [Taxation and labour supply of married couples across countries: A macroeconomic analysis](https://doi.org/10.1093/restud/rdx057), The Review of Economic Studies, Vol. 85(3), pp. 1543-1576.**{#par-ei29uu}
**Bick, A., B. Brüggemann, N. Fuchs-Schündeln and H. Paule-Paludkiewicz (2019), [Long-term Changes in Married Couples' Labor Supply and Taxes: Evidence from the and Europe Since the 1980s](https://doi.org/10.1016/j.jinteco.2019.01.014), Journal of International Economics, Vol. 118(C), pp. 44-62.**{#par-o79io6}
**Blömer, M., C. Fuest, A. Peichl (2021), [Raus aus der Zweitverdienerinnenfalle: Reformvorschläge zum Abbau von Fehlanreizen im deutschen Steuer- und Sozialsystem](https://hdl.handle.net/10419/272937), Forschungsberichte No 126.**{#par-u2i4o2}
**Bloom, D., D. Canning and J. Sevilla (2001), [Economic growth and the demographic transition,](https://www.nber.org/papers/w8685) National Bureau of Economic Research, Working Paper No 8685.**{#par-ia94ie}
**Boddin, D., M. Köhler and P. Smietanka (2023), [Bundesbank Online Panel -- Firms (-F), Data Report 2023--07](https://doi.org/10.12757/BBk.BOPF.2022Q2.01), Deutsche Bundesbank, Research Data and Service Centre.**{#par-e3aaiu}
**Boelmann, B., A. Raute and U. Schönberg (2025), [Wind of Change? Cultural determinants of maternal labour supply](http://www.doi.org/10.1257/app.20220567), American Economic Journal: Applied Economics, Vol. 17(2), pp. 41 - 74.**{#par-o9e54a}
**Brynjolfsson, E., B. Chandar and R. Chen (2025), [Canaries in the Coal Mine? Six Facts about the Recent Employment Effects of Artificial Intelligence](https://digitaleconomy.stanford.edu/publications/canaries-in-the-coal-mine/), Working Paper.**{#par-e43115}
**Buslei, H., L. Felder, J. Geyer and P. Haan (2024), [Rente nach 45 Jahren: Auch Personen mit geringer Arbeitsbelastung gehen frühzeitig abschlagsfrei in Ruhestand](https://doi.org/10.18723/diw_wb:2024-48-1), Wochenbericht No 48/2024, pp. 759 65.**{#par-o42187}
**Cortés, P., J. Hwang, J. Pan and U. Schönberg (2026), [Gender Norms and the Labor Market](https://www.nber.org/papers/w34716), Working Papers, No 34716.**{#par-o1ae85}
**Cutler, D. M., J. M. Poterba, L. M. Sheiner and L. H. Summers (1990), [An Aging Society: Opportunity or Challenge?](https://www.brookings.edu/wp-content/uploads/1990/01/1990a_bpea_cutler_poterba_sheiner_summers_akerlof.pdf), Brookings Papers on Economic Activity Vol. 21(1), pp. 1-74.**{#par-ao3359}
**Deutsche Bundesbank (2026a), [German balance of payments in 2025](https://publikationen.bundesbank.de/content/991186), Monthly Report, March 2026.**{#par-ee975o}
**Deutsche Bundesbank (2026b),[Forecast for Germany: Energy price shock fuels inflation and slows the economic recovery](https://publikationen.bundesbank.de/content/999218), in: Forecast for Germany: Energy price shock fuels inflation and slows the economic recovery, supplementary information, Monthly Report, June 2026.**{#par-i12e71}
**Deutsche Bundesbank (2026c),**{#par-oo53i6}
**[Sectoral structural change and its impact on productivity growth in the euro area Monthly Report -- March 2026
25.03.2026](https://publikationen.bundesbank.de/publikationen-en/reports-studies/monthly-reports/sectoral-structural-change-and-its-impact-on-productivity-growth-in-the-euro-area-991176 "Sectoral structural change and its impact on productivity growth in the euro area")
, Monthly Report, March 2026.
Deutsche Bundesbank (2025a), [What's behind the sustained decline in German export market shares?](https://publikationen.bundesbank.de/content/960442), Monthly Report, July 2025.{#par-u8ioui}
Deutsche Bundesbank (2025b), [The German economy](https://publikationen.bundesbank.de/content/957532), Monthly Report, May 2025{#par-e8ee6u}
Deutsche Bundesbank (2025c), [German enterprises' profitability and financing in 2024](https://publikationen.bundesbank.de/content/972382), Monthly Report, December 2025.{#par-ia3i27}
Deutsche Bundesbank (2025d), [Global and European setting](https://publikationen.bundesbank.de/content/957526), Monthly Report, May 2025.{#par-i724a1}
Deutsche Bundesbank (2025e), [Early, standard, late: when insurees retire and how pension benefit reductions and increases could be determined](https://publikationen.bundesbank.de/content/958722), Monthly Report, June 2025.{#par-e9ai63}
Deutsche Bundesbank (2024a), [Developments in euro area business dynamism](https://publikationen.bundesbank.de/content/928128), Monthly Report, March 2024.{#par-iiaiu4}
Deutsche Bundesbank (2024b), [German enterprises' profitability and financing in 2023 during the period of monetary policy tightening](https://publikationen.bundesbank.de/content/947298), Monthly Report, December 2024. {#par-o1io71}
Deutsche Bundesbank (2024c), [An international comparison of the tax wedge on labour: the difference between pension contributions and taxes](https://publikationen.bundesbank.de/content/932710), Monthly Report, June 2024.{#par-u2a839}
Deutsche Bundesbank (2022), [Productivity effects of reallocation in the corporate sector during the COVID- 19 crisis](https://www.bundesbank.de/content/898258), Monthly Report, September 2022, p. 47-66.{#par-o95e22}
Deutsche Bundesbank (2019), [Long-term outlook for the statutory pension insurance scheme](https://www.bundesbank.de/content/811966), Monthly Report, October 2019.{#par-ooa126}
Deutsche Bundesbank (2018), [Economic conditions in Germany](https://www.bundesbank.de/content/744242), Monthly Report, May 2018, pp. 54-56.{#par-a77io4}
Deutsche Bundesbank (2017), [Demographic change, immigration and the potential output of the German economy](https://www.bundesbank.de/content/667884), Monthly Report, April 2017, pp. 35-47.{#par-i6512a}
Dohmen, T., A. Falk, B. H. H. Golsteyn, D. Huffman and U. Sunde (2017), [Risk Attitudes across the Life Course](https://doi.org/10.1111/ecoj.12322), The Economic Journal, Volume 127, Issue 605, October 2017, F95-F116,{#par-uo85o6}
Falck, E., O. Röhe and N. Stähler (2024), [Demographics and the Decline in Firm Entry: On The Role of Population Growth and Longevity](https://dx.doi.org/10.2139/ssrn.5019366), Working Paper available at 5019366.{#par-eoi4e6}
Federal Ministry of Labour and Social Affairs (2023), [Zur Reform der Transferentzugsraten und Verbesserung der Erwerbsanreize](https://www.bmas.de/DE/Service/Publikationen/Forschungsberichte/fb-629-erwerbstaetigenfreibetraege.html), Forschungsbericht 629.{#par-io5a77}
Federal Office of Administration (2026), [Wie hoch dürfen die jährlichen Einkünfte meiner Ehegattin/Lebenspartnerin / meines Ehegatten/Lebenspartners sein, damit sie/er als berücksichtigungsfähige Person einen Beihilfeanspruch hat?](https://www.bva.bund.de/SharedDocs/FAQs/DE/Bundesbedienstete/Gesundheit-Vorsorge/Beihilfe/060_einkommensgrenze.html) Beihilfe Online . {#par-oi94au}
Federal Statistical Office (2025), [Bei 10,3 % der Paare ist die Frau die Haupteinkommensperson](https://www.destatis.de/DE/Presse/Pressemitteilungen/Zahl-der-Woche/2025/PD25_10_p002.html), Zahl der Woche No 10, 4 March 2025.{#par-u75o85}
Fitzenberger, B., K. Sommerfeld and S. Steffes (2013), [Causal effects on employment after first birth---A dynamic treatment approach](https://doi.org/10.1016/j.labeco.2013.05.003). Labour Economics, Vol. 25, pp. 49-62.{#par-a9228i}
German Council of Economic Experts (2026), [Frühjahrsgutachten 2026](https://www.sachverstaendigenrat-wirtschaft.de/fileadmin/dateiablage/gutachten/fg2026/FG2026_Gesamtausgabe.pdf).{#par-uau111}
German Council of Economic Experts (2023), [Wachstumsschwäche überwinden -- In die Zukunft investieren](https://www.sachverstaendigenrat-wirtschaft.de/fileadmin/dateiablage/gutachten/jg202324/JG202324_Gesamtausgabe.pdf), Annual Report 2023/24.{#par-o7iu9i}
German Council of Economic Experts (2021), [Transformation gestalten: Bildung, Digitalisierung und Nachhaltigkeit](https://www.sachverstaendigenrat-wirtschaft.de/fileadmin/dateiablage/gutachten/jg202122/JG202122_Gesamtausgabe.pdf), Annual Report 2021/22.{#par-ii6738}
German Federal Pension Insurance (2024), [Trends in figures.](https://jahresbericht.deutsche-rentenversicherung.de/en/artikel/in-figures/) Annual Report 2024.{#par-e63a91}
Hammer, L. and M. S. Hertweck (2022), [EU enlargement and (temporary) migration: Effects on labour market outcomes in Germany](https://www.bundesbank.de/content/885576), Deutsche Bundesbank Discussion Paper No 02/2022.{#par-o74u6e}
Heitmueller, A. (2007), [The chicken or the egg?: Endogeneity in labour market participation of informal carers in England](https://doi.org/10.1016/j.jhealeco.2006.10.005), Journal of health economics, Vol. 26(3), pp. 536-559.{#par-uei3u3}
Hertweck, M. S. (2026a), Stock-flow matching in the German labour market, Deutsche Bundesbank Technical Paper (forthcoming).{#par-o96u7u}
Hertweck, M. S. (2026b), Financial Disincentives or Lack of Childcare: What Explains the Low Full-Time Employment Rate of Women in Germany? Bundesbank Technical Paper (forthcoming).{#par-oo4a42}
Joint Economic Forecast Project Group (2026), [Energiepreisschock überlagert Fiskalimpuls -- Wachstumskräfte versiegen, Gemeinschaftsdiagnose Frühjahr 2026](https://www.ifo.de/sites/default/files/secure/prognosen/gd-20211014/20260401-gd-f/20260401-GD-Fruehjahr-2026_Publikation.pdf){#par-aau49e}
Kerkhof, A., T. Licht, M. Menkhoff and K. Wohlrabe (2024), [Die Nutzung von Künstlicher Intelligenz in der deutschen Wirtschaft, ifo Schnelldienst, 2024](https://www.ifo.de/publikationen/2024/aufsatz-zeitschrift/ki-in-der-deutschen-wirtschaft), 77, No 08, pp. 39--43.{#par-e8euu9}
Knetsch, T. A., K. Sonderhof and W. Kempe (2014), [Das Erwerbspersonenpotenzial zu Vollzeitäquivalenten: Messkonzept, Projektion und Anwendungsbeispiele](https://elibrary.duncker-humblot.com/article/4503/das-erwerbspersonenpotenzial-zu-vollzeitaumlquivalenten-messkonzept-projektion-und-anwendungsbeispiele), Schmollers Jahrbuch -- Journal of Applied Social Science Studies, Vol. 134 (1), pp. 1-24.{#par-a1ao8e}
Maestas, N., K. J. Mullen and D. Powell (2023), [The Effect of Population Aging on Economic Growth, the Labor Force, and Productivity](http://www.doi.org/10.1257/mac.20190196), American Economic Journal: Macroeconomics, Vol. 15(2), pp. 306-332.{#par-u5u7a5}
Marotzke, P. (2019), [The rise of part-time work: A German-French comparison](https://www.bundesbank.de/content/798592), Deutsche Bundesbank Discussion Paper No 20/2019.{#par-e72u82}
Merki, M., F. Schuster-Johnson and S. Gottschalk (2026), [Wer Reformen will, muss Kitas bauen](https://dezernatzukunft.org/publikationen/wer-reformen-will-muss-kitas-bauen), Dezernat Zukunft, Policy Paper, 16 April 2026.{#par-u756u4}
(2025), [Macroeconomic productivity gains from Artificial Intelligence in economies](https://www.oecd.org/content/dam/oecd/en/publications/reports/2025/06/macroeconomic-productivity-gains-from-artificial-intelligence-in-g7-economies_dcf91c3e/a5319ab5-en.pdf), Artificial Intelligence Papers, No 41.{#par-u26i85}
Ouimet, P. and R. Zarutskie (2014), [Who Works for Startups?](http://dx.doi.org/10.1016/j.jfineco.2014.03.003)The relation between firm age, employee age, and growth, Journal of Financial Economics, Vol. 112(3), pp. 386-407.{#par-e3uiu5}
Paule-Paludkiewicz, H. (2024). [Does the right to work part-time affect mothers' labor market outcomes?](https://www.bundesbank.de/content/914956), Deutsche Bundesbank Discussion Paper No 12/2024.{#par-io87eu}
Pötzsch, O. and F. zur Nieden (2024), [Die Babyboomer: Auf dem Gipfel der demografischen Welle](https://www.destatis.de/DE/Methoden/WISTA-Wirtschaft-und-Statistik/2024/01/die-babyboomer-012024.pdf?__blob=publicationFile&v=1), Wirtschaft und Statistik, 1/2024, pp. 25-38.{#par-aoiu65}
Rengers, M. and T. Körner (2026), [Arbeitszeiten und Arbeitszeitwünsche von Männern (und Frauen) -- Anhaltspunkte zu Potenzialen für die Gleichstellung](https://www.destatis.de/DE/Methoden/WISTA-Wirtschaft-und-Statistik/2026/01/wista-012026.pdf?__blob=publicationFile&v=6), Wirtschaft und Statistik, 1/2026, pp. 68-86.{#par-i59u77}
The Economist (2026), [Is putting graduates out of work already?](https://www.economist.com/finance-and-economics/2026/05/13/is-ai-putting-graduates-out-of-work-already), The Economist. {#par-a43e1a}
The New York Times (2025), [For some recent graduates, the A.I. job apocalypse may already be here](https://www.nytimes.com/2025/05/30/technology/ai-jobs-college-graduates.html), (published in print 31 May 2025). {#par-oo17ii}
Weinberg, B. A. (2004), [Experience and Technology Adoption](https://www.iza.org/publications/dp/1051/experience-and-technology-adoption), Discussion Paper, No 1051.{#par-ee7e18}
Yotzov, I., J. M. Barrero, N. Bloom, P. Bunn, S. J. Davis, K. M. Foster, A. Jalca, B. H. Meyer, P. Mizen, M. A. Navarrete, P. Smietanka, G. Thwaites and B. Z. Wang (2026), [Firm data on](https://doi.org/10.3386/w34836), Working Paper 34836.{#par-o5ii37}
1. {#_ftn_root_1} The total birth rate was comparatively high at 1.5 to 1.6 children per woman between 2016 and 2021 but has recently fallen back to a figure of 1.35 children per woman as of 2024.
2. {#_ftn_root_2} The Federal Statistical Office defines the baby boomers as the cohorts born between 1957 and 1968. See Pötzsch and zur Nieden (2024).
3. {#_ftn_root_3} The potential labour force refers to the potential labour supply of an economy. In addition to the labour force (employed persons and unemployed persons), this also includes a hidden reserve that is available to the labour market but is not currently looking for work. By contrast, this does not include persons who are looking for work but are unavailable in the short term. See Knetsch et al. (2014).
4. {#_ftn_root_4} See Yotzov et al. (2026).
5. {#_ftn_root_5} Productivity growth has also weakened significantly over the past ten years and has been low since 2020, in particular. This was due, in part, to the pronounced hoarding of labour. Unwinding labour hoarding buoys productivity growth over the forecast horizon.
6. {#_ftn_root_6} See Cutler et al. (1990) and Acemoglu and Restrepo (2017).
7. {#_ftn_root_7} See Aksoy et al. (2019), Dohmen et al. (2017), Falck et al. (2024), Ouimet and Zarutskie (2014) and Weinberg (2004).
8. {#_ftn_root_8} See Deutsche Bundesbank (2017) and Bloom (2001).
9. {#_ftn_root_9} Differences in the age structure at a given point in time in the past can be used to estimate the causal impact of demographic ageing on growth. See Maestas et al. (2023).
10. {#_ftn_root_10} Data at the district level for the period from 2000 to 2021 are used as the basis for this exercise.
11. {#_ftn_root_11} For a detailed description of the estimation approach and the estimation results, see "[Technical annex: Methodology for estimating the effects of demographic ageing on growth using regional data](#Technical-annex-Methodology-for-estimating-the-effects-of-demographic-ageing-on-growth-using-regional-data)".
12. {#_ftn_root_12} Here, the estimates are likely to provide a lower bound for the macroeconomic impact of demographic ageing on growth and productivity (see "[Technical annex: Methodology for estimating the effects of demographic ageing on growth using regional data](#Technical-annex-Methodology-for-estimating-the-effects-of-demographic-ageing-on-growth-using-regional-data)").
13. {#_ftn_root_13} Free movement of workers came into force in early 2014 for people from Bulgaria and Romania, and in mid-2015 for people from Croatia.
14. {#_ftn_root_14} Since the Western Balkans arrangement entered into force in 2016, much of the immigration from the Western Balkans has been labour market-oriented as well.
15. {#_ftn_root_15} See Hammer and Hertweck (2022). All the same, any abuse of the freedom of movement of workers should be kept in check.
16. {#_ftn_root_16} The labour shortages induced by demographic change are particularly substantial in the case of skilled workers.
17. {#_ftn_root_17} Those figures have already been adjusted for seasonal workers. Furthermore, the labour market-oriented immigrants in the 2010s were around five years younger than the domestic labour force on average. The emigration figures are therefore largely unaffected by the number of people entering retirement. Moreover, the immigrants that generally stay in Germany are the ones who have been successfully integrated into the labour market; see Hammer and Hertweck (2022).
18. {#_ftn_root_18} According to data, the labour force participation rate of men aged 20 to 64 in Germany was 88 % in 2025, which was more than 2 percentage points above the EU27 average. Around 12 % of working men had part-time jobs (compared with the EU27 average of around 8 %).
19. {#_ftn_root_19} Employment rate of women aged 20 to 64 according to the labour force survey (). Compared with the national accounts, however, this underreports marginal employment in Germany, in particular. This is likely to understate the labour force participation rate in the labour force survey and overstate working hours.
20. {#_ftn_root_20} According to an assessment by the Socio-Economic Panel (), just under 18 % of women working part-time want to increase their weekly hours of work considerably by 8 hours or more on average for 2009 to 2020, conditional on an earnings adjustment. A further 20 % want to increase their weekly hours of work by up to 8 hours. See Hertweck (2026b). Microcensus surveys based on different survey methods and questions currently identify lower, but considerable, shares of women working part-time who want to increase their hours of work by more than 10 hours per week on average; see Rengers and Körner (2026).
21. {#_ftn_root_21} Prevailing role models, too, can depress the labour supply of mothers and wives. See Boelmann et al. (2025) and Cortés et al. (2026).
22. {#_ftn_root_22} See Federal Ministry of Labour and Social Affairs (2023).
23. {#_ftn_root_23} See Merki et al. (2026). Estimates indicate that additional childcare spaces raise labour supply of mothers; see Müller and Wohlrich (2020). According to a study, the statutory entitlement to work part-time did not, over the medium term, lead to more part-time working among mothers, though it did increase their labour force participation. See Paule-Paludkiewicz (2024).
24. {#_ftn_root_24} See Bick and Fuchs-Schündeln (2018) or Bick et al. (2019) and Paule-Paludkiewicz (2019).
25. {#_ftn_root_25} See Federal Statistical Office (2025).
26. {#_ftn_root_26} See Blömer et al. (2021) and Federal Office of Administration (2026).
27. {#_ftn_root_27} Expanding on German Council of Economic Experts (2023), Chart 105, and based on -econ surveys.
28. {#_ftn_root_28} See Hertweck (2026b), based on responses by women aged 25 to 54. That is the age group in which the trade-off between work and family commitments is particularly pressing. The findings should be interpreted as descriptive findings. They do not permit any direct causal conclusions to be drawn because the composition of the different demographic groups might be endogenous. In particular, it is plausible that the decision to get married itself was selective. For example, couples exhibiting certain income constellations may be more likely to marry because they benefit from existing tax and social welfare laws. All the same, the findings are indicative of possible relationships and determining factors.
29. {#_ftn_root_29} The findings are consistent with earlier analyses on the determinants of part-time work in Germany and France; see Deutsche Bundesbank (2018) and Marotzke (2019).
30. {#_ftn_root_30} See Fitzenberger et al. (2013). The high level of persistence might be explained by two factors: First, older children, too, have childcare needs that make it more difficult to work full-time. Second, a longer phase of reduced employment due to childcare commitments can leave people permanently detached from the labour market. People who have performed childcare duties in the past could therefore be more likely to take on further care duties; see Heitmueller (2007).
31. {#_ftn_root_31} The advantage of analysing full-time employment rates by educational background rather than by income is that educational background is not influenced by current employment. Thus, full-time employment (compared with part-time employment) directly increases income, but has no effect on educational background.
32. {#_ftn_root_32} Labour force participation rate according to the labour force survey. Compared with the national accounts, however, this underreports marginal employment in Germany, in particular. This is likely to understate the labour force participation rate in the labour force survey and overstate working hours.
33. {#_ftn_root_33} See German Federal Pension Insurance (2024) and [Early, standard, late: when insurees retire and how pension benefit reductions and increases could be determined](https://publikationen.bundesbank.de/content/958722).
34. {#_ftn_root_34} See Buslei et al. (2024).
35. {#_ftn_root_35} See [Early, standard, late: when insurees retire and how pension benefit reductions and increases could be determined](https://publikationen.bundesbank.de/content/958722).
36. {#_ftn_root_36} See Deutsche Bundesbank (2019) and German Council of Economic Experts (2026).
37. {#_ftn_root_37} Rising contribution rates are also likely to dampen labour input, especially if they do not provide contribution-equivalent benefits. See also Deutsche Bundesbank (2024c).
38. {#_ftn_root_38} See German Council of Economic Experts (2026).
39. {#_ftn_root_39} In contrast to numbers of individuals, this allows the development of hours worked to also be taken into account. For the methodology, see Knetsch et al. (2014). It also takes into account different labour market integration speeds following labour market-oriented and refugee migration.
40. {#_ftn_root_40} The assumptions for births, deaths and immigration correspond to the average assumptions in the 16th coordinated population projection by the Federal Statistical Office and the statistical offices of the federal states. The baseline scenario corresponds to variant G2L2W2, updated to include data for 2025 that have since been published.
41. {#_ftn_root_41} This could occur if the outflows of refugees in recent years is stepped up.
42. {#_ftn_root_42} This assumes that, after 2031, the retirement age will go up such that the average ratio of years in retirement to years of contributions remains at around the level reached in 2031 -- just over 40 %; see Deutsche Bundesbank (2019). The assumed increase in life expectancy corresponds to the mean variant in the 16th coordinated population projection (L2). According to these scenarios, linking the retirement age to life expectancy would have a slow effect, but one that would cumulate over time even after 2035 to create further labour supply effects. By contrast, abolishing the option to retire on a full pension after 45 years of insurance contributions would have a significant one-off effect; this, however, is not taken into account in this simulation.
43. {#_ftn_root_43} For groups that already have higher labour force participation rates in Germany, the scenarios in the baseline projection remain unchanged. In projections shown here, age and gender-specific labour force participation rates from the microcensus are extrapolated to the employment level from the national accounts. Owing to underreporting in the Labour Force Survey, the additional increase in labour force participation rates in the "Sweden scenario" is limited. Compared with the baseline scenario, the labour force participation rate of men increases by 0.4 percentage point and that of women increases by 1.1 percentage points.
44. {#_ftn_root_44} Compared with the baseline, the share of female employees in full-time employment is assumed to rise by just over 9 percentage points. In addition, the weekly hours worked of women working part-time are assumed to increase by around 1.8 hours. This would approximately halve the gap between their number of hours worked and the average. Higher hours worked are also assumed for men and the self-employed, but the effects are smaller. Overall, average hours worked per worker increase by 0.8 hours per week. In the baseline scenario, however, this falls by 0.5 hours per week, mainly due to the negative age structure effect of around 0.3 hours per week.
45. {#_ftn_root_45} By contrast, potential effects of a change in labour input on total factor productivity are not taken into account. The Bundesbank's estimate of potential output is based on a production function approach. The theoretical model framework that underpins the medium-term projections is based on the assumption that labour input and capital input are complementary. See Deutsche Bundesbank (2017).
46. {#_ftn_root_46} In their Joint Economic Forecast, the economic research institutes assume that net migration will decline to 150,000 persons per year by 2030; see Joint Economic Forecast Project Group (2026), p. 56.
47. {#_ftn_root_47} See German Council of Economic Experts (2023), No 346 ff.
48. {#_ftn_root_48} See German Council of Economic Experts (2021), No 317 ff and German Council of Economic Experts (2023), No 336 ff. In general, reforms to splitting income taxation between married couples must respect the special protection of marriage and family provided for by the Basic Law.
49. {#_ftn_root_49} See Federal Ministry of Labour and Social Affairs (2023).
50. {#_ftn_root_50} See, inter alia, Deutsche Bundesbank (2019, 2025e).
51. {#_ftn_root_51} See Maestas et al. (2023).
52. {#_ftn_root_52} For the analysis, it is necessary to adjust the raw data for the population at district level. First, the statistical break in the population data caused by the kink in the data from the 2011 census (strong downward revision of population data in the wake of new surveys) was adjusted and the population figures prior to 2011 were revised. The kink in the data from the 2022 census also led to population data being corrected between 2011 and 2021. Second, population data for districts, unlike data, are not retroactively adjusted for territorial reforms. As the definitions of the districts in the population data have not always been defined consistently over time, adjustments were also made here.
53. {#_ftn_root_53} See Maestas et al. (2023).
54. {#_ftn_root_54} To avoid the problem of autocorrelation, non-overlapping growth rates are included in the estimation.
55. {#_ftn_root_55} These include district dummies, year dummies, federal state dummies interacted with year dummies, and sectoral employment shares in the starting year *t* (log share of employed persons for various sectors). The sectoral employment shares are also interacted with year dummies to allow the impact of the initial economic structure to vary by year.
56. {#_ftn_root_56} It could be the case that some structurally strong regions are both productive and have a relatively young population. Other regions could have an older population but nevertheless have stabilised economic output as a result of transfers or commuting. This would mean that no clear link between demographic ageing and growth or productivity would be apparent between the regions. Within a region, however, it may become apparent over time that increasing ageing reduces growth. In this case, the inclusion of district dummies would help to measure the effect of ageing on productivity more accurately.
57. {#_ftn_root_57} The *z* -year survival probability *SP(z)* is calculated here as the product of the annual survival probabilities for each cohort based on the published survival probabilities for the starting year *t*. This approach can be illustrated using the example of a rate of change over five years between 2000 and 2005. In order to predict the number of persons aged 60 in 2005, the observed number of persons aged 55 in 2000 is multiplied by the five-year survival probability for persons aged 55.
58. {#_ftn_root_58} This is reflected in the high F-value and the high correlation between the instrument and the actual change in population structure (Panel B in Table 2.1).
59. {#_ftn_root_59} See Panel C and Panel D in Table 2.1.
60. {#_ftn_root_60} The estimator is smaller in magnitude than the IV estimator and is close to zero. One possible reason for this could be that stronger local growth tends to lead to an older age profile of the population. Migration effects could play a role in this. For example, young adults in Germany might base their migration decisions not on a district's economic growth, but on its income levels. In processes of convergence, regions with lower incomes tend to grow faster than districts with higher incomes. This means that younger migrants seeking higher income levels tend to move to slower-growing districts that already have relatively high levels. Further estimates show that in Germany, districts with initially relatively high per capita grow more slowly than districts with relatively low per capita. Mortality effects could also distort the estimator towards zero. For example, life expectancy could increase more sharply in faster growing regions. This is the case when higher growth creates more scope for investment in health or contributes to a healthier lifestyle. Alternatively, a measurement error in the population data could distort the coefficient towards zero (attenuation bias). In the granular district data, the observed changes in the age structure could contain a lot of noise. The instruments used here could remedy this measurement error by extrapolating the age structure in a more deterministic manner.
61. {#_ftn_root_61} For the decomposition analysis, these three components (hourly productivity, average hours worked and the ratio of employed persons to the population) are included as dependent variables in separate estimates. For example, the marginal ageing effect on per capita is mechanically decomposed into the three transmission channels.
62. {#_ftn_root_62} This could be related to the increased labour market integration of women, who are more likely to work part-time. Thus, between 2000 and 2021, relatively young people with below-average hours worked are likely to have entered the labour market.
63. {#_ftn_root_63} The results are similar when looking at annual growth rates.
64. {#_ftn_root_64} The ratio of employed persons per inhabitant is the product of the labour force participation rate (labour force relative to the population) and the employment rate (employed persons relative to the labour force). Estimates show that the effect of demographic ageing on the unemployment rate is not statistically significant.
65. {#_ftn_root_65} The share of older people rose from 22.9 % in 2000 to 25.9 % in 2021.
66. {#_ftn_root_66} Aggregated general equilibrium effects are captured only to the extent that they interact differently with the economic conditions of the districts caused by ageing.**
*[Q1]: first quarter
*[SIEPR]: Stanford Institute for Economic Policy Research
*[WISTA]: Wirtschaft und Statistik
*[NBER]: National Bureau of Economic Research
*[G7]: Group of Seven
*[GDP]: gross domestic product
*[OECD]: Organisation for Economic Co-operation and Development
*[**SOEP**]: socio-economic panel
*[OLS]: ordinary least squares
*[LFS]: labour force survey
*[US]: United States
*[SOEP]: socio-economic panel
*[BOP]: Bundesbank Online Panel
*[ECB]: European Central Bank
*[Eurostat]: European Union
*[AI]: artificial intelligence
*[**GDP**]: gross domestic product
*[**EU**]: European Union
*[EU]: European Union
*[NACE]: Nomenclature générale des activités économiques dans les Communautés européennes
*[IZA]: Institute of Labor and Economics
*[**AI**]: artificial intelligence
*[DIW]: Deutsches Institut für Wirtschaftsforschung
*[ifo]: Institut für Wirtschaftsforschung
*[FAQ]: frequently asked questions
*[SSRN]: Social Science Research Network
*[FTEs]: full-time equivalents