# 5 Metrics
* [*5.1 Own non-monetary policy portfolios/investments*](#tar-1 "5.1 Own non-monetary policy portfolios/investments")
* *[*5.1.1 Investments in financial institutions (euro portfolio and reserve assets)*](#tar-2 " 5.1.1 Investments in financial institutions (euro portfolio and reserve assets)")
* *[*5.1.1.1 GHG metrics*](#tar-3 "5.1.1.1 GHG metrics")*
* **[*5.1.1.2 Green and brown shares of business activities*](#tar-4 "5.1.1.2 Green and brown shares of business activities")**
* ***[*5.1.1.3 Physical risks of covered bonds (euro portfolio)*](#tar-5 "5.1.1.3 Physical risks of covered bonds (euro portfolio)")***
* ***[*5.1.1.4 Other sustainability matters*](#tar-6 "5.1.1.4 Other sustainability matters")****
* ***[*5.1.2 Investments in sovereigns (reserve assets)*](#tar-7 " 5.1.2 Investments in sovereigns (reserve assets)")
* *[*5.1.2.1 GHG metrics*](#tar-8 "5.1.2.1 GHG metrics")*
* **[*5.1.2.2 Production volumes of fossil fuels*](#tar-9 "5.1.2.2 Production volumes of fossil fuels")**
* ***[*5.1.2.3 Nature-related aspects*](#tar-10 "5.1.2.3 Nature-related aspects")***
* ***[*5.1.2.4 Other sustainability matters*](#tar-11 "5.1.2.4 Other sustainability matters")******
* ***[*5.1.3 Gold holdings*](#tar-12 "5.1.3 Gold holdings")***
* ***[*5.2 Monetary policy financial assets*](#tar-13 "5.2 Monetary policy financial assets")***
***In today's financial world, giving consideration to climate and sustainability-related information is increasingly becoming a strategic necessity and often a prudential requirement (see Section 1.1). Like all the other Eurosystem central banks, the Bundesbank discloses relevant metrics to help improve transparency about climate-related risks and impacts in the financial sector. This type of reporting also allows the Bundesbank to continuously analyse relevant aspects of its financial investments. This helps it identify and manage risks at an early stage.***{#par-a2u454}
***Figure 9 provides an overview of the portfolios, asset classes and metrics covered in this section. Reporting focuses on metrics such as weighted average carbon intensity (), **total carbon emissions** and the **carbon footprint** . Since 2023, the calculation methods have been based on a disclosure framework that the Eurosystem central banks have jointly agreed to apply. Revised and updated annually, this framework is aligned with the recommendations of the Task Force on Climate-related Financial Disclosures () and the Partnership for Carbon Accounting Financials (). The calculation methods are explained in detail in the [Annex](https://publikationen.bundesbank.de/content/998694).***{#par-ae3ea1}
{#par-e3i3ie}
**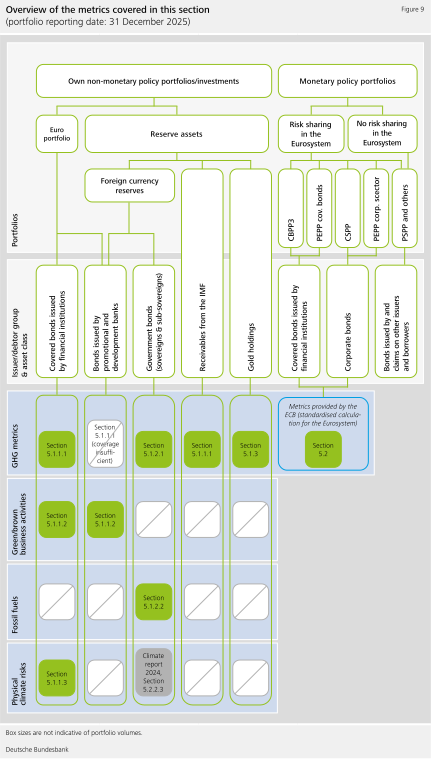**
**Since the previous reporting date, the euro portfolio has been expanded to include bonds issued by promotional and development banks (and by other institutions with a public mandate). Covered bonds were already included in the euro portfolio beforehand. This report examines the physical climate-related risks of these assets for the first time. Metrics on the Bundesbank's receivables from the are another new component of this year's report. These cover the emissions for the 's physical operations.**{#par-e6ueo5}
**5.1 Own non-monetary policy portfolios/investments** {#tar-1}
---------------------------------------------------------------
### **5.1.1 Investments in financial institutions (euro portfolio and reserve assets)** {#tar-2}
**As at the reporting date of 31 December 2025, the **euro portfolio** was fully invested in bonds issued by banks. The **reserve assets** were partly invested in the same. The euro portfolio mostly consists of covered bonds: bank debt securities mainly backed by real estate mortgages. Bonds issued by promotional and development banks or by other institutions with a public mandate[\[1\]](#_ftn_root_1) were added to the euro portfolio as a new asset class in the 2025 reporting year. Such bonds had already been part of the reserve assets.**{#par-u2i3ea}
**The following [Annex](https://publikationen.bundesbank.de/content/998694) are based on securities issuers' data. Therefore, the metrics are calculated on the basis of the climate and sustainability performance of the financial institutions that issued the securities held in the Bundesbank's portfolios. Under the new European Sustainability Reporting Standards (),[\[2\]](#_ftn_root_2) European commercial banks, which account for the bulk of covered bond issuers in the euro portfolio, have significantly expanded their scope 3 disclosures. Thanks to the improved data situation, the Bundesbank is now able to report on scope 3 metrics for its covered bond holdings for the first time.[\[3\]](#_ftn_root_3)**{#par-i16u1o}
#### **5.1.1.1 metrics** {#tar-3}
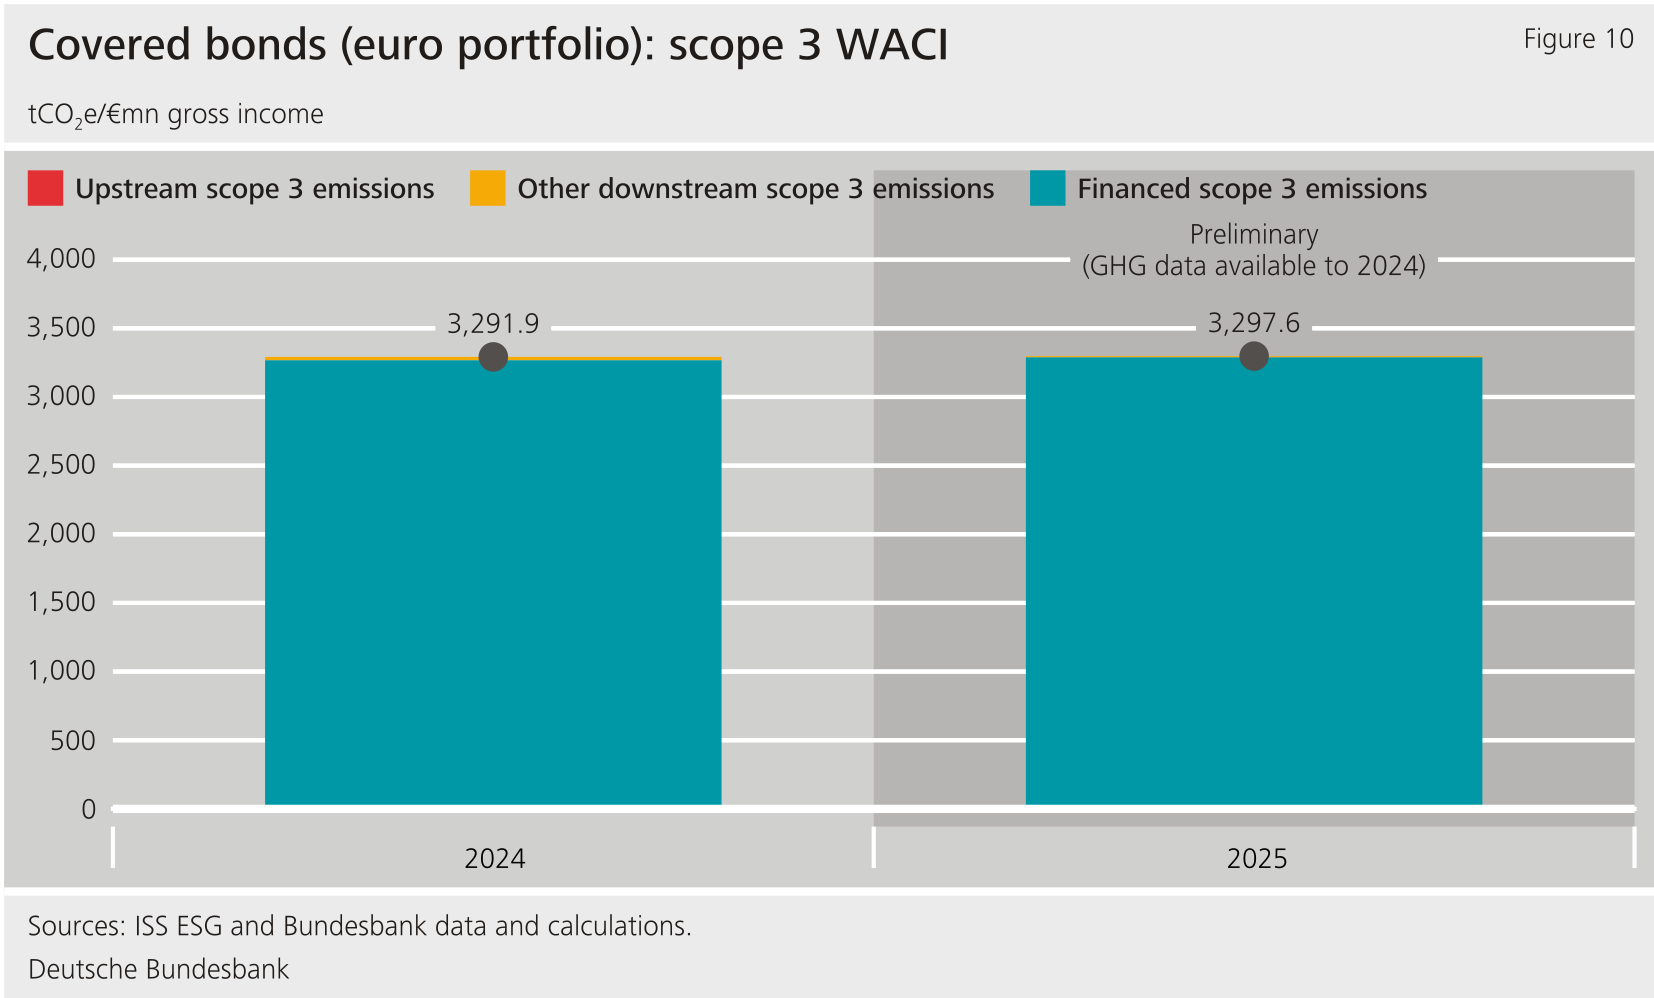
**The main emissions from investments in banks are the emissions financed by those banks, which form part of the scope 3 emissions. That is also the case for the **covered bond holdings** in the **euro portfolio** . As at 31 December 2025, the **scope 3** was **3,297.6 tonnes** and the **scope 1 and 2** was **1.2 tonnes of CO~2~e/€mn of gross income** (see Table 1). These results are provisionally based on the most recent data for 2024. Those data were also used to retroactively update the scope 1 and 2 metrics as at the 31 December 2024 reporting date.**{#par-e35461}
| Table 1: metrics for the covered bond holdings in the euro portfolio ||||||||
| **Portfolio as at:** ||||||||
| ||| **31.12.2021** | **31.12.2022** | **31.12.2023** | **31.12.2024** | **31.12.2025** |
|---|---|------------------|----------------------|----------------------|---------------------|--------------------------|--------------------------|
| **Portfolio holdings** (by nominal value) ||| **€10.0bn** | **€8.9bn** | **€7.3bn** | **€5.2bn** | **€5.4bn** |
| (tCO~2~e/€mn of gross income) || **Scope 1 \& 2** | **1.49** *(86.4 %)* | **0.89** *(92.3 %)* | **0.45** *(94.1 %)* | **1.17** *(83.8 %)* | **1.20** *(80.6 %)* |
| (tCO~2~e/€mn of gross income) || **Scope 3** | - | - | *-* | **3,291.9** *(91.2 %)* | **3,297.6** *(86.7 %)* |
| **Total carbon emissions** (tCO~2~e) || **Scope 1 \& 2** | **1,445** *(80.0 %)* | **1,037** *(87.0 %)* | **646** *(80.2 %)* | **984** *(78.3 %)* | **672** *(80.6 %)* |
| **Total carbon emissions** (tCO~2~e) || **Scope 3** | - | - | - | **3,336,976** *(91.2 %)* | **2,691,548** *(86.7 %)* |
| **Carbon footprint** (tCO~2~e/€mn of investment) || **Scope 1 \& 2** | **0.18** *(80.0 %)* | **0.13** *(87.0 %)* | **0.11** *(80.2 %)* | **0.24** *(78.3 %)* | **0.16** *(80.6 %)* |
| **Carbon footprint** (tCO~2~e/€mn of investment) || **Scope 3** | - | - | - | **741.9** *(91.2 %)* | **632.5** *(86.7 %)* |
{#par-o21119}
**Figure 10 shows that the scope 3 emissions are almost entirely bank-financed emissions. These relate, for example, to the corporate or real estate loans granted by banks and thus to the emissions of those particular firms and properties.[\[4\]](#_ftn_root_4) Banks' further downstream scope 3 emissions are usually comparatively small, as are their scope 1, scope 2 and upstream scope 3 emissions.**{#par-ea2e8i}
{#par-i9e2oa}
****
**The small increase in scope 1 and 2 metrics between 2023 and 2024 is also related to requirements for sustainability disclosures. This led some banks to adopt different accounting standards. As a result, they have been reporting higher emissions since 2024 than they had in previous years. This explains why there have been some structural breaks in the available data between 2023 and 2024.**{#par-auui92}
**Compared with European commercial banks, non-European promotional and development banks, in particular, disclose their operational and financed emissions only in isolated cases. This is why it has not yet been possible to calculate metrics that cover a sizeable percentage of the bonds issued by promotional and development banks for either the **euro portfolio** or the **reserve assets**. For that reason, this report does not include metrics for those holdings.**{#par-u98u35}
**The reserve assets also include the **Bundesbank's receivables** **from the** . These exist because of the Federal Republic of Germany's membership of the and the associated provision of currencies, special drawing rights and gold based on a Federal act.[\[5\]](#_ftn_root_5) The can choose to access the resources provided by all its member countries when providing financial assistance to member countries under economic policy adjustment programmes. It finances its own activities out of charges and interest receipts as well as income from its own financial assets. The amount of the Bundesbank's receivables from the is not therefore subject to the Bundesbank's investment decisions.**{#par-i3i32i}
**Like some of the financial institutions examined above, the partially discloses its emissions. Based on those disclosures, it is possible to calculate the 's intensity and, from that, assign a hypothetical to the receivables from the (see Table 2). The data cover the scope 3 emissions for the 's physical operations, but not the ones it finances. The latter probably depend significantly on the emissions of the 's member countries and thus on international progress towards decarbonisation.**{#par-eue65o}
| Table 2: of receivables from the based on emissions from the 's physical operations |||
| || **31.12.2025** |
|-------------------------------------|-------------------------------------------------|----------------|
| (tCO~2~e/€mn of operational income) | **Scope 1 \& 2** | **1.08** |
| (tCO~2~e/€mn of operational income) | **Scope 3** **(from physical operations only)** | **3.92** |
{#par-e9349i}
#### **5.1.1.2 Green and brown shares of business activities** {#tar-4}
**How much of a portfolio is **"green" or "brown"** depends on what percentage of the revenues generated by the firms financed by that portfolio come from green or brown business activities. This is based on a classification system created by the data provider , which classes business activities as **beneficial ("green")** or **harmful ("brown")** to the environment in alignment with the Sustainable Development Goals ().[\[6\]](#_ftn_root_6) If the firms in question are banks, shares of business volume (including lending and investment) are counted, rather than shares of revenues. Based on these shares, a weighted average is calculated for the portfolio along similar lines to the methodology.[\[7\]](#_ftn_root_7)**{#par-ea1ei7}
**The **covered bond holdings in the euro portfolio** had a **green share** of 1.4 % as at the end-2025 reporting date (see Figure 11). That share largely concerns bank loans that are used to finance renewable energies, energy efficiency measures and real estate certified as sustainable and/or energy-efficient. Year on year, the green share has declined by 0.4 percentage point. This is mainly because the metrics calculation now assigns some of the covered bonds to a different issuer, after one bank with a particularly high green share was acquired by a bank whose green share was lower. The **brown share**, meanwhile, is largely unchanged on the year, at 0.5 %. This category mainly includes loans for the purchase of internal combustion engine vehicles, one bank's involvement in financing an airport, and loans that a small number of northern European banks granted to the shipping industry.**{#par-a498e2}
{#par-u1eoou}
**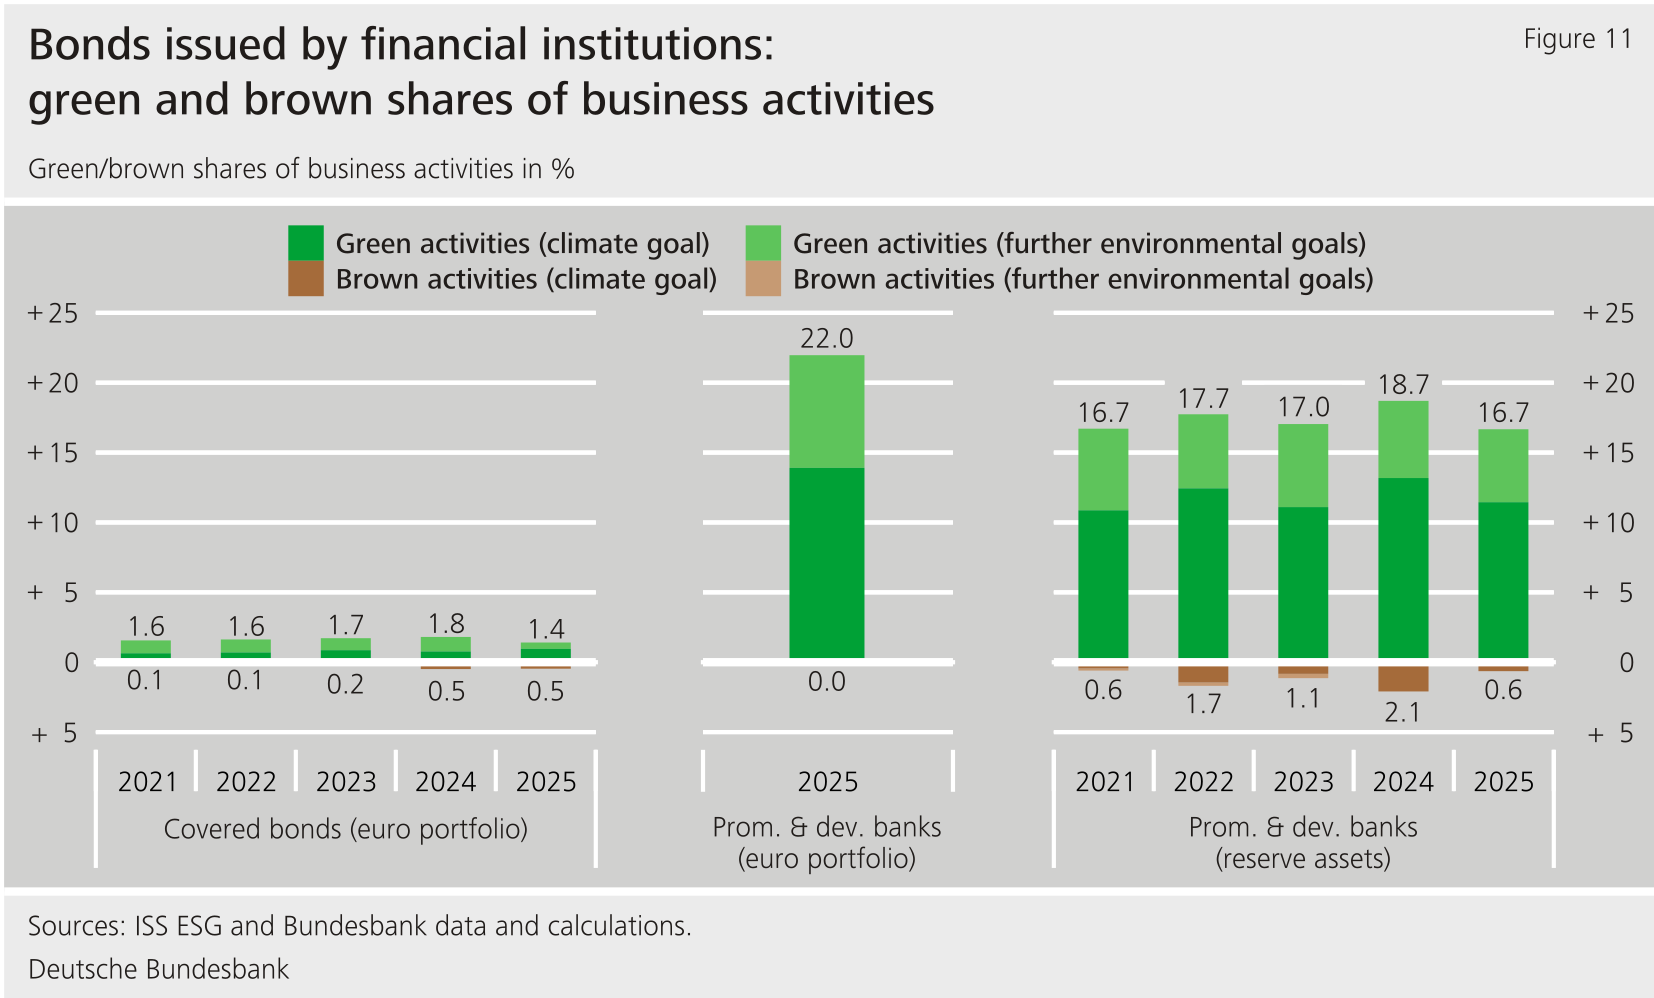**
**Euro-denominated **bonds issued by promotional and development banks** were first incorporated into the **euro portfolio** in 2025, thus improving the portfolio's sustainability performance. The green share of these banks' business activities is at a high level, at 22.0 %. It even exceeds the already high green share of foreign currency-denominated bonds issued by promotional and development banks in the **reserve assets** . That **green share** is down somewhat on the year. This is mainly because the reserve assets were expanded to include bonds issued by promotional banks that have less of an environmental focus than the promotional and development bank-issued bonds already contained in the portfolio.**{#par-u12388}
**In both portfolios, the green shares that count towards the ' climate goals come from loans granted by the promotional and development banks to finance, amongst other things, renewable energies, energy efficiency measures and public transport infrastructure. Green shares that primarily count towards further environmental goals are mainly due to the financing of water treatment facilities. In addition, smaller shares of financing activities are assigned primarily to nature and biodiversity-related environmental goals, such as projects to protect land and water-based ecosystems.**{#par-a45617}
**In the reserve assets, the **brown share** fell from 2.1 % to 0.6 %. In part, this was because promotional and development banks reduced the volume of financing for the fossil energy sector. As regards the promotional and development banks in the euro portfolio, no brown business activities were observed to any discernible extent.**{#par-e513ao}
#### **5.1.1.3 Physical risks of covered bonds (euro portfolio)** {#tar-5}
**By virtue of its covered bond holdings, the Bundesbank holds claims for repayment. These claims are exercised primarily against the banks that issued the covered bonds and, secondly, against the cover pools that serve as collateral for the covered bonds. The cover pools mainly comprise residential real estate mortgages. The probability of borrowers defaulting on those mortgages depends, in part, on physical climate-related risks at the locations of the real estate.**{#par-oi3666}
**Address data for those properties were not available for the following assessment. However, European covered bond issuers, in particular, use Harmonised Transparency Templates () provided by the European Covered Bond Council to voluntarily disclose regional breakdowns of cover pools by country and by region. These allow for an approximate geographical assessment of the physical risks of the cover pools. As at 31 December 2025, the relevant data are available for around 79 % (by nominal volume) of the **covered bond holdings in the euro portfolio**.**{#par-e362o2}
**As part of this assessment, data on the distribution by region were linked to sub-sovereign data from Moody's on physical climate-related risks. The data by Moody's show, by region, what shares of the population are living in locations that are highly exposed to physical risks. The assessment conducted assumes, as an approximation, that these residential locations are representative of the addresses of the real estate mortgages contained in the cover pools. This exercise thus gives an indication of whether the cover pools are focused on regions where an especially large number of properties are exposed to physical risks such as a rise in the sea level, floods or wildfires.[\[8\]](#_ftn_root_8)**{#par-i574eo}
**As at 31 December 2025, the covered bonds in the euro portfolio originated from the following jurisdictions: Australia,[\[9\]](#_ftn_root_9) Belgium, Finland, France, Germany, the Netherlands, Norway and Sweden (see Figure 12). The bulk of the securities are Pfandbriefe issued in Germany. The cover pools of these instruments are mainly real estate mortgages in Germany. Viewed as a whole, the cover pools of the covered bond holdings are concentrated on richly populated regions such as North Rhine-Westphalia, Bavaria, the Paris region (Île-de-France) and the Helsinki region.**{#par-eiiie7}
{#par-a4eui4}
**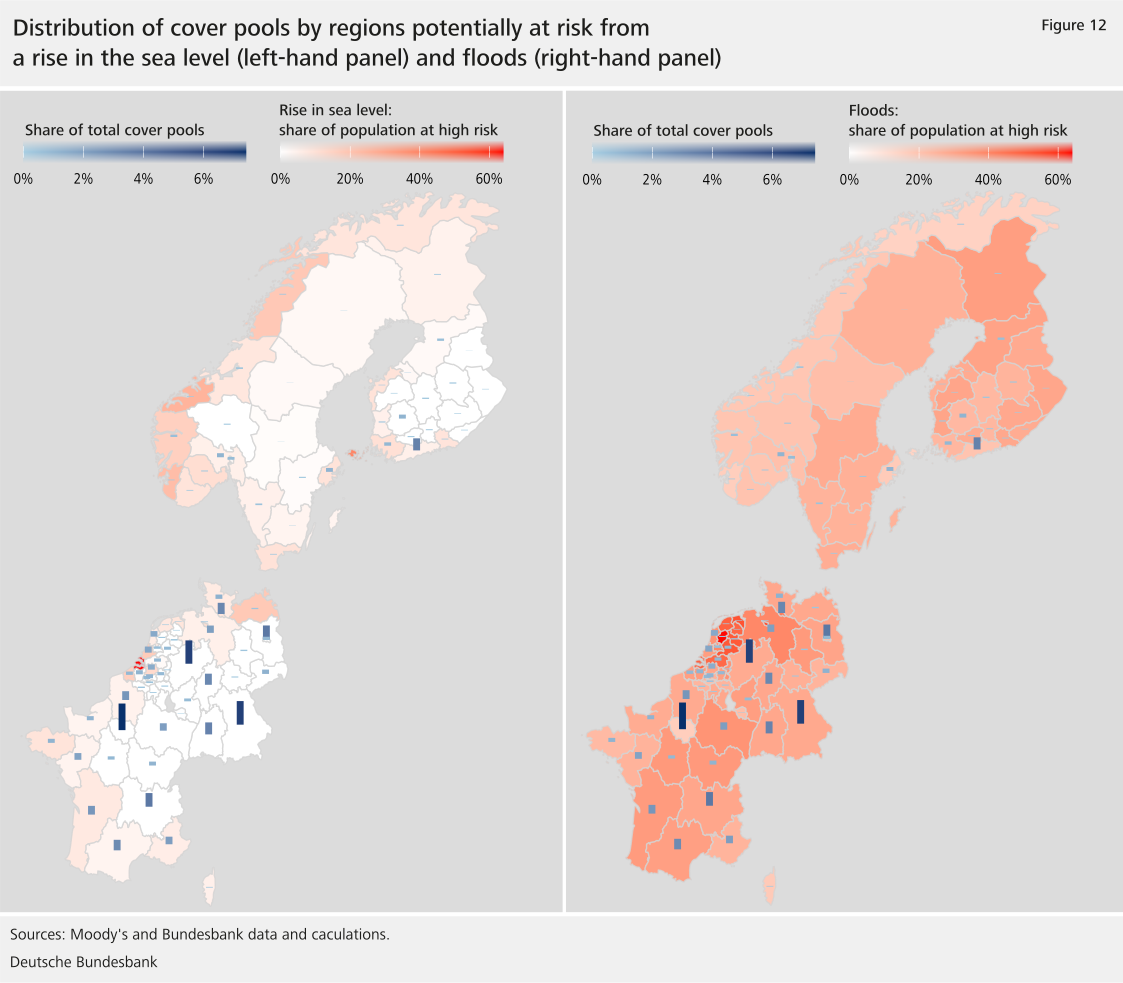**
**The assessment indicates that regions particularly at risk from a **rise in the sea level** make up only a fairly small share of the cover pools, when compared with inland regions (see Figure 12, left-hand panel). By contrast, **flood risks** are moderately to widely prevalent across all the regions relevant to the cover pools (see Figure 12, right-hand side). These affect particularly large shares of the population in water-adjacent regions such as Flevoland (Netherlands), Bremen and Hamburg. Moody's sees a high risk of **forest and wildfires** in the overseas territories of France[\[10\]](#_ftn_root_10) and in parts of southern France. Overall, these risks are far less prevalent in the relevant regions for the cover pools than in some parts of southern Europe, for example. Concerning risks arising from **hurricanes**, Moody's reports that, among the cover pool regions, only French overseas territories are high risk areas. These make up a small share of the cover pool.**{#par-o887a6}
#### **5.1.1.4 Other sustainability matters** {#tar-6}
**The euro portfolio and the reserve assets contain fairly low to moderate shares of green bonds and comparable types of debt instruments, though the sustainable investment policies for those portfolios do not include any targeted purchases. The following shares of asset volumes are shown as intervals (Table 3). These account for whether green bonds or comparable types of debt instruments labelled as such by their issuers (end of interval) have also been verified in a second-party opinion as being compliant with standards (start of interval).[\[11\]](#_ftn_root_11)**{#par-u67ii7}
| Table 3: Shares of green, social, sustainability and sustainability-linked bonds in the holdings of bonds issued by financial institutions (by nominal value) |||||
| | **Green** | **Social** | **Sustainability** | **Sustainability-linked** |
|------------------------------------------------------------------------|-----------------|-----------------|--------------------|---------------------------|
| **Covered bonds (euro portfolio)** | **6.7 %-7.0 %** | **0.0 %** | **0.0 %** | **0.0 %** |
| **Bonds issued by promotional and development banks (euro portfolio)** | **0.0 %** | **0.0 %** | **0.0 %-5.0 %** | **0.0 %** |
| **Bonds issued by promotional and development banks (reserve assets)** | **3.0 %-3.3 %** | **0.0 %-3.0 %** | **1.5 %-22.8 %** | **0.0 %** |
{#par-ei3876}
### **5.1.2 Investments in sovereigns (reserve assets)** {#tar-7}
**The **investments in sovereigns** included in the **reserve assets** are based on the sovereigns of the reserve currencies held by the Bundesbank. They mainly consist of bonds issued by central governments, mostly the United States. In addition, they include deposits with the central banks of those sovereigns[\[12\]](#_ftn_root_12) and bonds of sub-sovereigns (regions of a country, such as federal states).**{#par-uaiiee}
#### **5.1.2.1 metrics** {#tar-8}
**data for sovereigns have particularly long [Annex](https://publikationen.bundesbank.de/content/998694). Concerning **investments in sovereigns** , the most recent available data when this report was prepared extend to 2024. The preliminary metrics for 2025 are therefore based on data from previous years. metrics are calculated both with and without the land use, land-use change, and forestry sector ([Annex](https://publikationen.bundesbank.de/content/998694)). As at 31 December 2025, the ( intensity) of investments in sovereigns was in steady decline, standing at 212 tonnes of CO~2~e/€mn of -adjusted (see Figure 13).**{#par-u87a6i}
{#par-a15641}
**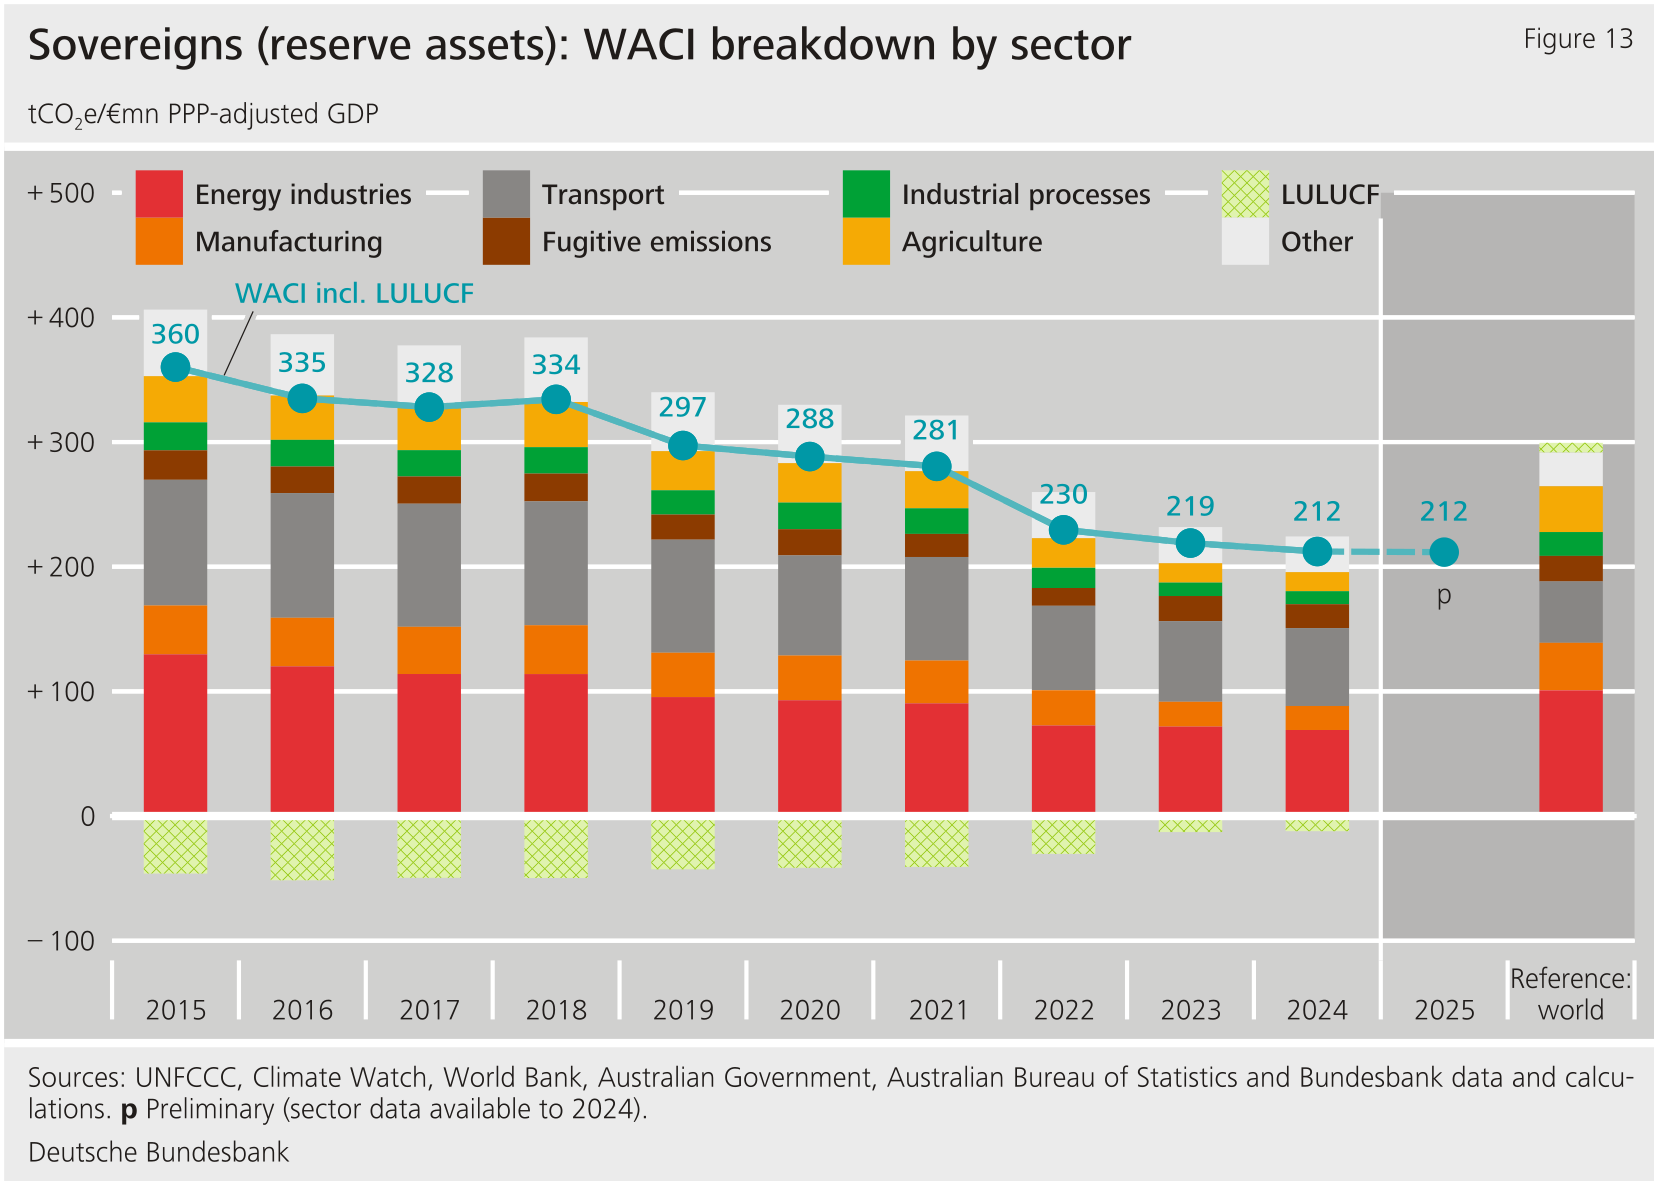**
**The calculations here are based on the net sovereign emissions, taking into account . In the sovereigns whose bonds are held as reserve assets, usually capture or prevent larger volumes of than they emit, while the opposite is the case globally.**{#par-ei7uu8}
**Other reasons for the lower of the assets held compared with the global intensity (based on data for 2023) are emissions from the energy sector, which mainly arise from the generation of electricity and heat, and agriculture. Relative to the size of the sovereigns' economies, these are smaller than the global average. By contrast, relative emissions from the transport sector are higher than the global average.**{#par-e4e133}
**Viewed over time, the of the sovereign bond holdings has been in almost steady decline since 2015, the year of the Paris Climate Agreement. Reductions have been particularly evident in the energy industries and transport sectors, even if these still generate the most emissions of all sectors. As signatories to the Paris Climate Agreement, Canada, Japan, Australia, China and the United Kingdom have pledged to achieve carbon neutrality in the long term. The United States' withdrawal from the Paris Climate Agreement entered into force in January 2026. This was followed, in February 2026, by the United States announcing its withdrawal from the entire United Nations Framework Convention on Climate Change (). As a result, the United States has stopped submitting information on its emissions for publication by the . That means, as far as portfolio holdings of sovereign bonds are concerned, that only emissions data estimated by third parties can be used for the period starting in 2023.**{#par-u6337i}
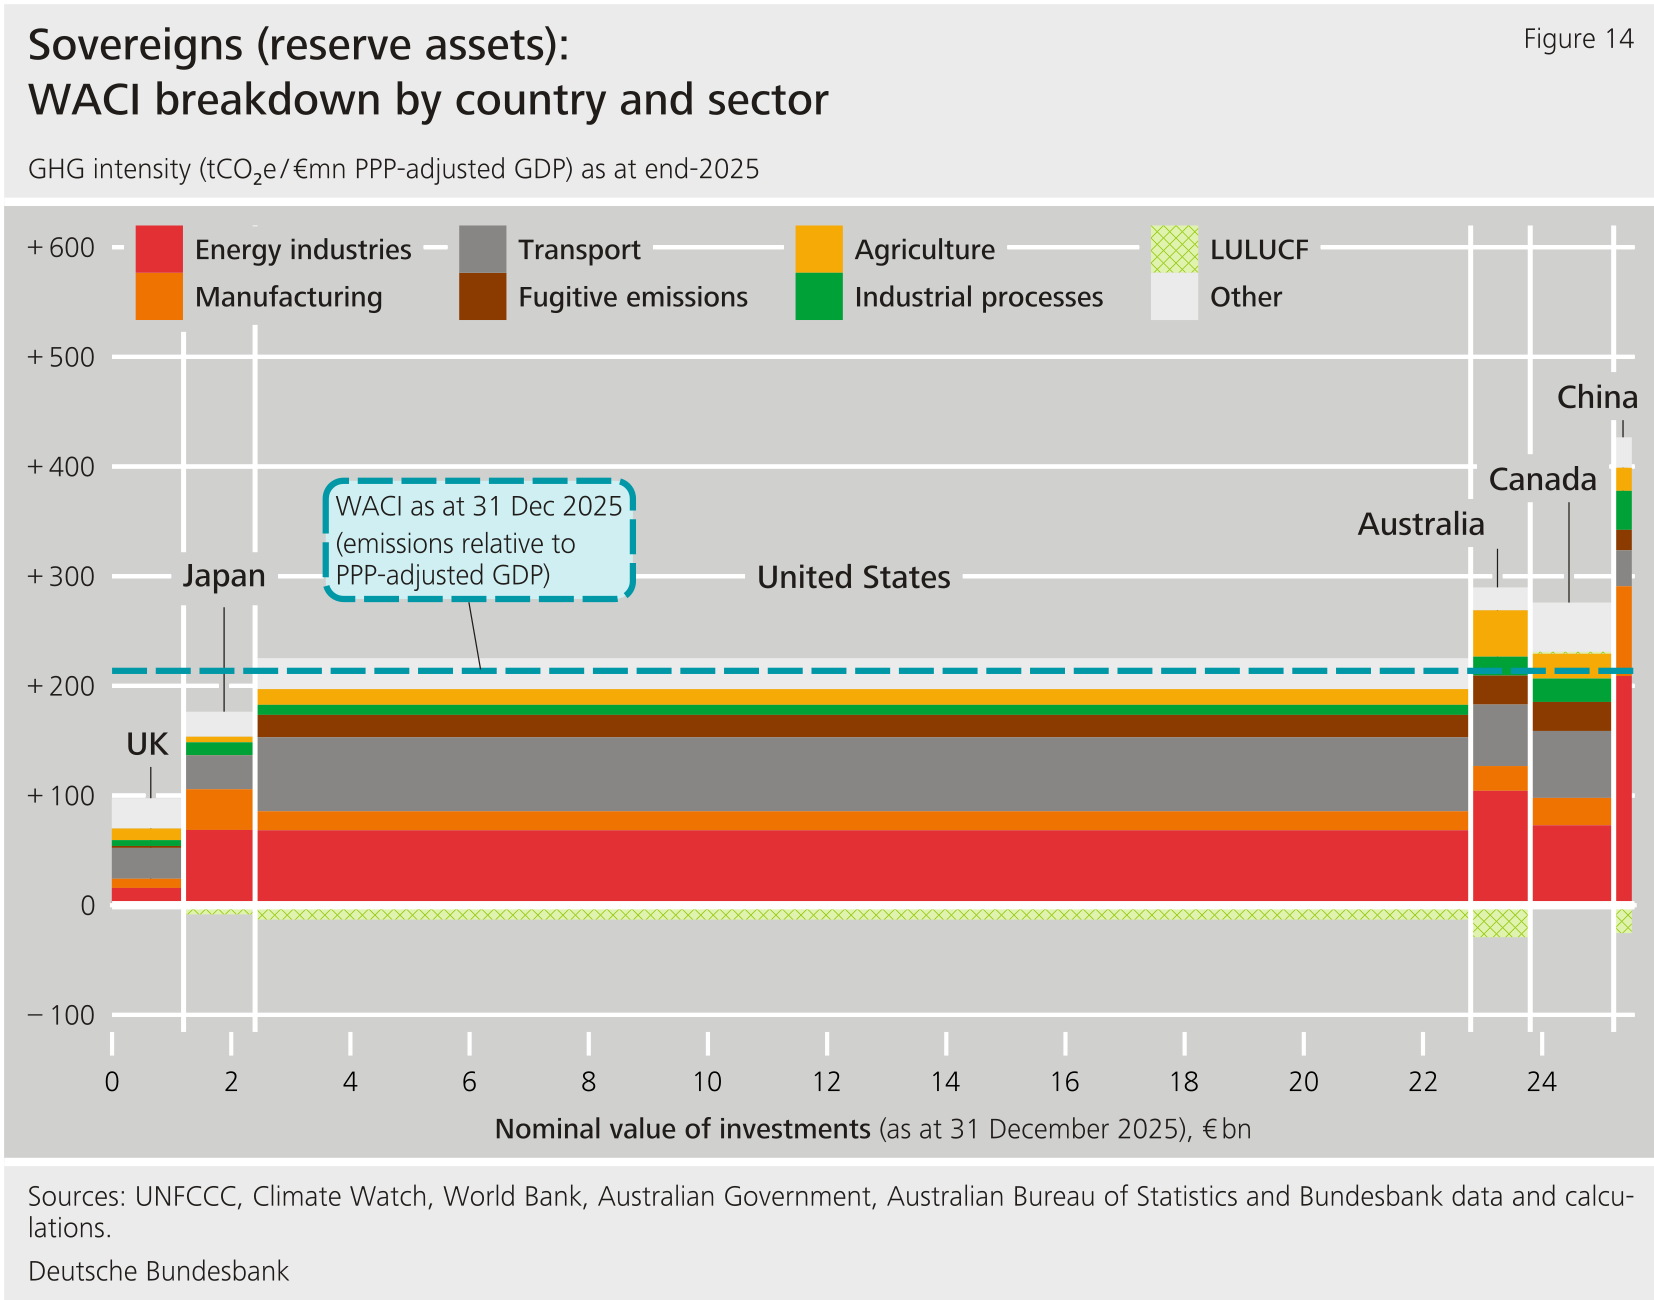
**However, as Figure 14 indicates, **the current** depends primarily on sovereign bonds because these make up the majority of investments in sovereigns, with a nominal value of almost €20 billion (total nominal value: €25.4 billion).**{#par-ae81e5}
{#par-oou5a7}
****
**When interpreting the reduction in the so far, it is important to bear in mind that the -- like other metrics -- may be biased downward by inflation. As a case in point, an inflation-driven increase in would reduce the even though the emissions themselves remain unchanged.[\[13\]](#_ftn_root_13)**{#par-a81eii}
**The method used so far to calculate the sovereign uses adjusted by as a financial reference variable. only reflects relative changes in purchasing power between sovereigns, however. Calculating the **using real** **adjusted by** as well means that inflation in the sovereigns can be taken into account, too. Using 2015 as the base year, if is adjusted for inflation for all subsequent years, the reduction up to 2025 comes to just 26.0 % in real terms, rather than a nominal 40.7 % (see Figure 15). Much of the reduction could therefore be explained by inflation. From 2022 onwards, in particular, the sharp rise in inflation rates has led to a stronger divergence in the metrics.**{#par-aueu7e}
{#par-eau11o}
**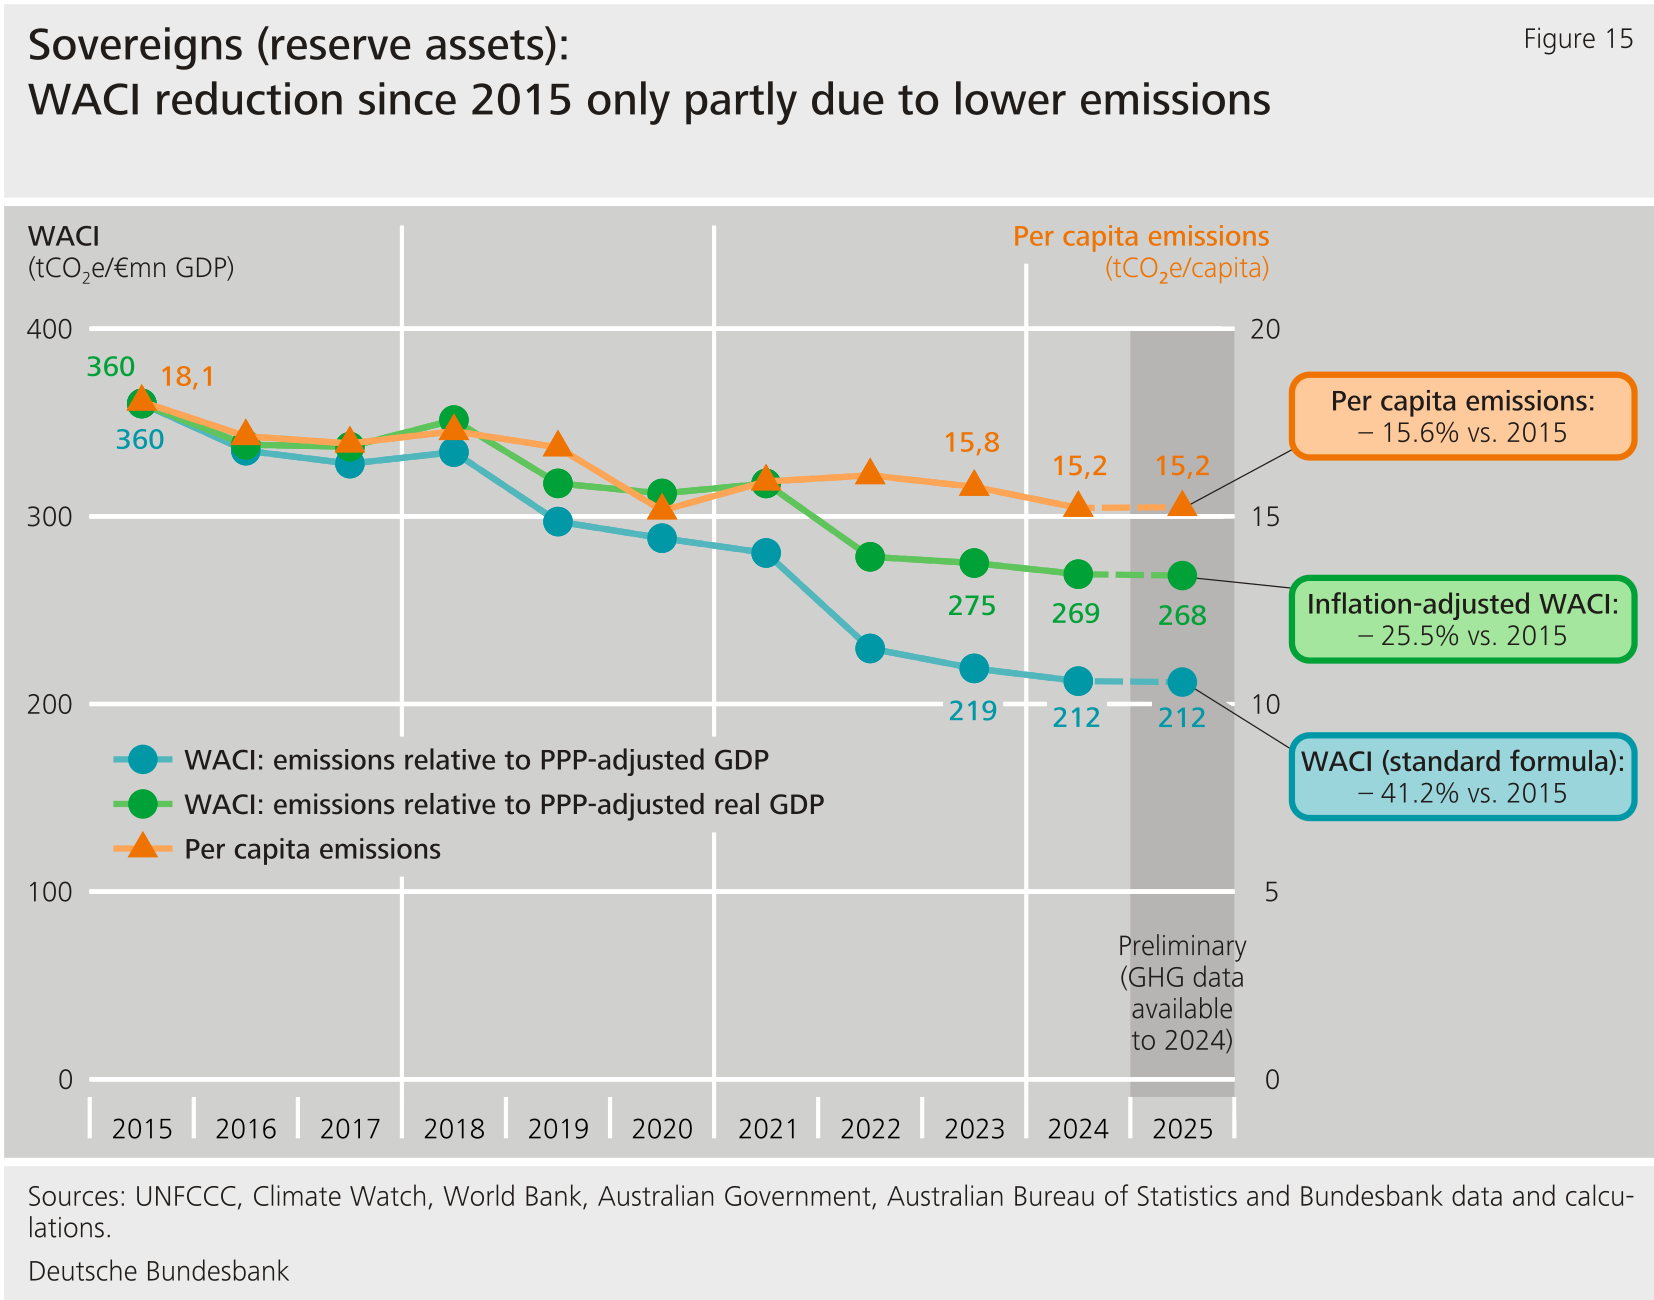**
****Per capita emissions** allow emissions to be viewed from another angle. If the size of the population, rather than , is used as the reference variable, the reduction is significantly smaller still (15.6 % between 2015 and 2025). Divergence increased, especially from 2021 onwards. Per capita emissions are broadly stable compared with the . This indicates that the reduction in recent years is due mainly to nominal economic growth, but also to real economic growth. Sovereigns' actual emissions, by contrast, have fallen only marginally since 2021.**{#par-i31o36}
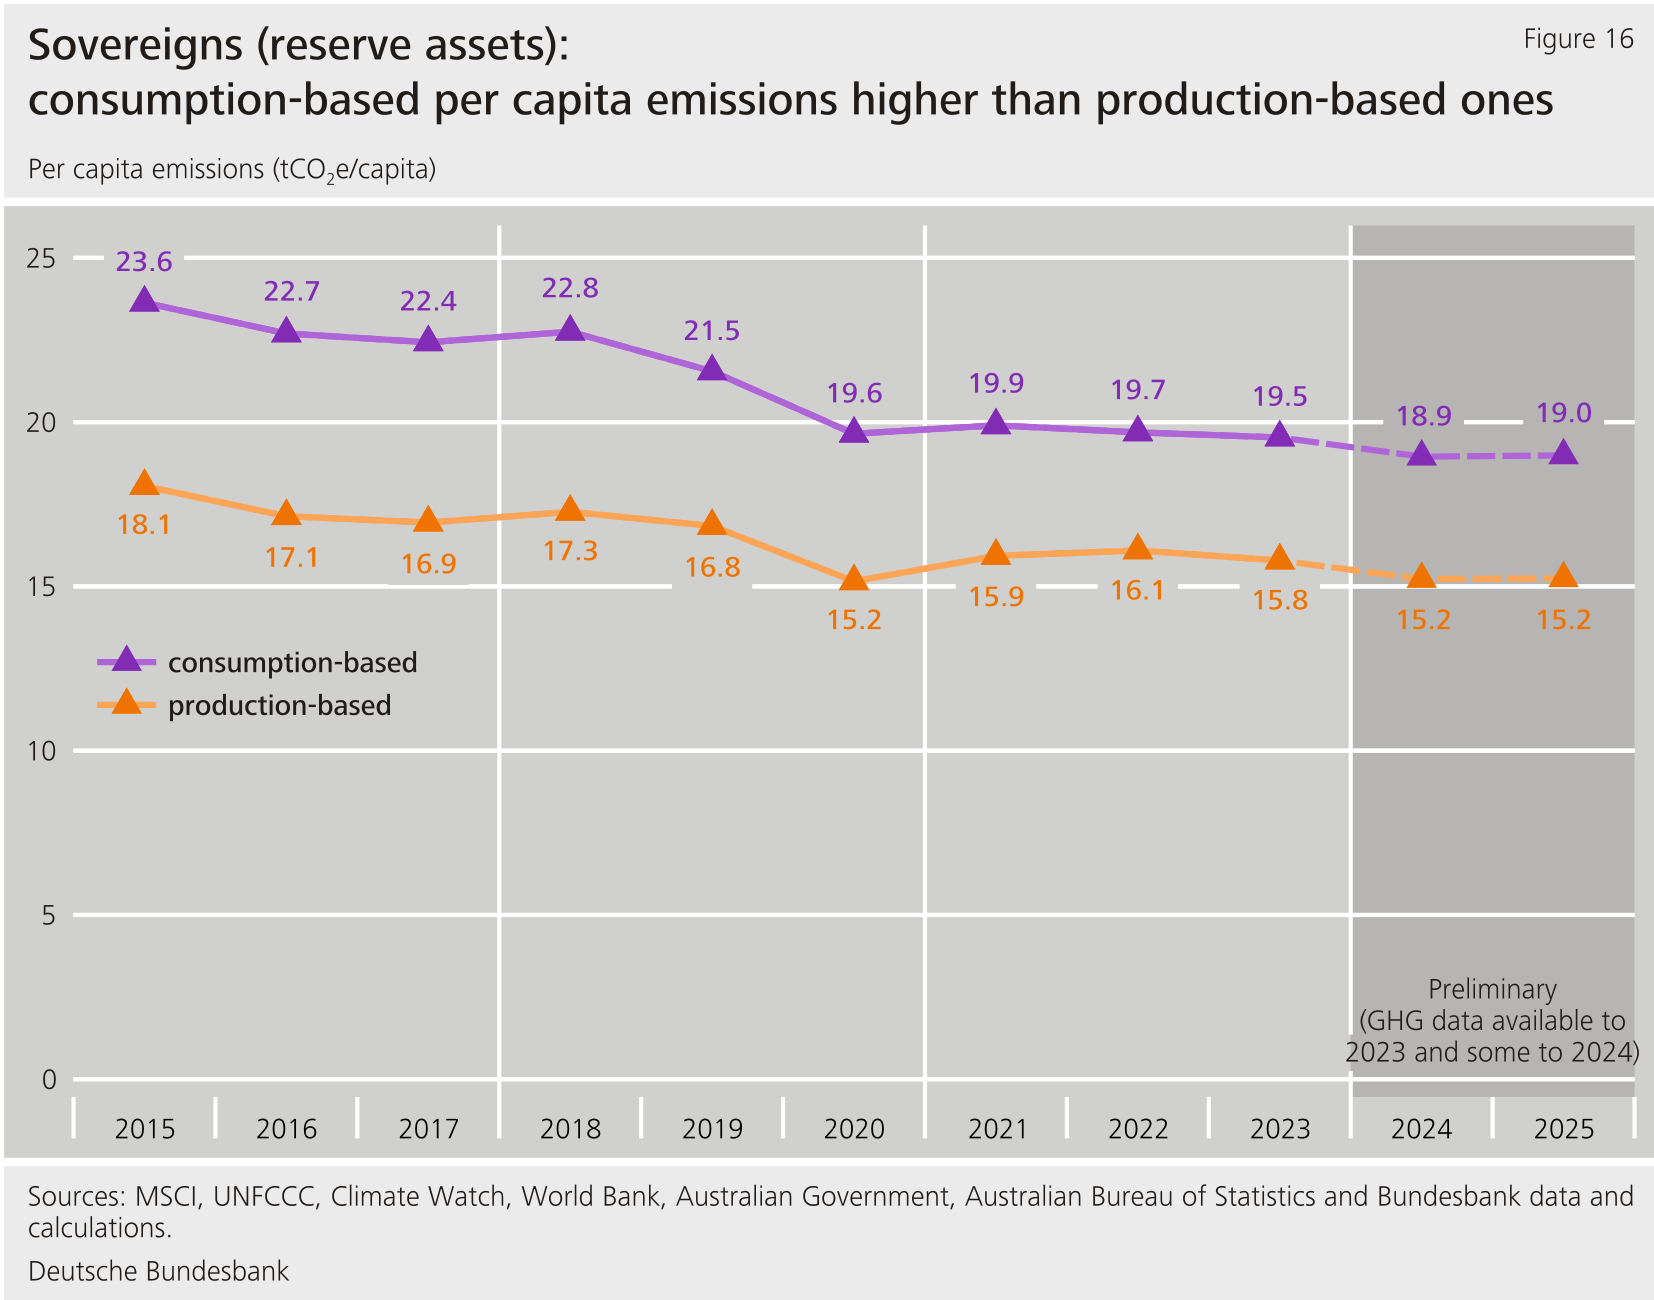
**In addition to the data examined so far, which were obtained using the production-based accounting approach, it is also possible to calculate metrics using [Annex](https://publikationen.bundesbank.de/content/998694). Comparing per capita emissions based on production-based and consumption-based data reveals that the latter are considerably higher (Figure 16). This is because, with the exception of China, the sovereign bonds included in the reserve assets were issued by advanced economies that import more -intensive goods than they export.**{#par-o8eu74}
{#par-e4i32i}
****
**See Table 7 in the Annex for more metrics on investments in sovereigns.**{#par-o12549}
#### **5.1.2.2 Production volumes of fossil fuels** {#tar-9}
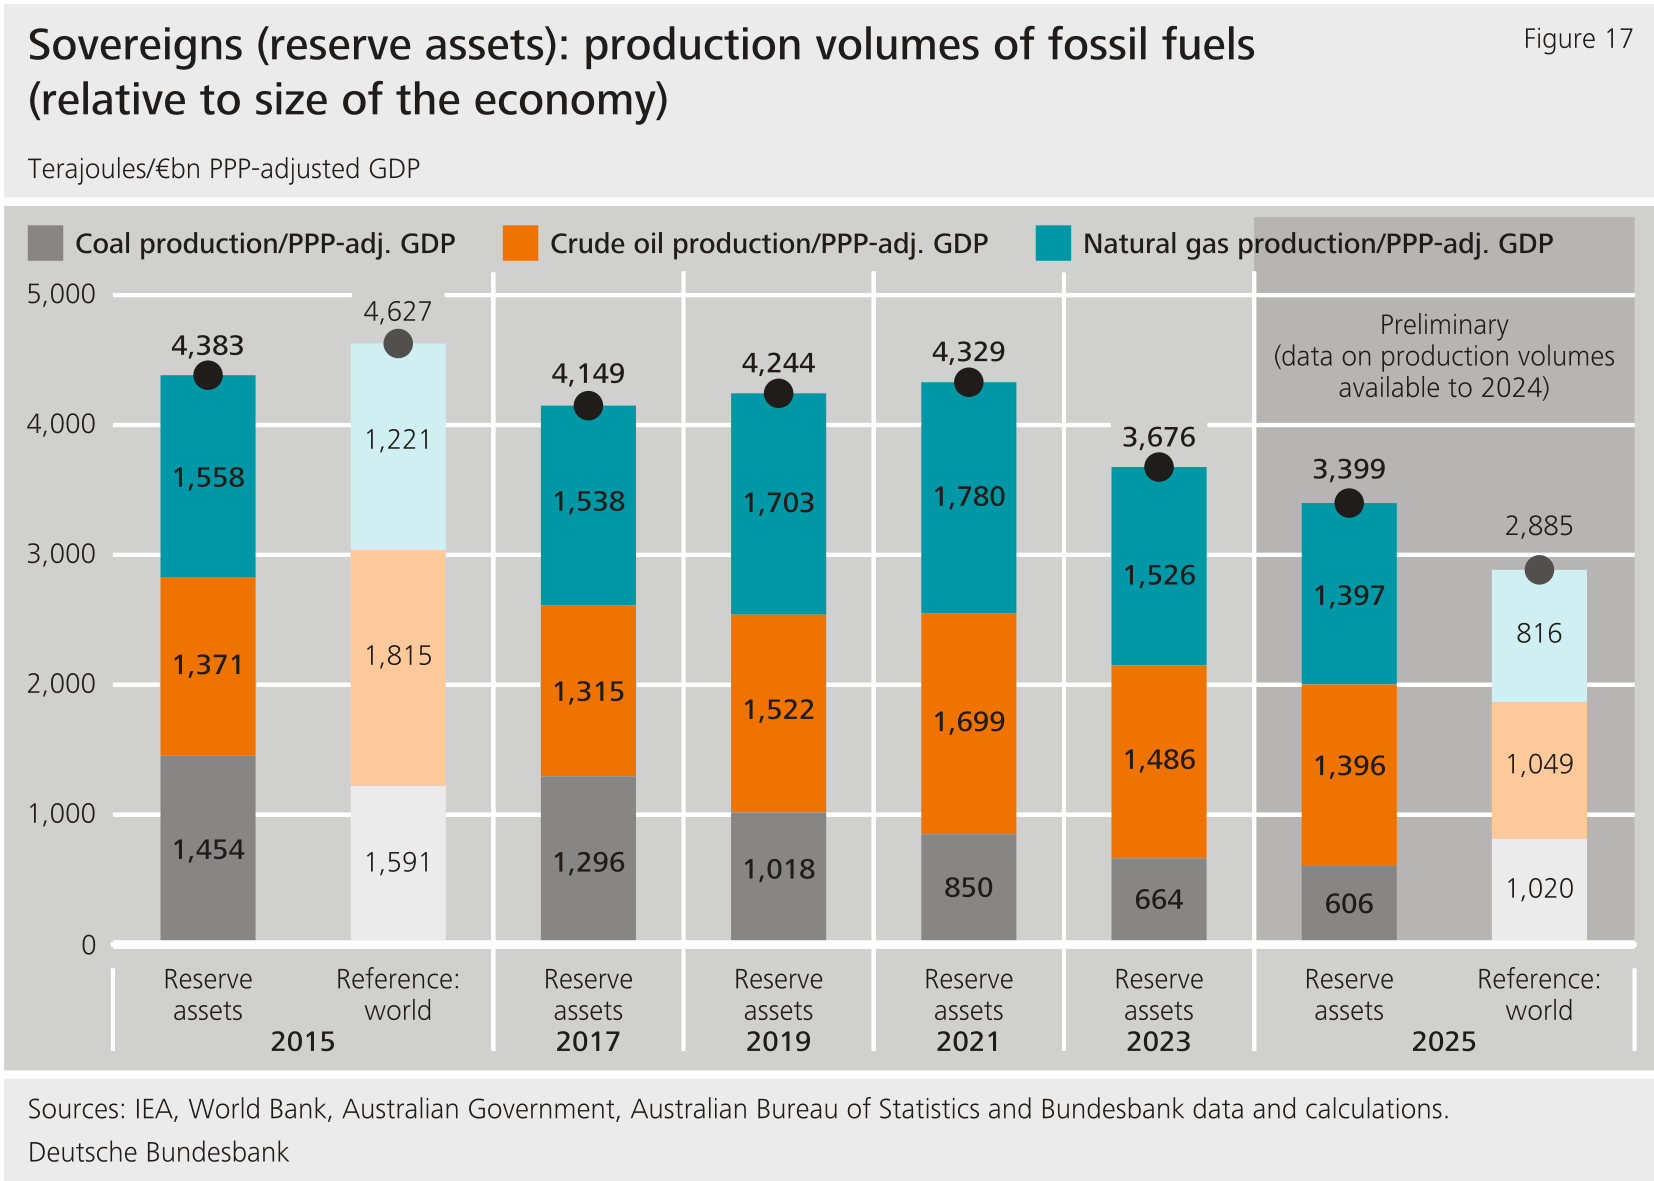
**Analysing production volumes of fossil fuels provides additional insights into the climate performance of sovereign investments. For one thing, exports of fossil fuels by these sovereigns involve indirect emissions that are not included in the available data. For another, the economic dependencies that coal, crude oil and natural gas-producing countries and regions might have on exports of those commodities can create financial risks. Those risks can arise if demand falls over the medium term because, for example, users transition away from coal-fired power generation and internal combustion engine vehicles, but also if geopolitical conflicts hinder exports.**{#par-o97586}
**Concerning the sovereign bond holdings, the [Annex](https://publikationen.bundesbank.de/content/998694) was significantly lower than the global average as at 31 December 2025 (see Figure 17). By contrast, both the **production volume of crude oil** and the **production volume of natural gas relative to the size of the economy** are higher than the global level.**{#par-a95u47}
{#par-e5u93u}
****
#### **5.1.2.3 Nature-related aspects** {#tar-10}
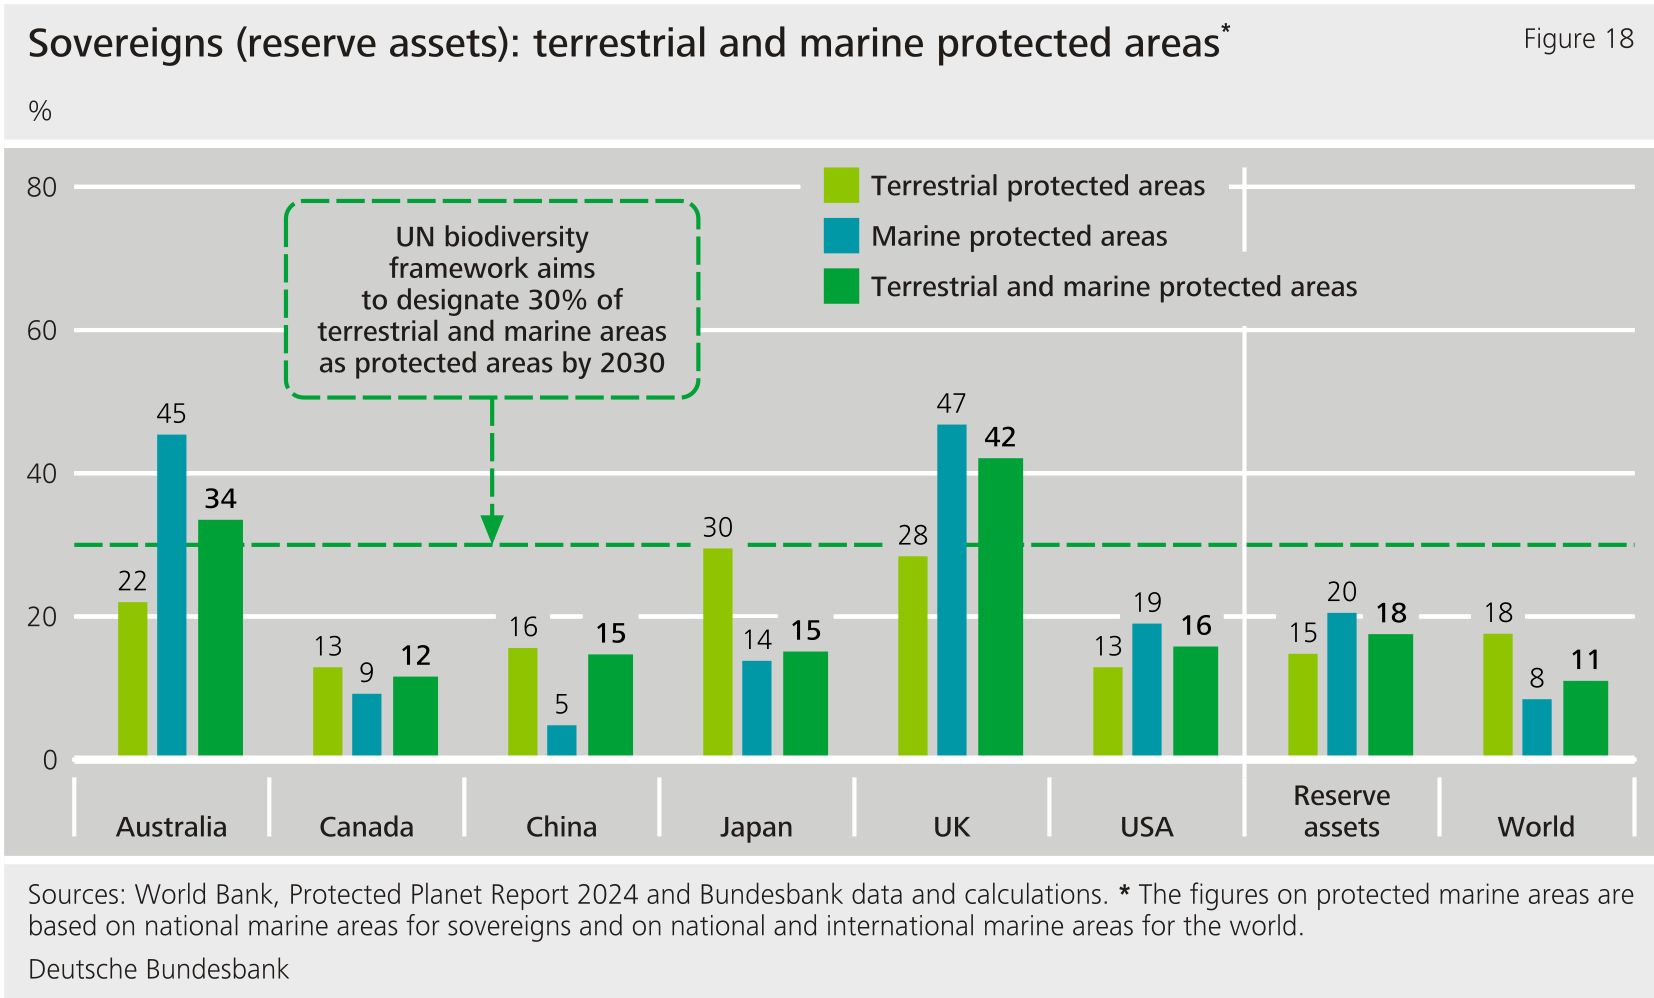
**Damage to natural areas leads to what is often an irreversible loss of biodiversity. At the same time, it weakens nature's ability to absorb carbon, which is a key prerequisite for meeting many climate targets globally and nationally (see [5 Metrics](https://publikationen.bundesbank.de/content/998690) and [Annex](https://publikationen.bundesbank.de/content/998694)). For these reasons and others, protecting natural terrestrial and marine areas is a key objective of the [**UN's Kunming-Montreal Global Biodiversity Framework**](https://www.cbd.int/gbf/targets), which the global community adopted in 2022. One target of this framework is to designate at least 30 % of the world's terrestrial and marine areas as protected areas by 2030. Figure 18 shows that most of the sovereigns relevant to the reserve assets are still a very long way off meeting this target. The same finding applies to the global aggregate.**{#par-e7788i}
{#par-iou526}
****
#### **5.1.2.4 Other sustainability matters** {#tar-11}
**The reserve assets contain fairly low to moderate shares of green bonds and comparable types of debt instruments, though the sustainable investment policies for those portfolios do not include any targeted purchases. The following shares of asset volumes are shown as intervals (Table 4). These account for whether green bonds or comparable types of debt instruments labelled as such by their issuers (end of interval) have also been verified by means of a second-party opinion as being compliant with standards (start of interval).[\[14\]](#_ftn_root_14)**{#par-o3ia2o}
| Table 4: Shares of green, social, sustainability and sustainability-linked bonds in the holdings of bonds issued by sovereigns (by nominal value) |||||
| | **Green** | **Social** | **Sustainability** | **Sustainability-linked** |
|--------------------------------------|-----------------|------------|--------------------|---------------------------|
| **Sovereign bonds (reserve assets)** | **0.5 %-3.7 %** | **0.0 %** | **0.0 %** | **0.0 %** |
{#par-e8o636}
### **5.1.3 Gold holdings** {#tar-12}
**A hypothetical approach is applied to the metrics shown below.[\[15\]](#_ftn_root_15) This assumes an amount of gold that is equal to the Bundesbank's current gold holdings and that was obtained in line with the global mix of today's gold production. This exercise was based on study findings and financial market reports on the performance of gold production from the present day or recent past. In order to reflect the range of findings made in the literature on the profile of gold production, the following metrics are shown in intervals.**{#par-oaeu1a}
**As at the reporting date of 31 December 2025, the Bundesbank's gold holdings amounted to 3,350 tonnes. For this amount of gold, the **absolute** **footprint** computed according to the hypothetical approach would be between 52.7 and 90.7mn tCO~2~e. Expressed relative to the market value of the gold holdings as at 31 December 2025 (€395.2bn), this would equate to a **carbon footprint** of between 133 and 230 tCO~2~e/€mn of investment. Distributed across the average holding period of the Bundesbank's gold (currently around 64 years), the annual carbon footprint would amount to around 3 to 5 tCO~2~e/€mn of investment.**{#par-oi9ee4}
**Compared with the previous year, this "annualised" carbon footprint of gold holdings has declined significantly. In small part, this is due to the lengthening holding period. Mostly, though, it is because of the considerable increase in the price of gold: the carbon footprint thus attributes a higher degree of efficiency to the gold holdings relative to their value as an asset.**{#par-e8u355}
**5.2 Monetary policy financial assets** {#tar-13}
--------------------------------------------------
**As regards the Eurosystem's monetary policy holdings of covered bonds and corporate bonds, the Bundesbank reports below on metrics calculated centrally for the Eurosystem by the (Table 5 and Table 6). These metrics are also being published in the [climate-related financial disclosures of Eurosystem assets held for monetary policy purposes](https://www.ecb.europa.eu/ecb/climate/climate-related-financial-disclosures/html/index.en.html).**{#par-o4ei63}
**Income and risks arising from these holdings are shared among Eurosystem national central banks according to their shares in the 's [capital key](https://www.ecb.europa.eu/ecb/orga/capital/html/index.en.html). Accordingly, the Eurosystem has agreed to allocate the total carbon emissions by Eurosystem national central banks based on their respective capital keys. Relative metrics, such as and the carbon footprint, are independent of portfolio size, and are therefore identical for all Eurosystem central banks.**{#par-euo433}
|----------------------------------------------------------|------------------|-------------|
| Table 5: Covered bonds in monetary policy and portfolios as at 31 December 2025 |||
| **Eurosystem holdings** (by nominal value, €bn) || **215.4** |
| **Bundesbank capital key** || **26.63 %** |
| (tCO~2~e/€mn of gross income) | **Scope 1 \& 2** | **1.3** |
| (tCO~2~e/€mn of gross income) | **Scope 3** | **2,567** |
| **Total carbon emissions of Bundesbank share** (tCO~2~e) | **Scope 1 \& 2** | **15,496** |
| **Total carbon emissions of Bundesbank share** (tCO~2~e) | **Scope 3** | **28.0 mn** |
| **Carbon footprint** (tCO~2~e/€mn of investment) | **Scope 1 \& 2** | **0.32** |
| **Carbon footprint** (tCO~2~e/€mn of investment) | **Scope 3** | **575.6** |
{#par-i5i376}
|----------------------------------------------------------|------------------|-------------|
| Table 6: Corporate bonds in monetary policy and portfolios as at 31 December 2025 |||
| **Eurosystem holdings** (by nominal value, €bn) || **287.9** |
| **Bundesbank capital key** || **26.63 %** |
| (tCO~2~e/€mn of gross income) | **Scope 1 \& 2** | **160.6** |
| (tCO~2~e/€mn of gross income) | **Scope 3** | **1,179** |
| **Total carbon emissions of Bundesbank share** (tCO~2~e) | **Scope 1 \& 2** | **7.0 mn** |
| **Total carbon emissions of Bundesbank share** (tCO~2~e) | **Scope 3** | **62.1 mn** |
| **Carbon footprint** (tCO~2~e/€mn of investment) | **Scope 1 \& 2** | **94.0** |
| **Carbon footprint** (tCO~2~e/€mn of investment) | **Scope 3** | **830.1** |
{#par-a53e94}
1. **{#_ftn_root_1} This report mostly uses the name "promotional and development banks" to refer to these institutions. That name should be read as including certain institutions with a public mandate that are not promotional banks.**
2. **{#_ftn_root_2} Sustainability disclosures conforming with the were first published in 2025. These standards aim to provide a more comprehensive and comparable pool of data.**
3. **{#_ftn_root_3} Dedicated data on the cover pools of the covered bonds are not available. They are, however, partly reflected in the metrics under scope 3.**
4. **{#_ftn_root_4} Data on bank-financed scope 3 emissions are still highly uncertain, however, and are probably still significantly understated. This is because banks' initial disclosures on financed emissions have, for the most part, only covered assets for which the methods used to account for emissions are already fairly well established (such as loans to large firms). Gradually adding more asset classes to the scope of coverage will lead to higher emissions disclosures. This means they are of limited value for comparisons over time. There is also the risk that the 's decision to narrow the scope of mandatory sustainability reporting will worsen the data situation again, particularly for banks' scope 3 emissions (above all their financed emissions).**
5. **{#_ftn_root_5} See [International Monetary Fund (IMF)](https://www.bundesbank.de/content/625830)**
6. **{#_ftn_root_6} For most banks, the vast majority of loans are classified by as not being beneficial or harmful.**
7. **{#_ftn_root_7} To avoid multiple counting, the Bundesbank counts business activities that assigns to multiple environmental goals only once for the green or brown share.**
8. **{#_ftn_root_8} The available data do not, however, contain any information on existing and future local climate change adaptation measures such as flood defences. Thus, no inference about how resilient the cover pools are to physical risks can be made.**
9. **{#_ftn_root_9} For reasons of scale, only the jurisdictions in continental Europe are shown on the following maps. Covered bonds from Australia make up a very small share of the covered bond holdings in the euro portfolio.**
10. **{#_ftn_root_10} For simplicity, overseas territories are not shown on the maps used in this section.**
11. **{#_ftn_root_11} Bonds are classified as non-verified if the Bundesbank has no information on their verification.**
12. **{#_ftn_root_12} To calculate and climate metrics, deposits with central banks are treated in the same way as, and added to, sovereign bonds. As a result, data on sovereigns are applied to both.**
13. **{#_ftn_root_13} The distortionary effects examined below also affect other asset classes. With regard to sovereigns, however, they can be identified relatively clearly based on macroeconomic data.**
14. **{#_ftn_root_14} Bonds are classified as non-verified if the Bundesbank has no information on their verification.**
15. **{#_ftn_root_15} See Deutsche Bundesbank (2024b). Section 5.2.3 describes the calculation factors and sources in greater detail and also conducts a general sustainability assessment of gold as an asset class.**
*[UNFCCC]: United Nations Framework Convention on Climate Change)
*[GHG]: Greenhouse Gas
*[HTTs]: Harmonised Transparency Templates
*[TCFD]: Task Force on Climate-Related Financial Disclosures
*[ICMA]: International Capital Market Association
*[ESRS]: European Sustainability Reporting Standards
*[**WACI**]: Weighted Average Carbon Intensity
*[PEPP]: pandemic emergency purchase programme
*[PPP]: purchasing power parity
*[GDP]: gross domestic product
*[WACI]: Weighted Average Carbon Intensity
*[ESG]: environmental, social and governance
*[UN]: United Nations
*[US]: United States
*[IMF]: International Monetary Fund
*[ECB]: European Central Bank
*[ISS]: Institutional Shareholder Services
*[**GDP**]: gross domestic product
*[**PPP**]: purchasing power parity
*[CSPP]: corporate sector purchase programme
*[EU]: European Union
*[LULUCF]: Land Use, Land-Use Change and Forestry
*[**IMF**]: International Monetary Fund
*[SDGs]: Sustainable Development Goals
*[CBPP3]: third covered bond purchase programme
*[PCAF]: Partnership for Carbon Accounting Financials
*[**GHG**]: Greenhouse Gas