Government investment: gear new scope for borrowing towards infrastructure Monthly Report – January 2026

Monthly Report

Good public infrastructure is important for competitiveness and economic growth. In Germany, however, vulnerabilities have recently come to the fore: bridges and railway sections important for traffic are in need of repair, educational institutions need renovation, and the digitalisation of public administration is progressing only slowly. Surveys, studies or statistical indicators have their limitations, but they point to increased need for government investment. In response, central government has set up the Infrastructure and Climate Neutrality Fund which has extensive scope for borrowing.

Sufficient government funds are a prerequisite for ensuring efficient infrastructure. Where government funds are scarce, investment is at risk of being pushed out by other expenditure and falling by the wayside. But even when financial resources are available they are obviously not sufficient on their own; planned investment expenditure has only partially been spent in recent years, for example. Thus, the push to accelerate approvals and contract awards, including legal review procedures, is welcome. Using the funds in a targeted and economical manner is also key. When it comes to investment needs at local government level, state governments have a role to play alongside local governments themselves. They should, where necessary, provide sufficient scope for investment via budgetary oversight or additional grants. 

The new off-budget special fund offers a good opportunity to modernise government infrastructure. Instead, central, state and local governments are currently planning to use a large portion of the funds to close funding gaps in non-investment projects. In the face of rising demographic pressures and large funding gaps going forward, pressure to crowd out investment could increase. 

Both the new special fund and debt brake reform could be used to better secure a strengthening of infrastructure within these government budgets. In the case of the special fund, borrowing could be more closely tied to increasing fixed asset formation related to infrastructure. This makes it more likely that these investments will actually go well beyond depreciation, amortisation and write-downs and that the quality of the infrastructure will increase markedly. In addition, the financing of additional investment in infrastructure could be better secured even after the fund expires. To this end, the Bundesbank is proposing a permanent, earmarked scope for borrowing as part of a debt brake reform, pragmatically linked to the fund. This proposal makes it easier to keep the government investment ratio at an elevated level in the longer term if necessary. 

1 Introduction

German infrastructure needs improvement in some areas. The government’s planned investment offensive is therefore understandable. For a long time, government infrastructure was seen as one of Germany’s important advantages as a business location and as a counterweight to a fairly high tax burden. However, infrastructure vulnerabilities have increasingly taken centre stage. The prospect of additional funding for investment and measures to speed up implementation processes provides an opportunity to address these vulnerabilities quickly.

This report first briefly describes the structure and development of government investment in Germany. It then looks at how scope for additional borrowing could be directed more specifically towards additional infrastructure-related investment in the future. The Infrastructure and Climate Neutrality Fund provides some short-term approaches for this purpose. Following these, an arrangement forming part of a fundamental reform of the debt brake would be advisable. The report builds on the Bundesbank’s suggestions from last year and explains them in more detail in connection with the above. The annex to this report explains some specific aspects of government investment in more detail in order to ensure greater transparency in an at times complicated and multifaceted discussion. It contains discussions of various investment concepts and available statistics on government investment in further detail (in-depth analysis 1). This is followed by explanations of developments in government investment and government capital stock in Germany and an international comparison (in-depth analyses 2 and 3) and then by studies on investment needs (in-depth analysis 4). 

2 A brief overview of government investment
The government generates wealth by means of investment expenditure. Fixed asset formation is a key driver of government infrastructure. Construction investment is used by the government to build or modernise roads and buildings, for example, while investment in machinery and equipment is used to purchase motor vehicles, military goods or IT infrastructure. These non-financial assets can be used for several years. 1 Wear and tear is taken into account by means of depreciation, which represents the loss in value of non-financial assets over time. 

Investment as recorded in the national accounts comes closest to this economic perspective (for various statistical definitions, see in-depth analysis 1). This report therefore uses those figures as a key tool to illustrate developments in government investment. The national accounts investment largely reflects expenditure on government infrastructure. However, it also includes, for example, investment in military equipment or in research activities that create intellectual property. The concept of investment used in government budgets (government finance statistics) differs from the above and is more oriented towards payment flows. Investment-oriented fiscal rules are, for practical reasons, mostly based on figures as they appear in government finance statistics – this includes the recommendations in this report.

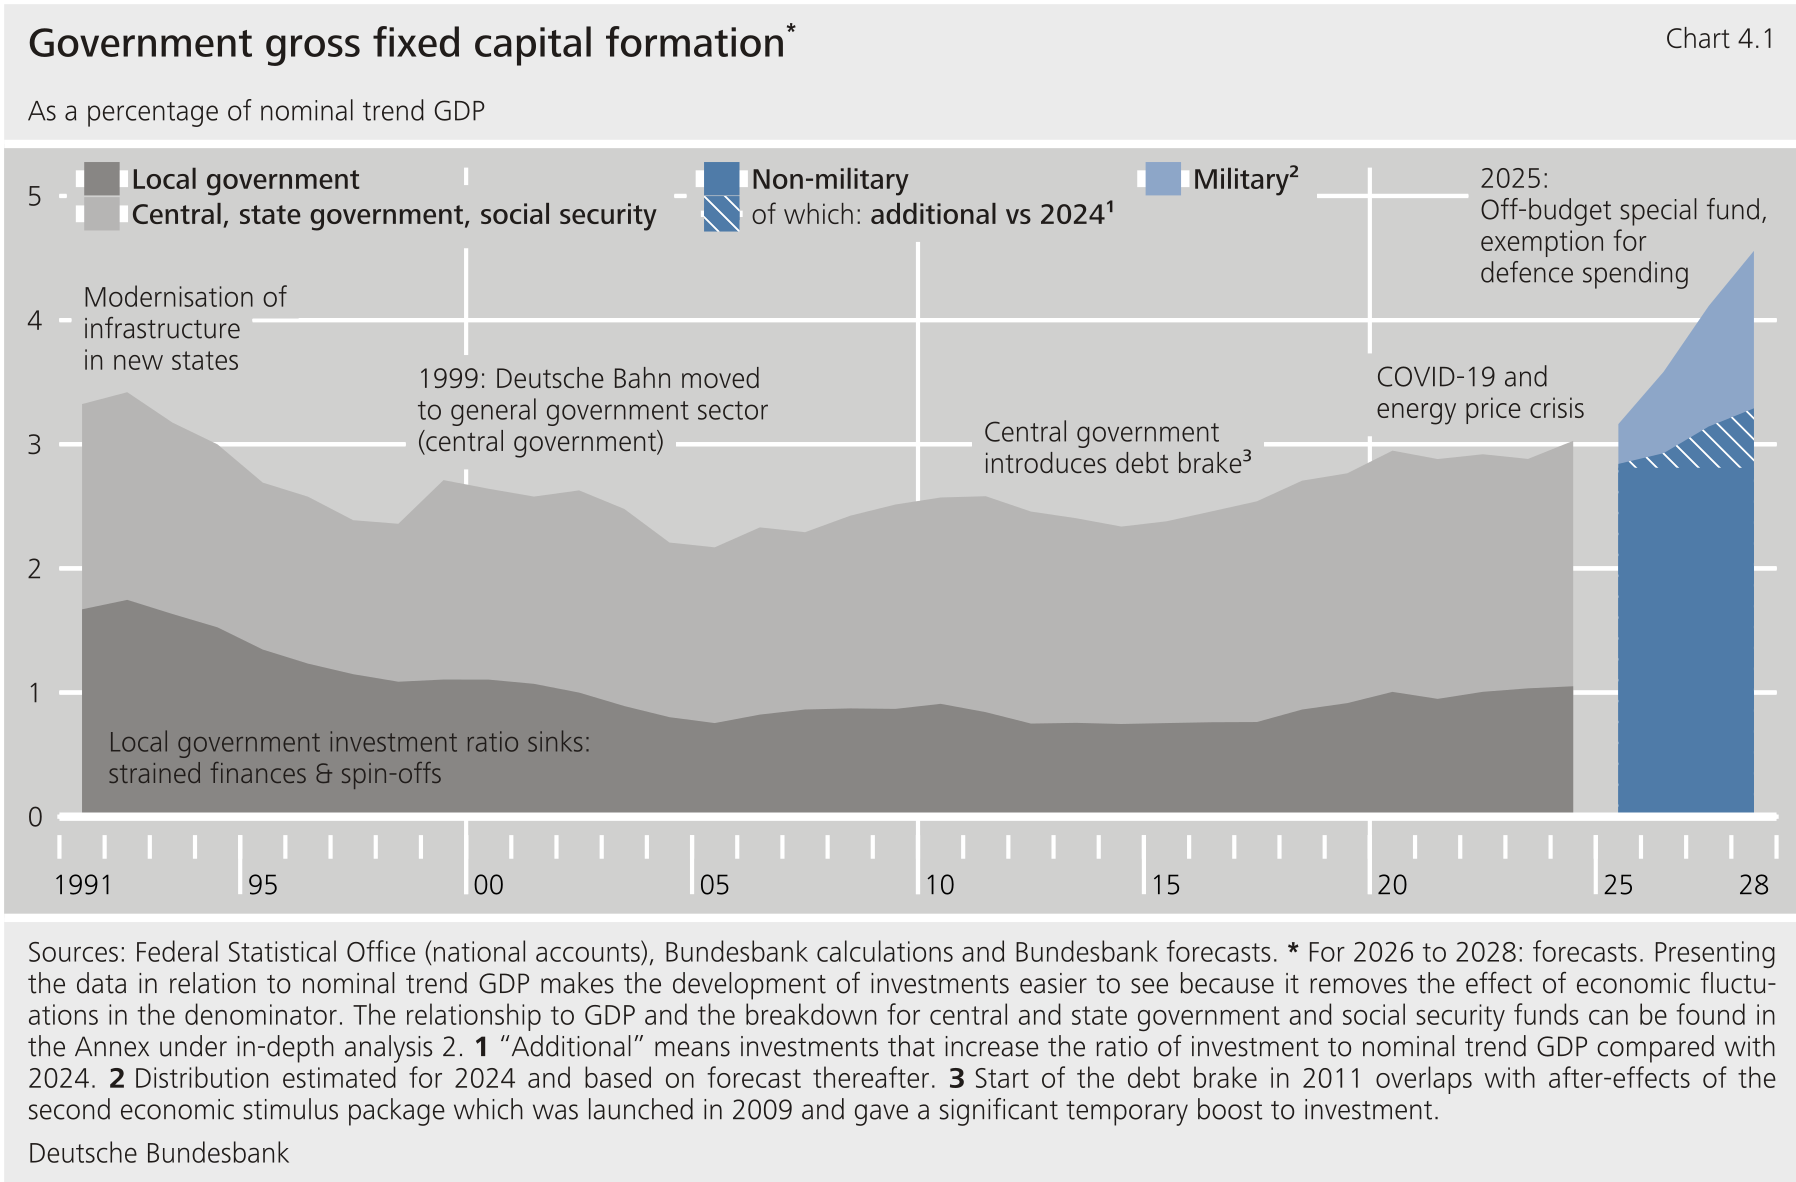
After the post-reunification peak, government investment (national accounts) as a percentage of GDP in Germany was, for a long time, low (see in-depth analysis 2 for national developments and in-depth analysis 3 for international developments). At the beginning of the 1990s, the government’s (gross) investment ratio was slightly above 3 %. This higher investment was used, in particular, to modernise the infrastructure in the new federal states. This was followed by around 20 years of a lower investment ratio (2½ % on average). The decline in the ratio was largely attributable to local governments. Tight fiscal positions are likely to have contributed here as well as spin-offs to the private sector (especially in municipal waste and wastewater management and water collection, treatment and supply). In recent years, the general government investment ratio has risen again to an average of 3 %, reaching 3.2 % in 2025 according to preliminary figures. 2  

Government gross fixed capital formation

Low net investment and the ageing of the capital stock indicate a need for modernisation. Net investment shows the extent to which annual (gross) investment exceeds depreciation. On average, it has been only slightly positive over the past few decades and has even been negative in some years. Data on the government capital stock indicate that it has been ageing continuously – the “degree of modernity” has gone down. The net capital stock (which takes into account steady depreciation) has developed less slowly than the gross capital stock (which includes all investments at their replacement values).

Compared with the euro area, the government investment ratio in Germany was rather low for some time. In recent years, however, the ratios have converged. Note, though, that different distributions of tasks between government and the private sector restrict the international comparability of government investment ratios, among other factors. For example, government investment in Germany in the health and environmental sectors is relatively low, as the private sector has a greater share of these areas. Other countries appear to also shift more investment to the private sector through methods such as public-private partnerships. 

The bulk of government investment in Germany was in the areas of transport, general public services (including research and development) and education. Major examples of local government investment include local transport routes and school and administrative buildings, followed by recreational and cultural facilities. State government investment is also concentrated on transport routes (state roads), education and research (especially universities). The area of public order and safety (police and justice) follows at a significant distance. Central government invested mainly in the federal rail and road network. Defence investment had a fairly low share, amounting to around 0.2 % of GDP over the past decade. Construction is the dominant type of investment, accounting for around 60 % of the total. The government capital stock consists largely of building construction and civil engineering works, partly because these are typically usable for longer than the other types of investment.

In future, proper assessment of infrastructure needs and areas that have fallen behind would be aided by quality indicators that were meaningful and easy to compare. In this respect, it would be preferable if all central, state and local governments would provide such indicators for their most important areas of responsibility. Nationwide, detailed and up-to-date cost statistics (e.g. on road construction) would also be helpful. They could improve transparency and cost efficiency. 

Various international indicators on infrastructure competitiveness, national studies on investment needs or surveys on location strengths and weaknesses are currently available (in-depth analysis 4). Owing to methodological differences (such as differing definitions), these do not show directly comparable annual investment needs. However, the need to catch up in the areas of transport infrastructure, educational institutions and the digitalisation of public administration is well documented. 3  

Extensive new scope for borrowing for defence and infrastructure was created last year, and a significant increase in the investment ratio is therefore expected for the coming years. 4 This mainly concerns the military sector, which is to be expanded significantly in line with NATO requirements. As a result, government investment in machinery and equipment, in particular, will rise sharply. However, investment expenditure in the civilian sector is also expected to grow in connection with the Infrastructure and Climate Neutrality Fund. According to the Bundesbank’s current forecast, general government gross fixed capital formation will rise from just over 3 % of GDP in 2024 to around 4½ % of GDP in 2028. Such large increases make the exact level of future investment growth difficult to estimate with any degree of certainty, for military and civilian investment alike.

However, additional funding alone is not sufficient to significantly and swiftly improve infrastructure. Swift selection and implementation of appropriate projects is also essential. The agreements concluded by central and state governments alongside the Federal Government’s December 2025 plans could contribute to accelerated implementation. 5 At the same time, it is important to keep an eye on cost efficiency. When aiming for a strong ramp-up of investment expenditure, it is important to ensure it is not “swallowed up” by price increases. It also seems sensible to coordinate investment effectively between the different layers of government, for example in digitalisation projects involving multiple federal states. State governments should also provide administrative support to their local governments for investment projects where needed.

Despite the need to catch up on infrastructure, there is a risk that such investments will be crowded out in government budgets. To counter this, the Bundesbank recommends that, in future, parts of the scope for borrowing be specifically linked to investment expenditure. These proposals relate to the Infrastructure and Climate Neutrality Fund and follow-up provisions as part of a fundamental reform of the debt brake. The aim here is to provide a pragmatic and manageable plan that limits the problems associated with such investment-oriented fiscal rules as far as possible. Investments should be suitably defined (more narrowly and focused on infrastructure in a traceable way) and the scope for borrowing should be concentrated on additional investment (in the sense of increased investment). In addition, it seems advisable that when the debt brake is fundamentally reformed, sound public finances must again be reliably safeguarded and the debt ratio must be limited.

The Infrastructure and Climate Neutrality Fund is intended to finance additional government investment in order, above all, to strengthen infrastructure. In March 2025, legislators enshrined €500 billion of borrowing scope for the Fund for an approval window of 12 years in the Basic Law. Of this amount, €300 billion is earmarked for central government investment in infrastructure. A further €100 billion is reserved for investment projects by state governments (including their local governments) and €100 billion for investment in climate neutrality. 

3.1.1 Basic considerations for defining additional investment in infrastructure

The Bundesbank recommends a comparatively easy-to-apply and transparent approach that is as targeted as possible. 

  • Defining infrastructure-related investment: For pragmatic reasons, the concept is defined on the basis of the delineations applied for budget plans (for a more precise clarification, see in-depth analysis 1). Specifically, this includes expenditure on non-financial asset formation (buildings, equipment and land) as well as investment grants for central government-owned entities like Autobahn GmbH and Deutsche Bahn. 6 Ultimately, these investment grants also flow into infrastructure expenditure, which can be attributed to central government. Investment grants to entities outside the government sector (to private-sector enterprises or abroad) are not included here. Investment grants to other levels of government are not taken into account, as their infrastructure investments are billed separately. 

  • Measuring additional investment: Growth in infrastructure-related investment as a percentage of GDP compared against the result of a comparison year seems a sound choice of benchmark. This measure is easy to understand and ascertain. It shows how much investment expenditure has actually been stepped up compared with the past. 7 In this framework, the only investment expenditure that is additional is that which grows more strongly than general economic activity and its price developments. Basing assessment around general economic activity seems more intuitive from an economic perspective than benchmarking investment expenditure against the volume of expenditure in the central government budget. Central government expenditure is shaped, for example, by central government grants to the statutory pension insurance scheme or by interest expenditure, and it does not seem appropriate to tie the baseline for additional investment to this. The Bundesbank uses the result of 2024 as a point of reference for measuring additionality because the special fund was established in 2025. A multi-year average of the recent past would be a plausible alternative. As infrastructure-related investment has recently risen more sharply, the benchmark for this second variant works out somewhat lower. In the proposed definition, the benchmark for central government in the ratio’s numerator is €31 billion if 2024 is used as a reference point. If the average of 2022 to 2024 is used, the somewhat lower ratio would result in a starting point that would be €3 billion lower.

The proposed approach deviates from the definition currently used by central government when drawing on the special fund (for more concrete, quantitative details on the plans, see Chapter 3.1.2 below). This is not intended to question central government’s approach from a legal perspective. Rather, it is a question of finding an economic definition that captures additional central government expenditure on its own infrastructure as well as possible. This is why the concept of “investment” used by the Bundesbank excludes expenditure on development aid, calls on guarantees and investment grants to non-government enterprises, for example. Furthermore, investment that is already financed by loans under the exemption for defence spending is also excluded here. By contrast, central government includes all of the aforementioned cases in its definition. In addition, for the purposes of assessing and ensuring additionality, central government has opted for a ratio to core budget expenditure as a benchmark (10 % of expenditure after deduction of financial asset acquisition and excluding the sectoral exemption for defence spending). That ratio was already significantly exceeded in 2024 on balance. From this starting point, the Infrastructure and Climate Neutrality Fund can therefore take on some investments from the core budget and finance them on credit without failing to meet the central government’s additionality criterion. In the core budget, these shifts open up scope for additional current expenditure or tax cuts, for example.

In some approaches, additionality is measured by the extent to which expenditure goes beyond previous plans 8 or specific new projects are financed. 9  However, this seems less practical and transparent:

  • A comparison with previous budget plans can only show additionality with greater restrictions and where it shows it at all it is temporary. This would also require clarifying which plans it should be based on. In any case, in autumn 2024, the then government was no longer able to agree on a budget plan for 2025. That means the central government plan for 2025 drawn up in summer 2024, for example, no longer seems a convincing point of comparison. Second, budget plans from the period prior to the entry into force of the Infrastructure and Climate Neutrality Fund are only usable as yardsticks for a transitional period in any case. And it would be unclear how the method would proceed in the future.

  • Tying the definition to specific new investment projects also does not seem a good idea for several reasons. Amongst other things, the German government sector invests in numerous projects with different timeframes. There is no consistent, informative overview that is also understandable to external parties. This makes it more difficult to verify whether the criterion has been formally complied with. In addition, governments could simply postpone older projects and instead adopt comparable projects that are new on paper. This would allow them to circumvent otherwise necessary cuts in current expenditure. On balance, this would potentially leave infrastructure without additional improvement. The concept is also not future-proof because the planned projects cover only a limited period of time. The more projects are completed, the more projects are considered additional – until all projects and investment expenditure are ultimately additional when judged by this scale. 

3.1.2 Current plans for use of the resources in the off-budget special fund
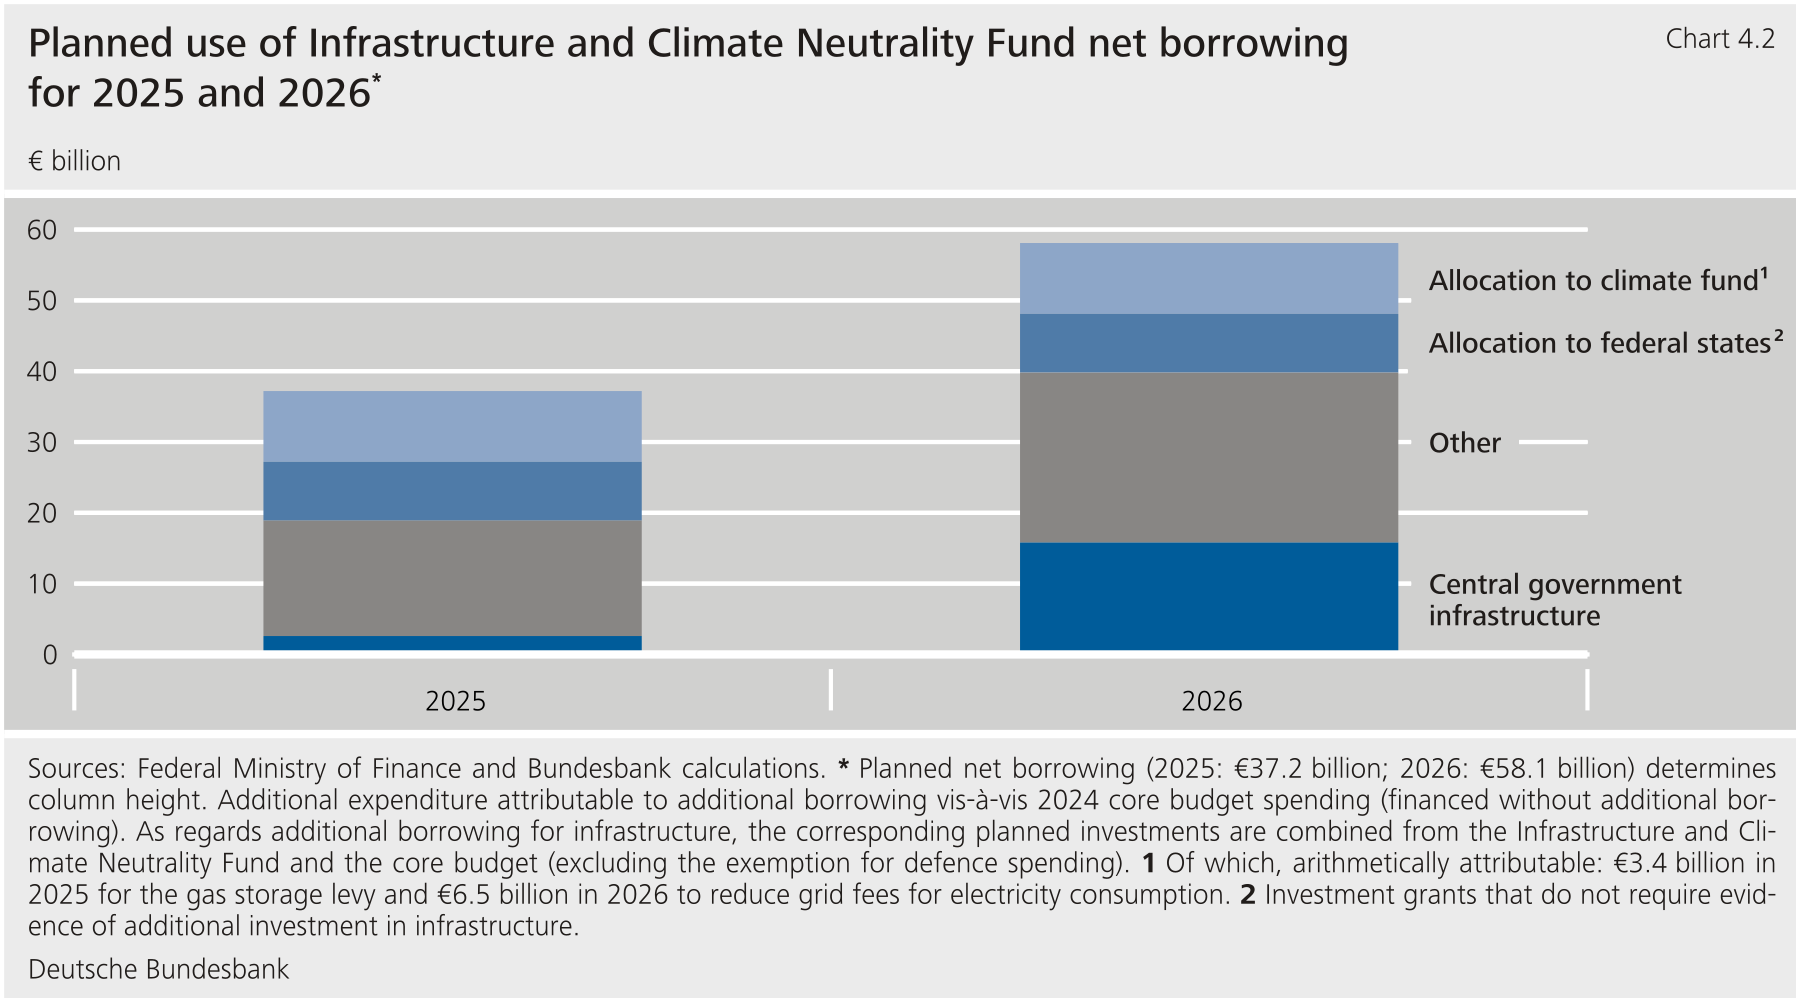
The chart below shows how central government intends to use the off-budget special fund’s net borrowing according to its plans for 2025 and 2026. 10 The breakdown is based on the Bundesbank’s understanding of additionality in respect of infrastructure-related investment as outlined above.

Planned use of Infrastructure and Climate Neutrality Fund net borrowing for 2025 and 2026

Accordingly, the additional investment expenditure described above for central government infrastructure accounts for only a small part of the special fund’s allocation of funds (under “Central government infrastructure” in Chart 4.2). In the starting year 2024, investment expenditure on central government infrastructure amounted, in the proposed definition, to €31 billion. According to plans for the central government core budget (excluding the debt-financed exemption for defence spending) and for the Infrastructure and Climate Neutrality Fund, this infrastructure expenditure is expected to be around €2½ billion higher in 2025 and €16 billion higher in 2026. 

A large part of the resources from the special fund are channelled into other central government uses (under “Other” in Chart 4.2). The corresponding amounts of €16 billion for 2025 and €24 billion for 2026 are the product of various factors relating to the special fund and the core budget:

  • The special fund is used to finance expenditure that does not affect the categories that expand or modernise central government infrastructure. For example, the off-budget special fund is budgeted for current expenditure of €2 billion each year, for purposes such as the operation of digital applications, research funding and fees for liquefied natural gas terminals. In addition, whether funds for hospitals’ immediate transformation costs (annual average of €2 billion) can be defined as investment seems unclear. 11 In the case of other investment grants for hospitals (2026: €3½ billion), there is also ultimately no link to central government’s infrastructure. In fact, the federal states would be responsible for this area. In 2026, the special fund will also finance non-infrastructure-related investment grants (mainly to private-sector enterprises) that central government had previously paid out of the Climate Fund. These include, in particular, support destined for manufacturers of microelectronics and are estimated to total €4 billion.

  • Central government has chosen a different benchmark for additionality: According to this benchmark, the specific rules require no additional expenditure compared with previous years. Investment expenditure is considered additional if it exceeds a minimum investment ratio of 10 % in the core budget. 12  However, as mentioned above, the investment ratio was already well above the minimum ratio in the starting year of 2024 at just over 11 %. This alone means that central government can outsource expenditure of €5 billion annually to the special fund and finance by borrowing there. 13

  • In the core budget, central government also includes expenditure in its investment ratio that is not related to its infrastructure (such as calls on guarantees and development aid). In the 2025 and 2026 budgets, central government is expanding the target figures for this compared with actual expenditure in 2024, meaning that these expenditure categories contribute more strongly to meeting the minimum ratio in the core budget. In return, central Government can shift infrastructure investment of this amount to the special fund; the special fund can thus borrow more than €5 billion in each year without infrastructure investment rising compared with 2024.

  • When documenting the minimum investment ratio, central government also factors in infrastructure-related investments, which it already finances by borrowing under the defence sector exemption. 14 As a result, the use of the sectoral exemption thus creates additional scope for other uses of funds in the core budget. Specifically, this creates €2 billion of scope in 2025 and €3 billion in 2026.

In addition, substantial funds flow from the Infrastructure and Climate Neutrality Fund to the federal states via investment grants. Ultimately, these are likely to only partially flow into additional investment compared with 2024 (under “Allocation to federal states” in Chart 4.2). In both 2025 and 2026, €8½ billion is earmarked for payments to state governments, which are also intended to finance local government investment. Payments are not conditional on state governments demonstrating additional investment. The federal states explicitly rejected such a commitment. As things currently stand, therefore, and in view of the considerable budget bottlenecks, especially for local governments, it seems doubtful that state and local governments would use the funds from the special fund to finance a significant amount of additional investment.

In addition, around €10 billion per year are earmarked for transfer from the special fund to the Climate Fund (under “Allocation to Climate Fund” in Chart 4.2). According to the Basic Law and the law establishing the Infrastructure and Climate Neutrality Fund (Gesetz zur Errichtung eines Sondervermögens Infrastruktur und Klimaneutralität), this money is intended to finance additional investments in climate neutrality. However, after deciding on these additional resources for the Climate Fund, central government did not go on to plan any major additional climate protection investments there. Instead, it transferred the gas storage levy of €3½ billion to the Climate Fund in 2025. In addition, it largely reduced the previously estimated saving needs in the Climate Fund plan (specifically, it reduced the global spending cut that covered a financing gap). For 2026, it decided to subsidise electricity grid charges to the tune of €6½ billion. Apart from such current transfers, it also provides investment grants from the fund to third parties (which, as outlined above, were partly relocated to the Infrastructure and Climate Neutrality Fund in 2026). By contrast, expenditure to strengthen central government infrastructure is not included in the Climate Fund.

Against this backdrop, the Bundesbank is expecting a marked increase in general government non-military investment. However, this additional investment is significantly below the borrowing of the Infrastructure and Climate Neutrality Fund. The Bundesbank has produced a forecast in line with the national accounts schema (for more details on the demarcations used there and how it differs from the budgetary definition, see in-depth analysis 1). According to the current forecast, general government non-military investment as a percentage of GDP in the forecast-end year of 2028 is ½ percentage point higher than in 2024. Growth in this infrastructure-related national accounts category over the forecast thus reaches less than half of the expected borrowing of the off-budget special fund over the same period of time. 15

As a result, the Bundesbank recommends that the rules for the use of the special fund be modified in order to channel the additional borrowing towards higher infrastructure investment in a more targeted manner in future. 16 In concrete terms, this means the following:

  • We recommend that the off-budget special fund primarily provides funds to finance additional infrastructure-related investments compared with 2024. Expenditure in the definition for infrastructure investment explained above in relation to GDP is suitable for assessing additionality. This should exclude investment that is already financed from other sources of credit (in particular under the exemption for defence spending). This definition is easy to understand and is relatively likely to ensure that investment in government infrastructure actually increases. Such a definition can be applied to the federal states in order to ensure additionality to the use of the investment grants paid to them. This is generally recommended as it ties these funds, too, to the improvement of infrastructure. 17  

  • Furthermore, additionality should need to be demonstrated not only during budget planning but also at budget outturn. This recommendation applies to the current rules too (irrespective of whether the aforementioned proposals are implemented). At times, it can be difficult to plan investment spending. This is because the necessary approvals and contract awards sometimes take longer to obtain or ongoing projects take longer to complete than expected. In the past, this was reflected in the fact that actual investment spending often fell well below budget estimates. If additionality is only verified during budget planning and not checked again at budget outturn, this means that borrowing scope not required for investment may be used elsewhere. This creates an incentive to make particularly generous investment estimates in the budget, or to postpone projects during budget implementation in order to finance other measures. 18

Individual parameters of these proposals may, of course, vary without fundamentally changing the suggested framework. In general, however, it should be borne in mind that if the definition of investment is somewhat broad or vague, or if the benchmark is towards the lower end of the scale, borrowing by the special fund will probably more frequently finance expenditure that does not go towards improving government infrastructure. In view of this, consideration could be given to incorporating additional expenditure categories into the investment spending to be taken into account, or to further refining these. However, adopting a more complicated approach might risk reducing transparency and traceability. In any event, the link to infrastructure would need to be established and ensured in line with a modified definition. With regard to the comparison year, multiple past years could be used (2022 to 2024, for example), rather than just the year 2024. As investment was lower in previous years, the scope for borrowing for non-investment expenditure would thus be reinforced, with infrastructure bolstered to a lesser degree. 

Looking at the point in time at which new rules enter into force, a transitional arrangement could, in principle, also be considered to prevent the new approach from being interpreted as an abrupt pivot. A transitional arrangement could provide for a gradual convergence to the more ambitious requirements of the proposal over the coming years. 

3.1.4 Targeted and efficient investment

When it comes to infrastructural improvements, it is not solely the deployed funds discussed above that matter. Ultimately, it is the results achieved by this expenditure that are important. In this respect, it is encouraging that the Act Establishing the Special Fund for Infrastructure and Climate Neutrality provides for various efficiency reviews for debt-financed measures. It appears that there are plans to expand the standard economic feasibility studies, particularly with regard to the effects of growth. However, the Federal Government has not yet provided any information on how this will be implemented. 

In order to be able to quantify the results of the new projects, the government is required to operationalise the objectives of the special funds. Effective projects could be identified on this basis. 

Furthermore, it is important to keep a close eye on costs. Carrying out numerous additional projects in a cost-effective manner presents a challenge. In the past, it was clear that increased sums of investment in the transport sector were, in some cases, accompanied by considerable price mark-ups. 19 In order to ensure the cost-effectiveness of the use of funds, government authorities could, for example, publish construction figures that are also suited for comparable projects. Conceivable examples could be the cost of a newly constructed kilometre of traffic lane, or a fully renovated kilometre of railway track. This information could be used to identify best practices and create an incentive to align with them. 

Accelerating the contract awarding and approval processes and increasing the digitalisation of public administration also seems crucial. Accelerated processes are important if the investment gap is to be closed swiftly. This, too, is the aim of several projects launched by central and state governments last year.

3.2 Reform the debt brake to prioritise investment in a lasting and effective manner

Higher investment expenditure can be stabilised over the coming years via the Infrastructure and Climate Neutrality Fund. In addition, follow-up provisions could be adopted in a timely manner for further stabilisation. The EU fiscal rules with their ceilings for annual expenditure growth suggest that use of resources from the special fund should be uniform in terms of GDP. Furthermore, the private sector will then be able to better align its capacities with the provisions. The prospect of follow-up provisions is likely to help keep price increases caused by scarce capacity in check. Overall, government investment expenditure, which is rising fairly steadily along with GDP, should run less risk of being dissipated by price increases.

The Bundesbank recommends incorporating the follow-up provisions for investment borrowing scope into a fundamental reform of the debt brake. 20 Permanent, steady scope for additional investment borrowing following the expiry of the special fund, the reduction of the general government deficit in a transitional phase and a tightening of the permanent borrowing limit going forward should come together. On the back of these components, the Bundesbank’s broader proposal would safeguard sound public finances and limit conflicts with the European fiscal rules. Here, an overall package is key: if scope for investment borrowing were instead to be extended in isolation and added to the existing sectoral exemption for defence spending, the stability risks to public finances would increase.

The recommended follow-up provisions to the Infrastructure and Climate Neutrality Fund as part of a fundamental debt brake reform will help to stabilise investment in government infrastructure at an elevated level over the long term. The follow-up provisions would take effect in the third stage of the proposed debt brake reform from 2036 onwards and provide for a permanent scope for borrowing for additional investment amounting to 0.8 % of GDP. Assuming a relatively uniform outflow of funds from the special fund, a similar volume of remaining funds is likely to flow out from this fund in the preceding year, 2035. For the follow-up provisions, it is just as important as for the special fund that access to this borrowing scope is precisely tailored. The proposal for the debt brake reform is therefore heavily based on the recommendations for the special fund.  

  • Investment and additionality are defined as described for the special fund. Additionality is defined in relation to the 2024 investment ratio or in comparable terms (see Chapter 3.1.3). Thus, only this kind of additional investment expenditure may be financed using the special scope for borrowing. This will better protect infrastructure-related investment from being cut in favour of other expenditure in the event of scarce budgetary resources. However, this does not mean that the scope for borrowing must always be used up: if the infrastructure is in good condition and further investment does not appear necessary, the scope for borrowing should not be used. In this way, future budgets would benefit from correspondingly lower interest burdens (owing to lower debt). It would be worth considering setting up a reserve for unused scope for investment borrowing. When designing the reserve, it would then have to be ensured that it is compatible with the aim of using this scope for additional investment only. 21  

  • As in the case of the special fund, the actual figures should be used to prove the intended use of resources. This is important, as it ensures that investment-related borrowing is not channelled towards other uses (see Chapter 3.1.3). 

Annex: In-depth information on selected aspects of government investment

1 In-depth analysis 1: How government investment and government capital stock are recorded in the statistics

There are different methods of recording government investment expenditure in the statistics: first, in line with the national accounts, which are geared towards economic principles, and second, according to the cash-based government finance statistics, which use the government budget planning system.

1.1 Investment as defined in the national accounts

The national accounts are well suited for economic analysis. The definition of investment in the national accounts is based on government fixed assets. Government investment in the national accounts is thus largely linked to infrastructure. Restrictions in this area mainly concern intangible fixed assets – in connection with research activities, for example – and weapon systems.

The national accounts provide a consistent database over time and in an international comparison on the basis of economic principles. The methodological basis of the national accounts is reviewed regularly and the data are revised consistently (i.e. also retroactively) as necessary. 22 The national accounts statistics are also important because they provide the groundwork for European fiscal surveillance. In addition to the European institutions, the IMF and the OECD also base their public finances statistics on national accounts data, in methodological terms. For international comparisons, the government investment ratio is mostly calculated as gross fixed capital formation in relation to GDP at current prices. 

Government gross fixed capital formation reflects the acquisition (expenditure) less the sale of (revenue from) durable fixed assets. Durable fixed assets include buildings and structures, machinery and equipment, and intellectual property. 23 The national accounts allocate the investments to the period during which construction or delivery takes place – and not the time at which payment is made. In simplified terms, investment is considered to be governmental if the government sector bears the relevant risks of such investment. 

The national accounts’ net fixed capital formation is gross fixed capital formation less write-downs on the stock of fixed assets. It indicates investments above and beyond the replacement of (imputed) depleted capital. In this context, total fixed assets (excluding land), including intellectual property, are generally written down at constant annual rates. Typical service lives lasting different lengths of time are incorporated for different types of goods. These are significantly longer for buildings than for machinery and equipment and for created intellectual property. The starting point for the level of write-downs is the replacement value of the assets in the period under review. 

1.2 Investment as defined in the government finance statistics

Government investment expenditure in the government finance statistics is derived from payment flows in government budgets that have an effect on the cash balance. Central and state governments record investment expenditure in their budget plans and report budget outcomes for the cash statistics and accounting figures published by the Federal Statistical Office. The data are based on the common budget system for central and state governments (classification scheme for government budgets based on Section 10 of the German Budgetary Principles Act (Haushaltsgrundsätzegesetz)). 24  

Investment based on government finance statistics serves as, inter alia, a reference point for budgetary rules, such as for the investment-oriented scope for borrowing discussed in Chapter 3It is compatible with the approaches used in budget planning and is also relatively manageable during budget implementation. 

The definition of investment is broader in the government finance statistics than in the national accounts. First, investment spending recorded in the budget includes fixed asset formation. Construction work and the purchase of movable and immovable property count towards this. Second, it includes investment in financial assets, i.e. financial investment (expenditure on loans and the acquisition of equity). Third, it includes investment grants to other general government budgets and investment grants to enterprises or institutions outside the general government sector. 25  

The government finance statistics data are the most important basis for determining government expenditure and revenue in the national accounts. The relevant government finance statistics are included in the national accounts insofar as they are relevant for these. At the current end, the general government budget in the government finance statistics (core budgets and off-budget entities) and the government sector in the national accounts are virtually identical. Because the government finance statistics, unlike the national accounts, are not revised retroactively, the sectoral definitions used in the past do not match (for example, with regard to the classification of Deutsche Bahn). 

1.3 Overview of major differences between investment recorded in the national accounts and in the government finance statistics

Investment is reported differently in the government finance statistics and the national accounts. Table 4.1 gives an overview of conceptual differences. Table 4.2 compares the results for 2024 according to the two sets of statistics.

Table 4.1: Investment in the statistics: major differences between the national accounts and the government finance statistics

Category

National accounts

Government finance statistics

Military procurement, intellectual property (R&D)

Investments

Other operating expenditure, personnel expenditure

Investment grants to third parties

Transfers

Investments

Financial transactions (financial assets: loans, equity)

Only non-financial transactions are considered

Both financial and non-financial transactions are considered as investments

Revenue from sales of tangible assets

Deducted from investment expenditure (balanced)

Shown separately under revenue

Investments from public private partnerships (PPP) and energy performance contracts (EPC)

Counted towards general government investment

Dependent on budgetary estimate (PPP investments mostly lead to non-investment expenditure, such as usage fees)

Reclassification of entities to/from general government sector

Revisions also retroactive (provided that requirements were fulfilled in previous years) 

No retroactive revisions 

Point in time when investment is recorded

Construction investment: according to construction progress;
Military equipment: upon delivery 

Cash basis accounting, i.e. when outgoing payments are made; own management funds recorded in advance

Write-downs on investment

Gross investment and write-downs recorded as part of government consumption; net investment (investment less write-downs) reported

Not considered, as no payment flows

On balance, government investment for 2024 is almost one-half higher in the government finance statistics than in the national accounts.

While investment as defined for the purposes of the government finance statistics stood at €192 billion (see Table 4.2a), gross fixed capital formation amounted to €132 billion in the national accounts (see Table 4.2b). Investment as displayed in the government finance statistics is primarily higher because it includes financial transactions and investment grants to third parties. In addition, the national accounts deduct revenue from the sale of non-financial assets on the expenditure side. Conversely, in the national accounts, military procurement and the acquisition of intellectual property are included in investment. Comparing only fixed asset formation in the government finance statistics (€107 billion) against tangible fixed assets in the national accounts (€104 billion), there is a stronger agreement between the two.

The Bundesbank recommends a pragmatic definition of investment that is as infrastructure-related as possible in order to channel expanded scope for borrowing into additional infrastructure investment in a more targeted manner (see Chapter 3). In the following, the central government definition is presented in more detail and compared with the definitions used in the government finance statistics and national accounts. 

For central government, the proposed definition of investment comprises the following government finance statistics items from the central government budget and central government’s loan-financed entities (such as the Infrastructure and Climate Neutrality Fund as from 2025):

  • fixed asset formation (in Table 4.2a: government finance statistics, main category 7 and groups 81 and 82);

  • investment grants to public enterprises and institutions (classifications 891 and 894 according to central government budget figures). These grants are aimed at fixed asset formation in entities that are outsourced from the core budget but are functionally part of the general government sector (such as the infrastructure division of Deutsche Bahn or Autobahn GmbH). This means that for these entities, their additional investment is not recorded, but rather the investment grants financed from the special fund or the core budget. 

For state and local governments, simplified approaches are more suitable: a definition focusing on fixed asset formation in the sense of the government finance statistics for the core budgets and off-budget entities taken together would be quite close to the central government definition. 26  

In future, the extent to which central government’s infrastructure-related investment has risen on balance can be roughly determined ex post using the results for the category of fixed asset formation in the government finance statistics (see Table 4.2a, item (1a)). According to the government finance statistics, general government’s fixed asset formation stood at €107 billion, or 2.5 % of GDP, in the starting year of 2024. 27 Provided that the fixed asset formation ratio rises in relation to this, government investment in the area of infrastructure can be judged to have risen.

In the national accounts, non-military investment in tangible assets would, in principle, be a suitable category for capturing developments in infrastructure-related investment. In view of this, it would be preferable for the national accounts to record separate statistics for this category in future. 28  As the national accounts record investment in line with completion, the link to cash-based payment flows is less direct than in the figures from the government finance statistics. That aside, however, developments in payment flows and investment recorded in the national accounts should be similar. Irrespective of the issue being discussed here, it would also be desirable, for the purposes of macroeconomic analysis, for the national accounts to provide figures on investment in tangible assets split into military and non-military investment. This is because military investment is set to gain significantly in importance going forward and will have a considerable impact on developments in government investment expenditure.

Table 4.2a: Government investment in the government finance statistics in 2024
General government, core budget and off-budget entities
€ mn

(1) Investment expenditure

192,304

(1a) Fixed asset formation

107,275

Construction work (main category 7)

63,858

Purchase of movable property (group 81)

25,738

Purchase of immovable property (group 82)

17,680

(1b) Financial investment (financial transactions)

32,515

Loans to the public sector (group 85)

Loans to other sectors (group 86)

4,706

Equity acquisitions (group 83)

27,809

(1c) Capital transfers

52,515

Calls on guarantees (group 87)

2,138

Investment grants to the public sector (group 88)

Investment grants to other sectors (group 89)

50,377

(2) Other expenditure

31,580

Other operating expenditure


Military procurement (group 55)1

31,580

(3) Revenue

65,628

(3a) Sale of tangible assets2

23,988

(3b) Financial transactions

33,681

Sale of equity investments, capital repayments (classifications 133, 134)

16,164

Loan repayments from the public sector (group 17)

Loan repayments from other sectors (group 18)

17,517

(3c) Capital transfers

7,959

Revenue from calls on guarantees (group 14)

746

Investment grants from the public sector (group 33)

Investment grants from other sectors (group 34)

7,213

Sources: Quarterly cash statistics for the general government budget (excluding "fifth quarter" reporting). 1 Main category/group as per the classification scheme for government budgets. The classification refers to central and state governments. For other government entities (local governments, commercial off-budget entities, social security funds), analogous values are derived from the respective accounting systems. 2 For the most part, military procurement in the government finance statistics is not recorded under investment in machinery and equipment in the national accounts. 3 This reflects, to a very large extent, revenue from emission allowances.

Table 4.2b: Government investment in the national accounts in 2024
General government, core budget and off-budget entities
€ mn

(1) Gross fixed capital formation

132,292

(1a) Tangible fixed assets

104,258

Buildings and structures

77,660

New constructions

74,777

Purchases less sales of pre-owned constructions

2,883

Machinery and equipment (including military weapon systems)

26,598

(1b) Other assets

28,034

Intellectual property

28,034

Cultivated biological resources

(2) Other


(2a) Changes in inventories and acquisition less disposals of valuables

− 969

(2b) Investment grants, payable

68,192

(2c) Investment grants, receivable

3,254

(3) Gross capital formation (1)+(2a)

131,323

(4) Consumption of fixed capital

120,584

(5) Net fixed capital formation (1)-(4)

11,708

(6) Net capital formation (5)+(2a)

10,739

Sources: Statistical Report, national accounts; Statistical Report, investment in the national accounts.

1.5 The government capital stock in the national accounts

The government capital stock is the value of government non-financial assets. It is formed by gross fixed capital formation, valued at current prices and reduced by disposals and write-downs.

In simplified terms, capital stock is often defined as gross fixed assets recorded in the national accounts at replacement prices (the government finance statistics do not refer to capital stock). Gross fixed assets are the stock of (previously produced) assets that can be used for more than one year. It is calculated using the perpetual inventory method: invested gross fixed assets are recorded and subsequently derecognised at the end of their average useful life (i.e. that of the individual categories of fixed assets). 29 In principle, in the gross concept, fixed assets in the asset stock retain their current new value as far as they can still be used (i.e. at replacement prices with no impairment). 30 Gross fixed assets at replacement prices thus correspond to the acquisition value of the capital stock that would still be usable if it were to be repurchased in full in the respective reporting year. Change in this metric is due to acquisitions and disposals of fixed assets (gross fixed capital formation minus derecognition of retired assets plus the balance from sector changes in the reporting year). In addition, changes in replacement prices are taken into account (balance of holding gains and losses).

In the case of net fixed assets at replacement prices, by contrast, gross fixed capital formation is recorded and then depreciated evenly over the useful life of the assets (calculated loss in value). Net fixed assets thus represent fair value. In this context, a linear depreciation is assumed (constant annual rates). 31 The change in net fixed assets is calculated as the prior-year figure less new write-downs and early disposals, plus new acquisitions (gross fixed capital formation) and the balance from sector changes in the reporting year. In addition, there is the balance of holding gains and losses relative to the remaining residual value. 

The degree of the government capital stock’s modernity is derived from the ratio of the net capital stock to the gross capital stock. 32 In principle, this metric shows the share of gross capital stock that has not yet been written off. At the time an investment is made, the gross and net fixed assets to be allocated are equal. Subsequently, the corresponding net fixed assets decline in a linear relation to typical useful life, while the corresponding gross fixed assets do not decrease until their modelled derecognition at the end of their typical useful life. In principle, a low degree of modernity indicates that a high share of the capital stock has already been used for a long time, or is “old”. However, no conclusions can be drawn with regard to the extent to which usability is restricted as a result, or what value would be appropriate. 

2 In-depth analysis 2: How investment and capital stock in Germany have developed since reunification

2.1 Gross investment over time by government level and government function
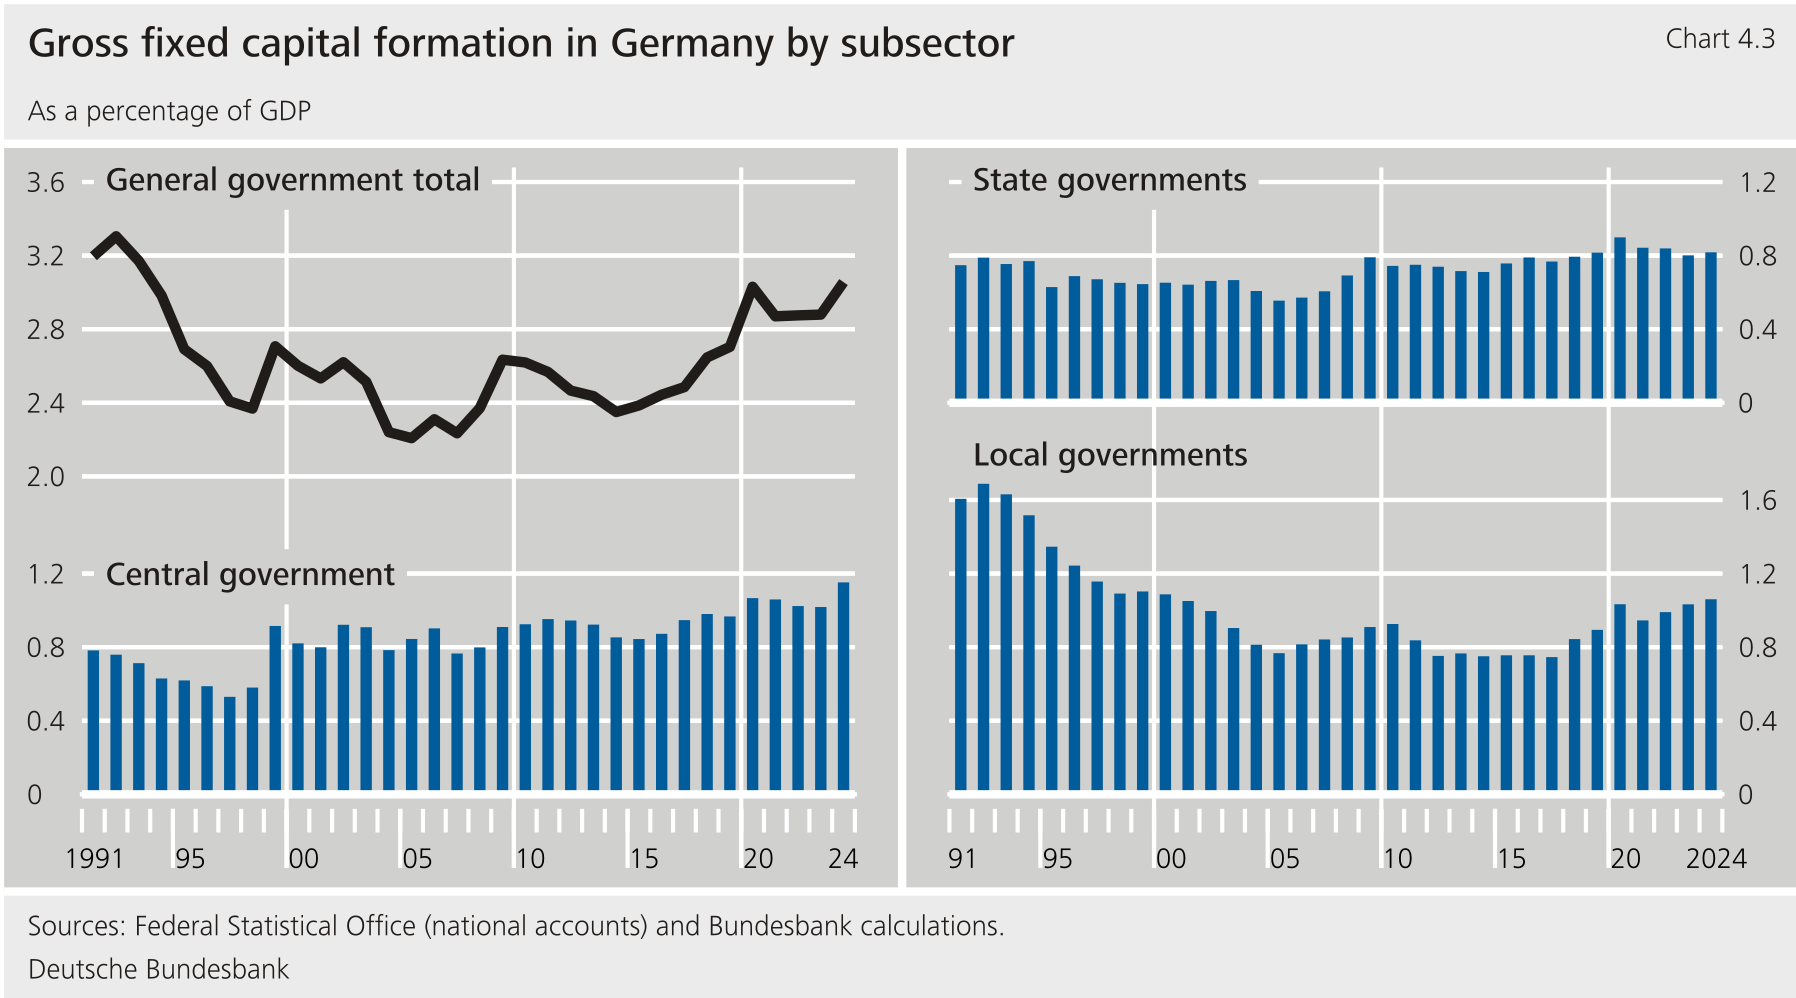
The government investment ratio (national accounts) has been rising again in Germany for a number of years, having been at a lower level for an extended period of time following the post-reunification peak (see Chart 4.3 below). National accounts data are available in the current definition for the period since reunification. In 1992, the investment ratio reached its highest level, at 3.3 % of GDP. Thereafter, by the mid-2000s, it had fallen to 2.2 %. Over the past six years, it has returned to around 3 % (2025: 3.2 %). 33 However, it should be borne in mind that the ratio is higher from 1999 onwards, as the infrastructure division of Deutsche Bahn was assigned to the general government sector following the railway reform at that time (investment volume of around ¼ % of GDP). 34 Three-fifths of investment in recent years was attributable to buildings and structures, while the rest consisted of investment in machinery and equipment and investment in intellectual property in roughly equal parts. 

The significant decline in the investment ratio in the meantime was mainly attributable to the local government level. Local government investment concerns, in particular, the construction of local transport routes and school and administrative buildings, as well as recreational and cultural facilities. At the beginning of the 1990s, the local government level still accounted for one-half of all government investment. However, its investment ratio declined steadily after the short peak of government investment in the new federal states (1992: 1.7 % of GDP), and had halved by 2005. The tight financial situation of many local governments probably also played a role: after reunification, their social spending rose far more steeply than their revenue. The strain on local government finances was also reflected in a surge in local government cash advances in some federal states. 35 Furthermore, however, the decline in the investment ratio was also due to major spin-offs: entities previously recorded in the general government sector and their investment were reallocated to the private sector (public corporate sector). 36 This was particularly the case in the areas of waste management, wastewater management and water supply. The local government investment ratio has risen again somewhat, reaching 1 % in recent years. 

The state governments’ investment ratio has been fairly stable overall. The state governments make significant investments in intellectual property because investment in basic and applied research at the state universities falls to them. Somewhat less extensive is the funding of construction activity, which concerns not only state roads but also universities and administrative, police and court buildings. The state government investment ratio has been fairly stable, coming in at just under 1 %.

Central government’s investment ratio has trended upwards, also because railway infrastructure was reallocated to the general government sector in 1999. Central government has been investing primarily in Germany’s federal rail and road infrastructure, the federal administration and the defence sector. In the case of central government, too, the investment ratio initially declined after the post-reunification high. In 1999, it then increased markedly once more, mainly because the infrastructure division of Deutsche Bahn has been part of the government sector since the railway reform of that year. Most recently, the ratio rose to over 1 %, not least due to higher construction investment in, for example, railways and motorways. 

At present, government investment is spread to a similar extent across central and local government and to a somewhat lesser extent across state governments. This means that shares have shifted away from local governments and, above all, towards central government over time; this is irrespective of the railway reform.

Gross fixed capital formation in Germany by subsector

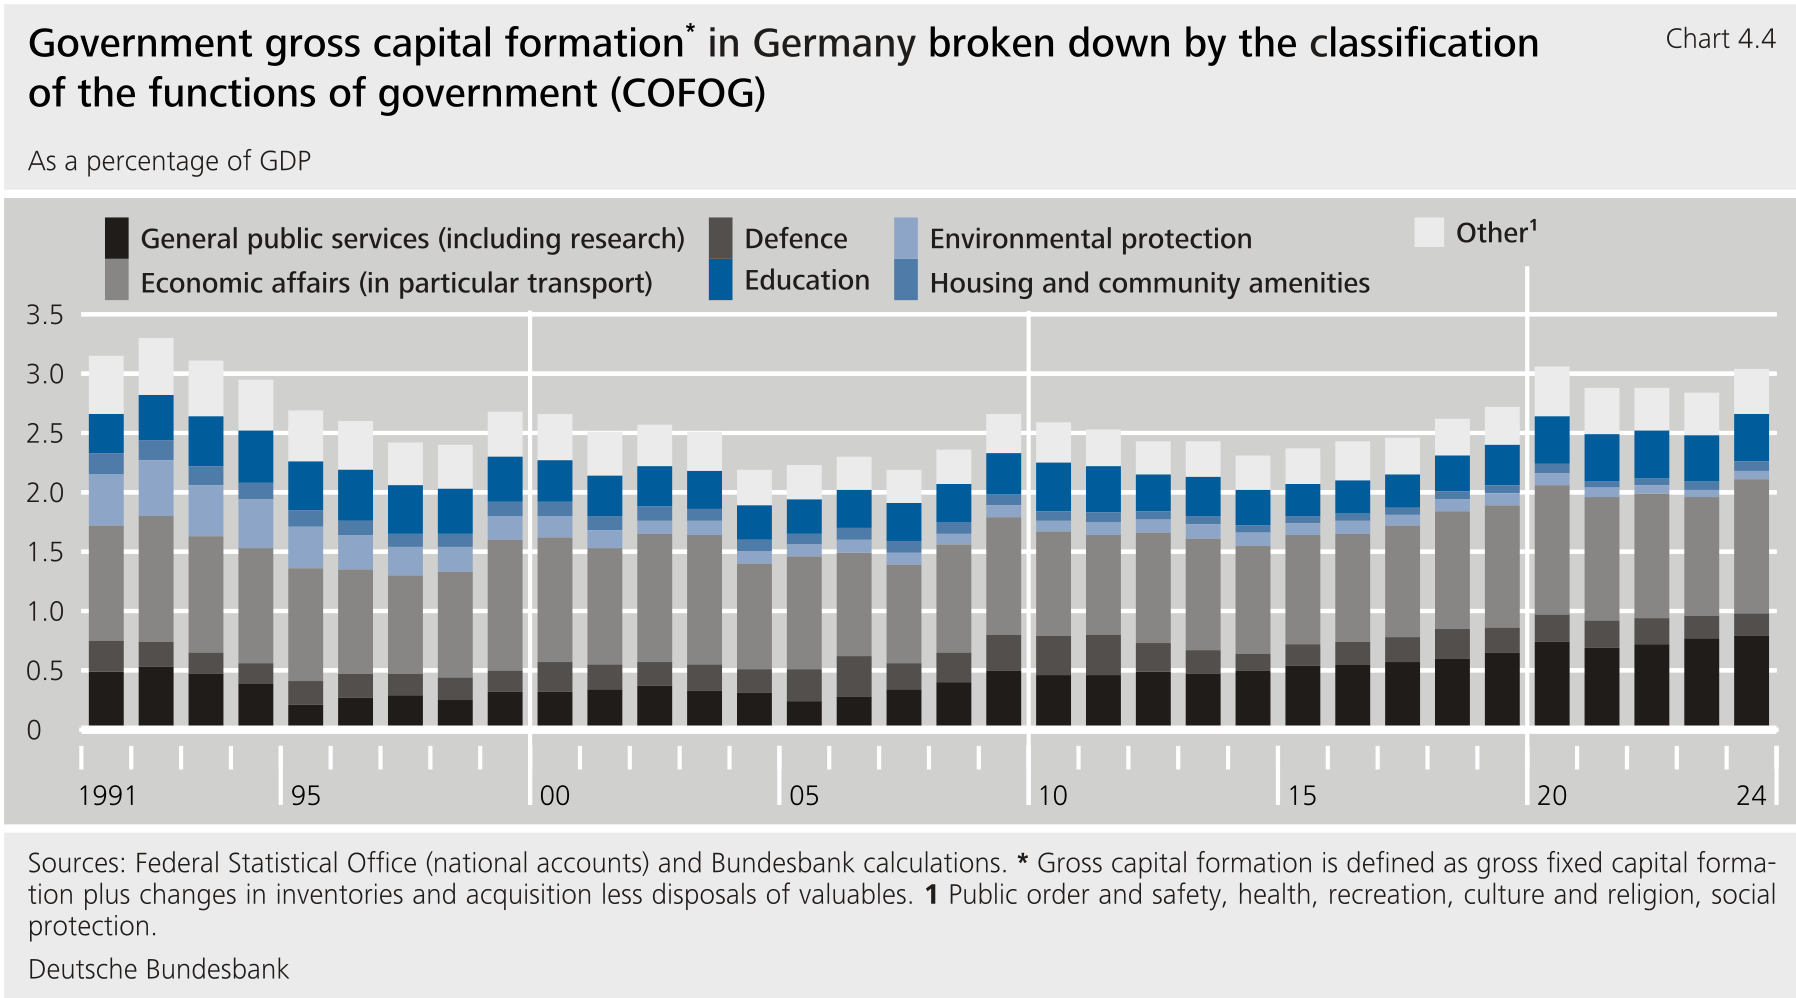
In terms of the various investment sectors, the bulk of investment was attributable to transport, administration (including research) and education. General government gross capital formation 37 can be broken down by government functions (COFOG). According to this breakdown, the largest share is attributable to economic affairs (at 1.1 % of GDP in 2024). Expenditure in this area is mainly channelled to transport. General public services (including basic research) accounted for one-quarter of general government investment (0.8 % of GDP) in 2024. Its share has risen since the mid-2000s because, amongst other things, investment in basic research has increased significantly. The investment ratio in the education domain mainly comprises the construction of schools and universities, standing at 0.4 %. Investment in defence (especially purchases of weapons systems) accounted for only a small share of government investment. It has fluctuated only slightly over time, most recently amounting to 0.2 % of GDP. 

Government gross capital formation* in Germany broken down by the classification of the functions of government (COFOG)

The level of government investment in the areas of environmental protection, housing and health is low in Germany, as most of the investment in these areas comes from the private sector.

  • Environmental protection and housing predominantly fall under the private sector, in part as a result of past spin-offs. The main fee-funded amenities financed out of local government core budgets to be spun off concern municipal waste and wastewater management (environmental protection) and water supply (housing and community amenities). They are likely to be a major reason for the sharp decline in the investment ratio for environmental protection up to the early 2000s: the ratio was as high as 0.5 % of GDP in 1992 and has stood at around 0.1 % of GDP since 2002. 

  • The very low figure for health is due to the fact that general hospitals and university hospitals in Germany usually belong to the private sector. This is because their main source of funding takes the form of service fees at usual market prices. 38 Government investment grants in the healthcare sector are therefore largely not recorded as government investment in the national accounts. Such investment grants are actually supposed to be financed by the state governments, which are responsible for this task in the German federal system. However, central government is contributing to the Hospital Transformation Fund with grants to the state governments out of the Infrastructure and Climate Neutrality Fund. Together with further resources from central government’s fund share, €6 billion (just over 0.1 % of GDP) from the Infrastructure and Climate Neutrality Fund is earmarked for hospitals in 2026.   

Starting this year, the investment ratio will rise significantly due, first, to the loosening of the debt brake for defence spending and, second, to the Infrastructure and Climate Neutrality Fund. The Federal Government plans to substantially increase defence spending, raising it by 1¼ % of GDP by 2029. Much of the increase is probably attributable to the procurement of weapons systems and thus to machinery and equipment investment. Resources from the Infrastructure and Climate Neutrality Fund are likely to boost investment in transport, administration and education, at least in large part. According to the Bundesbank’s current forecast, government gross fixed capital formation will rise from 3.1 % of GDP in 2024 to around 4½ % of GDP in 2028. However, future investment growth is difficult to estimate with any degree of certainty, be it for military or non-military purposes. 

2.2 Net investment over time

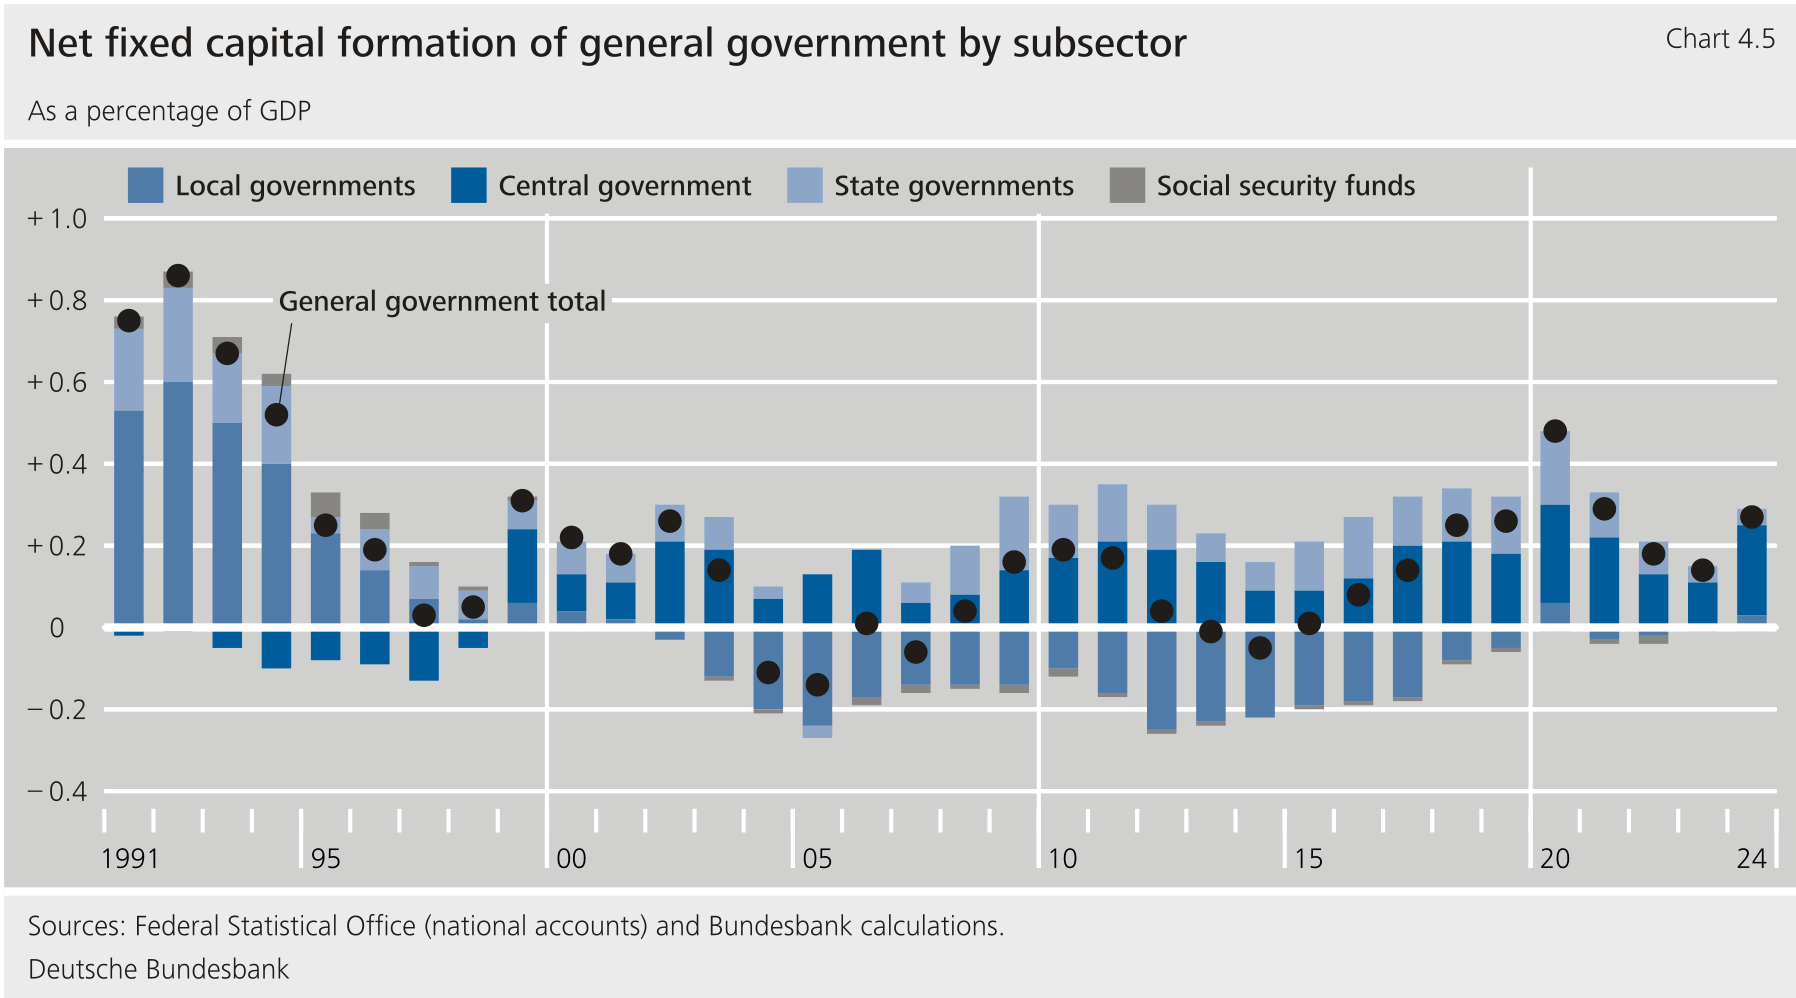
Changes in the government net investment ratio 39 also reflect the aforementioned underlying trends. It was at times negative in the 2000s. It has been back in slightly positive territory for ten years. Like the gross ratio, the net ratio was relatively high following Germany’s reunification (0.9 % in 1992). Net construction investment, in particular, fell sharply thereafter. In recent years, the net investment ratio has stood at around 0.2 % of GDP. 

Local governments are the key factor driving the fall in the net investment ratio, too. While local governments were still racking up comparatively high positive net investment ratios in the early 1990s, these have been almost consistently negative since 2002. The ratio has stabilised at close to zero over the past few years. By contrast, net investment by state governments is predominantly positive, though it has declined in recent years. Following reunification, central government initially recorded negative ratios. Since 1999, central government’s positive net investment ratio has tended to be higher than the equivalent local and state government ratios. The sharp increase in 1999 is likely to relate to rail infrastructure being assigned to the general government sector. 

Net fixed capital formation of general government by subsector

Looking ahead, significantly higher net investment is also expected. According to the Bundesbank’s current forecast, government net investment will rise from 0.3 % of GDP in 2024 to over 1 % of GDP in 2028. However, a higher gross investment ratio and the gross capital stock increase that comes with it will then also mean larger write-downs over time. In other words, if general government stabilises the gross investment ratio at a higher level in the future, the larger write-downs will subsequently lower the net investment ratio again (for a stylised relationship between gross investment, net investment and capital stock, see the supplementary information entitled “What determines the development of the capital stock – influencing factors and stylised scenario calculation”).

2.3 Capital stock developments

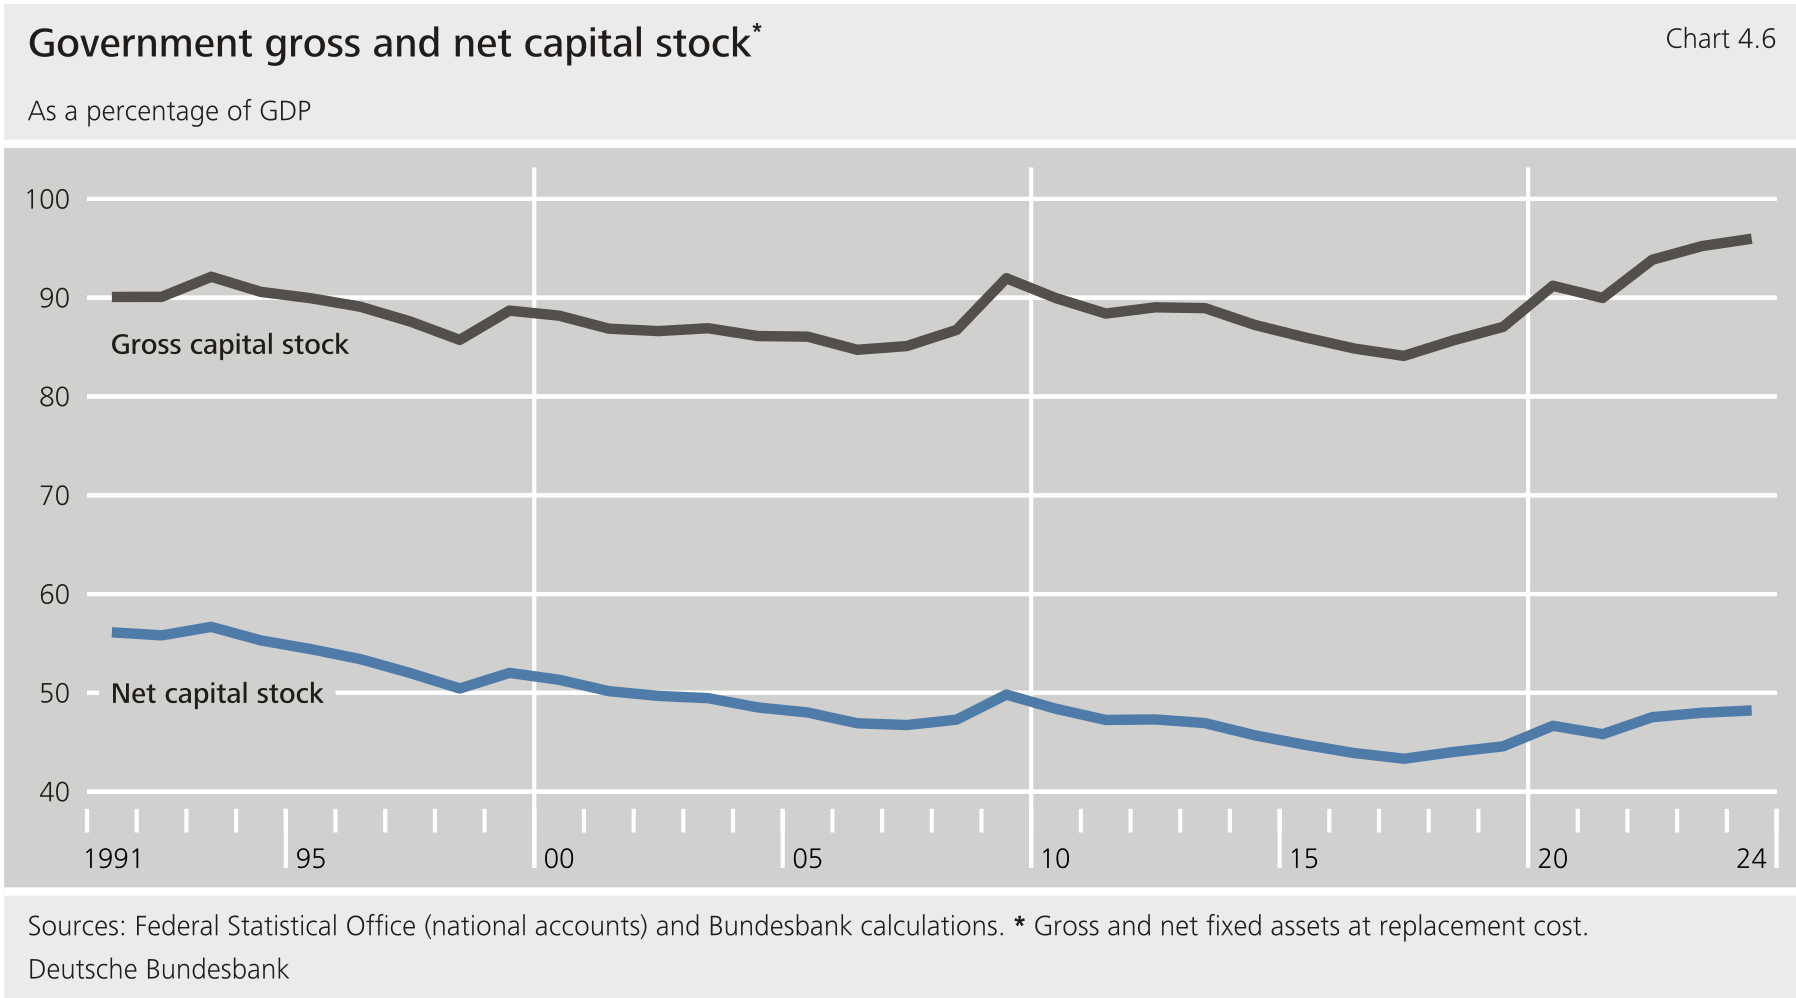
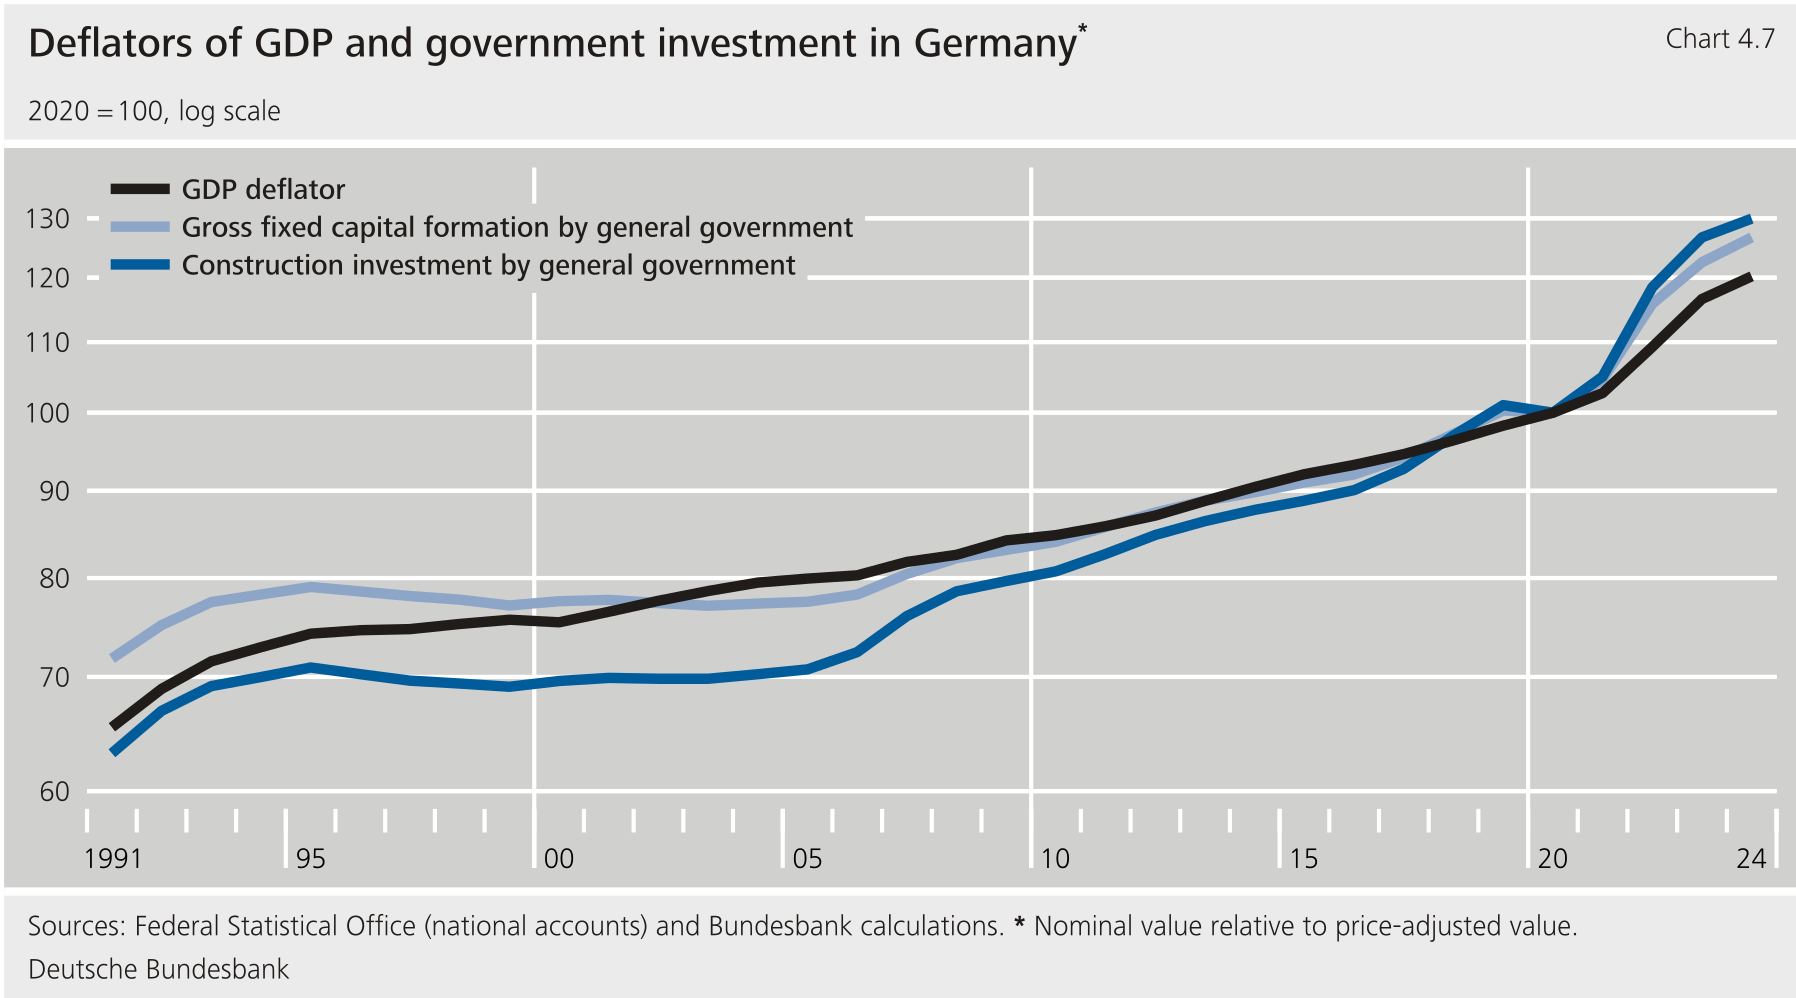
Looking back over the longer term, government gross capital stock 40 has been relatively stable in relation to GDP. It has risen more sharply in the past few years, reaching 96 % in 2024. 41 However, it should be borne in mind that price changes (deflators) for GDP and capital stock diverged considerably at times. While price changes were stronger until the mid-2000s according to the GDP deflator, the opposite has been true since then. Adjusting for price changes, the increase in gross capital stock has all but disappeared since 2018 (and price-adjusted gross capital stock was higher than unadjusted gross capital stock before 2018). 

Government gross and net capital stock

Deflators of GDP and government investment in Germany

Local governments currently account for almost one-half of government gross capital stock. As a result of spin-offs from the general government sector, lower investment activity and relatively stable replacement costs, local government gross capital stock decreased from around 50 % of GDP in the 1990s to 42 % at the end of the 2010s. Since then, however, it has rebounded to 46 %. By contrast, central government gross capital stock was higher than in the 1990s (2024: 29 %). This is probably related partly to rail infrastructure being assigned to the general government sector in 1999 and partly to increased investment and replacement cost movements in recent years. The latter is also likely to be the main reason why state government capital stock as a percentage of GDP has risen in recent years (2024: 19 %).

Government gross capital stock primarily comprises buildings and structures. Their useful life is much longer than that of machinery and equipment or intellectual property (depreciation rates are lower). As a percentage of GDP, the value of buildings and structures stood at 82 % at the end of the period covered here. Just over half of this was attributable to civil engineering works (2024: 43 % of GDP). These include, in particular, transport infrastructure with the road and rail network, including bridges and tunnels. Federal motorways account for just over one-quarter of the capital stock of roads (6 % of GDP). The remaining buildings and structures consist of structural engineering works (37 % of GDP) such as school, university and administrative buildings and, to a very small extent, residential buildings (1 % of GDP). The percentage of GDP for structural engineering works, in particular, surged recently, largely as a result of higher construction prices. This increase should therefore be interpreted with caution, because higher construction prices do not imply a more efficient infrastructure. The gross capital stock of machinery and equipment equates to 8 % of GDP. This includes, for example, weapons systems, machinery and vehicles. Intellectual property represents 6 % of GDP. Examples of this are computer software and databases (either acquired or self-developed) as well as basic research findings. 42 This category is also receiving a lot of attention in today’s increasingly knowledge-based economy. However, the typical useful life of intellectual property is relatively short, meaning that higher expenditure is reflected to a lesser extent in gross capital stock over the long term. 

Unlike the gross capital stock ratio, the government net capital stock ratio fell markedly over more the half of the last decade. Net capital stock takes into account the fair value of fixed assets. It contracted from 56 % of GDP after reunification to around 43 % of GDP in 2017. This was due to both low net investment and relatively low increases in prices of buildings and structures. An upward trend in the ratio can be observed from 2020 onwards (2024: 48 %). However, this was largely due to the aforementioned price effects (the prices of government buildings and structures were rising more quickly than the GDP deflator). 

The progressive decline in the modernity of the capital stock indicates that the capital stock has aged over time. However, an aggregate indicator such as the ratio of net to gross capital stock (see above) provides, at best, an idea of where there is room for improvement. Whether and where this exists has to be assessed on a case-by-case basis. This is because some capital goods continue to function sufficiently despite their advanced age. For example, even roads with old foundations can still be largely adequate provided the surface is in good condition.

Supplementary information

What determines the development of the capital stock – influencing factors and stylised scenario calculation

The development of the (government) capital stock depends on several factors, shown in simplified form in the following supplementary information. 

  • The gross capital stock is the capital stock of the previous year plus gross capital formation minus disposals. In simplified terms, disposals are modelled in the following as the average annual rate (derived from the useful life, which in turn determines the write-down rate). 1

  • The net capital stock is the net capital stock of the previous year plus gross capital formation minus write-downs. Write-downs are derived from the average rate on the gross capital stock of the previous year.

  • Net capital formation is calculated by deducting write-downs from gross capital formation. If gross capital formation sees a lasting rise compared with its initial value, net capital formation will initially increase on broadly the same scale. However, as time progresses and given a rising gross capital stock, this will be followed by a transitional phase in which net capital formation is increasingly pushed back down by the higher write-downs. The higher the write-down rates, the faster this adjustment will be.

Over the longer term, the capital stock ratio (capital stock as a ratio of GDP) converges to an equilibrium value if the gross capital formation ratio, write-down and disposal rate, GDP growth and inflation rates are stable over time. 2 The initial value of the capital stock does not influence the equilibrium value. 

Two stylised long-term scenarios illustrate the relationships based on simplified assumptions: 3  

  • In Scenario 1, the (non-military) government gross capital formation ratio 4 is 2.9 %. This corresponds to the estimate for Germany for 2024. Scenario 2 assumes a ratio of 3.7 %. This would correspond to an increase of 0.8 percentage point compared with 2024. The Bundesbank’s reform proposal for the debt brake contains additional scope for debt-financed investment to this extent. This would support a correspondingly higher investment ratio in the long term. 5  

  • Real GDP grows at 0.6 % per year. This is in line with the Federal Government’s medium-term assumptions from autumn 2025.

  • Deflators of capital stock and GDP each come to 2 % per year. This corresponds to the Eurosystem’s inflation target. 6

  • The average disposal rate for the gross capital stock is set at 2.6 % based on the assumed structure of gross capital formation, and the average write-down rate is set at 2.9 %. 7

  • The initial values are a gross capital stock of 93 % of GDP and a net capital stock of 46 % of GDP. The values correspond to those from 2024. 8  
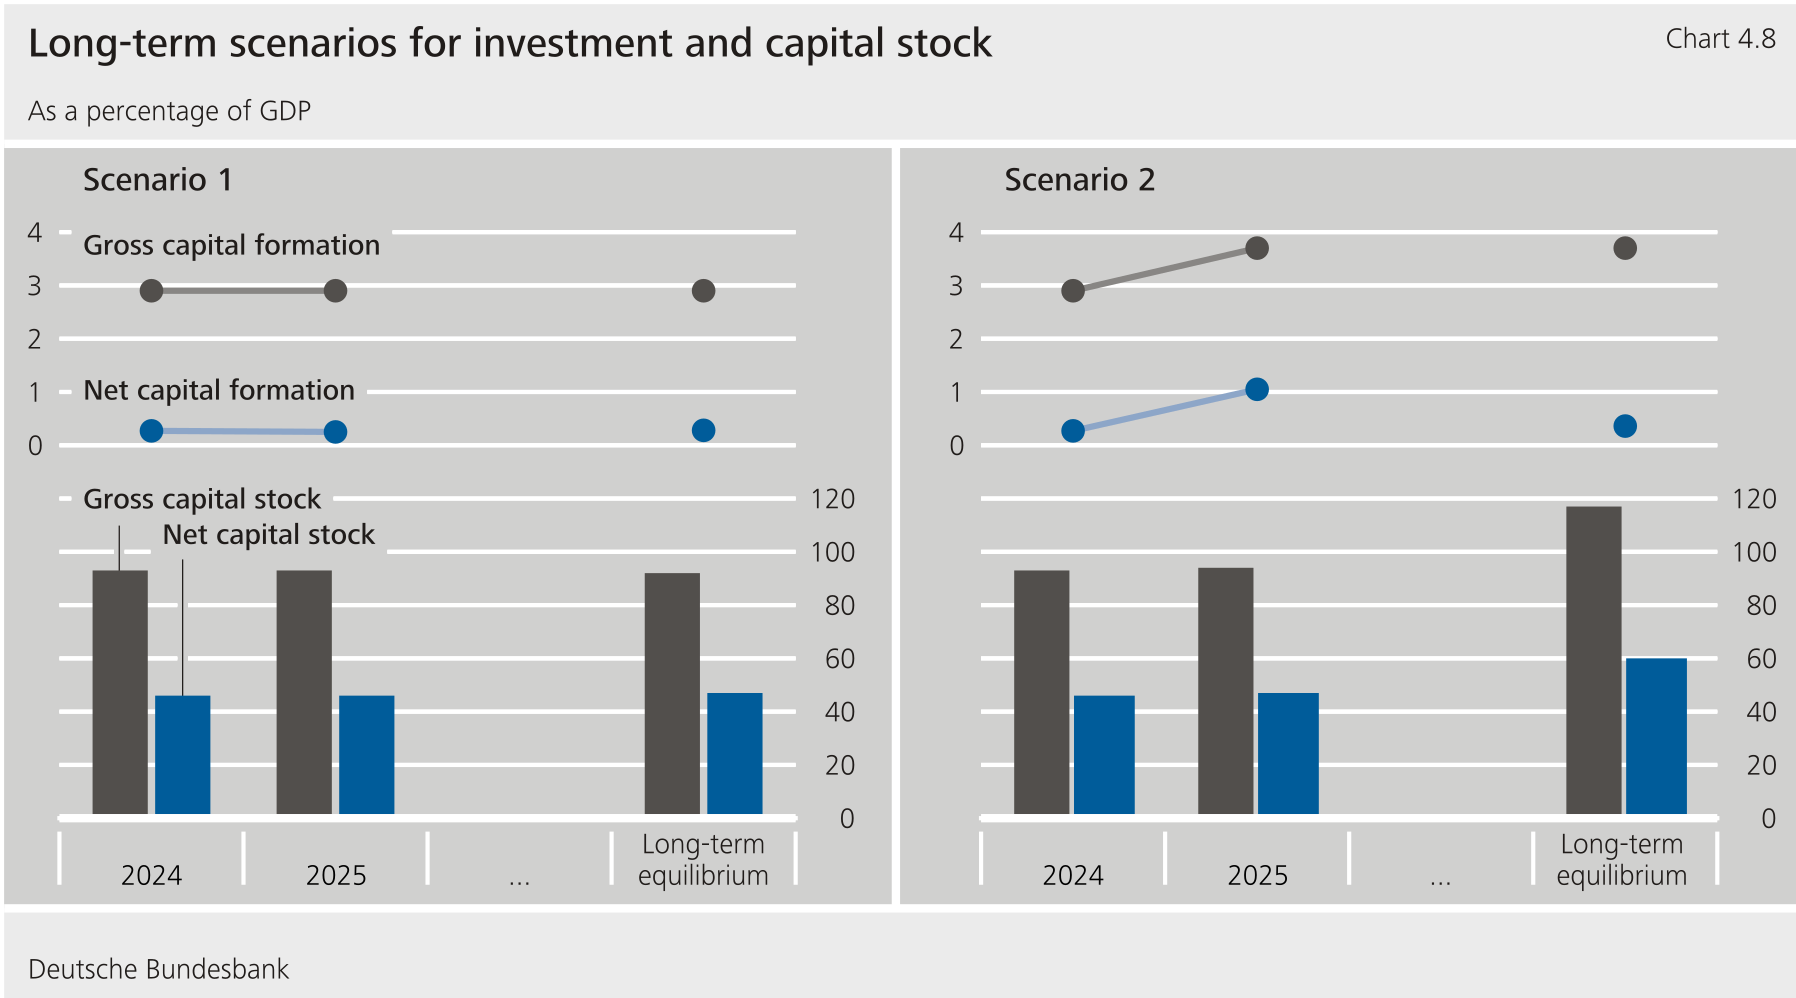
Scenario 1 with the gross capital formation ratio unchanged and constant compared with 2024: here, the gross capital stock converges to 92 % of GDP in the long term. In other words, it remains more or less unchanged from its current level. The same applies to the net capital stock, which rises slightly to 47 % of GDP. 9 The net capital formation ratio remains virtually unchanged at 0.3 % of GDP. 10  

Long-term scenarios for investment and capital stock

In Scenario 2, the gross capital formation ratio jumps to 3.7 % and then remains constant. This increases the gross capital stock, which converges to just under 117 % of GDP. The long-term net capital stock also rises and converges to 60 % of GDP. Net capital formation initially jumps to just under 1.1 % of GDP. Subsequently, however, it is pushed back down by rising write-downs. In a long-run equilibrium, it then amounts to just under 0.4 % of GDP, which is only slightly higher than in Scenario 1. 

3 In-depth analysis 3: An international comparison of government investment
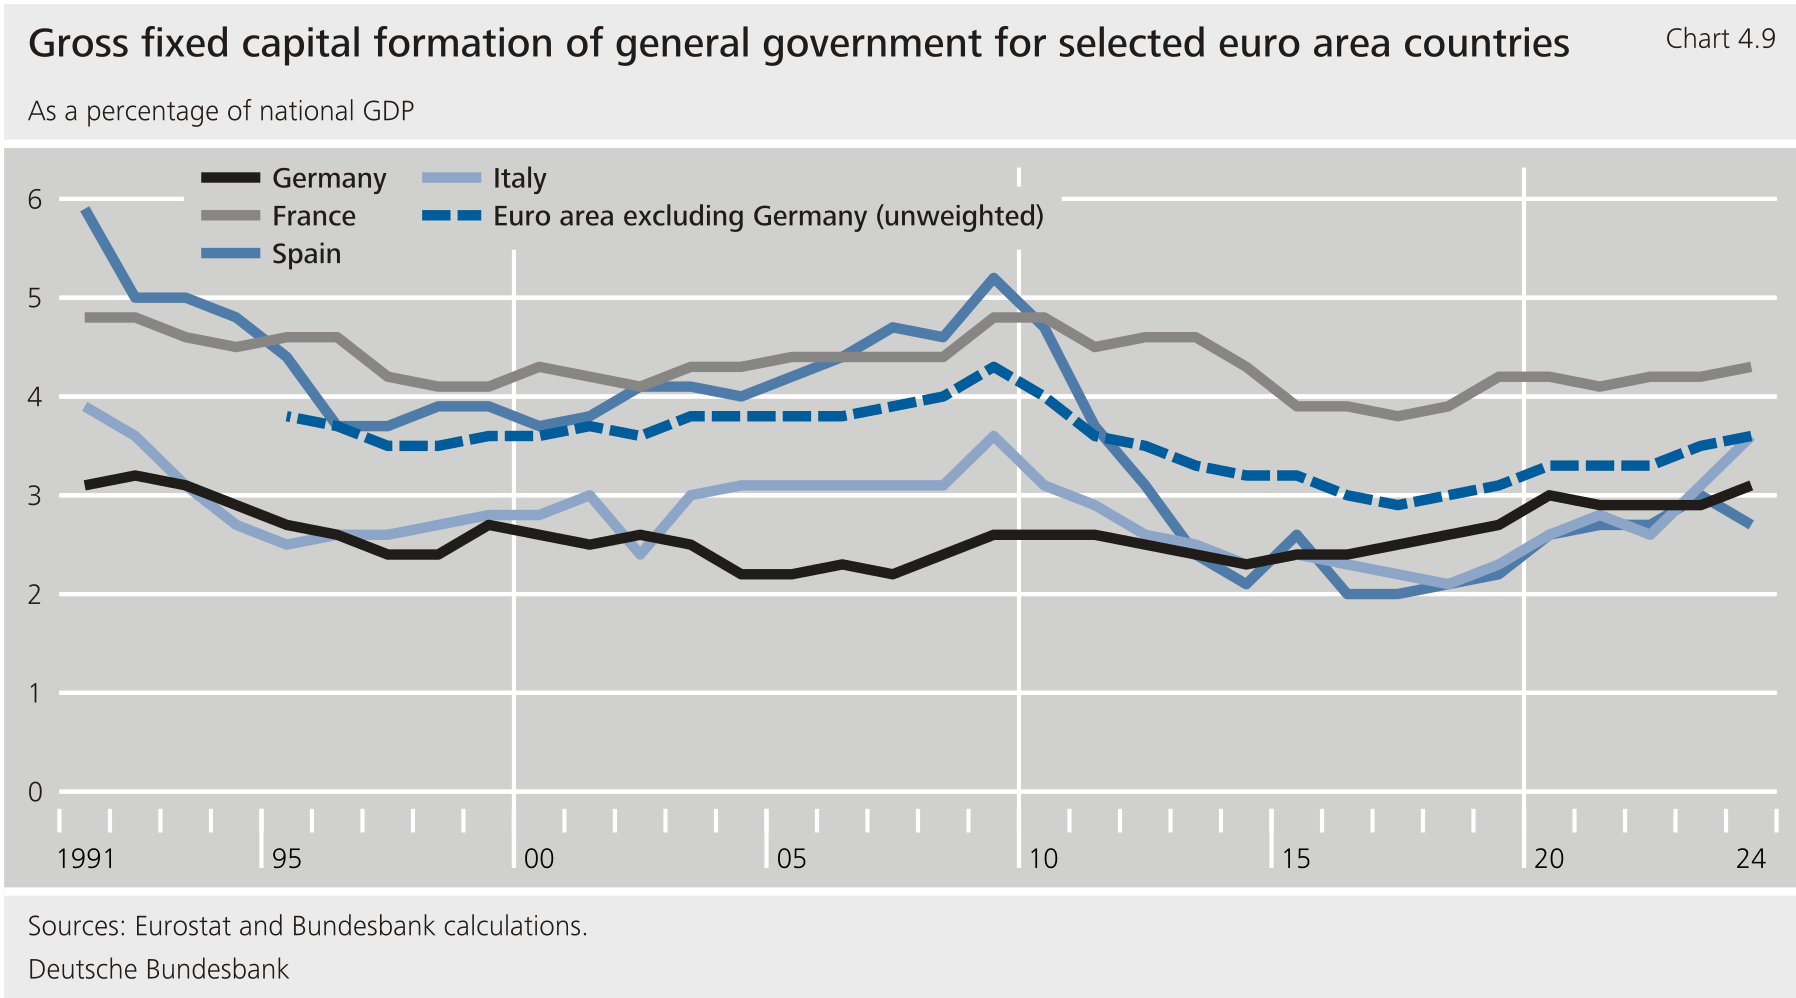
Government investment in Germany has been markedly below the average of the other euro area countries for a long time, though the gap has narrowed most recently. In Germany, government gross fixed capital formation amounted to 3.1 % of GDP in 2024. This was 0.5 percentage point lower than the (unweighted) average of the other euro area countries. Compared with the large euro area countries, Germany’s ratio was significantly lower than that of France (4.3 %) and Italy (3.6 %), but roughly on a par with that of Spain. As of 2021, Spain and Italy started to benefit considerably from investment grants from the EU’s NGEU transformation programme. In addition, it is difficult to compare some of the smaller central and eastern European euro area countries with Germany: their higher level of investment can also be explained by the macroeconomic catch-up process and, in some cases, higher military investment. Overall, investment in Germany was higher than the average of the last 25 years at the end of the period covered here, but it was lower than the average of the other euro area countries. 

Gross fixed capital formation of general government for selected euro area countries

Of the COFOG functions, Germany’s government expenditure on general public services (including research and development) and education was higher and roughly on a par respectively. Government investment in general public services and research and development in Germany stood at 0.8 % of GDP in 2023, while the average figure for the other euro area countries was 0.6 % of GDP. 43 Investment in education was slightly above the level of the other euro area countries (0.3 % of GDP).

Investment in defence has been somewhat lower in Germany since the mid-1990s. In 2023, it amounted to around 0.2 % of GDP in Germany and Spain. In France and Italy and on average for the euro area countries excluding Germany, this figure was 0.3 % of GDP. Investment ratios were higher in Greece, Cyprus and the Baltic members of the euro area, at around 0.5 % to 1.3 % of GDP.

Government investment in transport infrastructure was also below average in Germany. Since the mid-1990s, Germany’s government investment in economic affairs (mainly transport), the COFOG function with the largest share, has been below the average of the rest of the euro area countries. In 2023, it amounted to 1.0 % of GDP for Germany and 1.2 % of GDP for the other countries. 

On the whole, differences in government investment ratios should be interpreted very cautiously: their informative value is generally limited, not least because functions are not assigned uniformly to the public and private sectors. For example, Germany’s relatively high level of government investment in general public services (including research and development) and education could be due in some measure to these functions being more strongly represented in the private sector in other euro area countries. This may concern whole entities or public-private partnerships, in which private companies finance investment for the public sector. Conversely, there is some evidence to suggest that health services and the investment associated with them are more heavily based in the private sector in Germany. While government investment in Germany in the COFOG functions of health and social protection was below the average of the rest of the euro area countries in 2023, Germany was the leader in aggregate investment in human health and social work activities in the same year. 44 This is because most healthcare facilities in Germany are not part of the general government sector. This is probably the case for environmental protection, too. 45

As a result of lower government investment, Germany’s government net capital stock is also rather low compared with other large European countries. 46  This is ultimately the result of lower investment ratios over the past decades. Germany’s government net capital stock amounts to 48 % of GDP (net fixed assets). Ratios are higher in France and Italy, at over 62 % and 55 % respectively, as is the average of the euro area excluding Germany (54 %). 47 Here, too, differences in the split between the government and private sectors probably play a role. 

4 In-depth analysis 4: How various studies assess investment needs

By international standards, the quality of German infrastructure still appears to be above average. According to the infrastructure index of the IMD World Competitiveness Center, for example, Germany is currently in the top 25 %. However, its ranking has deteriorated slightly in recent years. 48 However, being relatively well positioned compared with other countries does not mean that there is no need for action. This is especially the case where there is a downward trend, as investment countermeasures take time and as Germany, as a highly developed, prosperous economy, relies on an above average level of infrastructure.

Several specific infrastructure vulnerabilities are obvious, for example, if routes are chronically congested, bridges are passable only with restrictions, trains are often delayed and schools need renovation. Educational institutions and public administration have also made little use of digital technologies to date. Specifically, an index published by the European Commission shows that Germany ranks rather unfavourably when it comes to digital administration. Most recently, it placed 23rd out of the 27 EU Member States. The latter could also be contributing to the high bureaucratic costs that are increasingly bemoaned as a drawback for Germany as a business location.

Surveys confirm this picture. In a recent survey conducted by the German Economic Institute, more than one-quarter of the firms surveyed reported that infrastructure deficiencies were significantly hindering their business activities. 49 Road and rail infrastructure, in particular, was cited as problematic. 

Central government reporting also points to transport infrastructure deficiencies in several areas. According to the 2023 Transport Investment Report, the utility value of federal motorways was assessed as being good overall. 50 However, the surface condition of almost one-fifth of federal motorways was found to be poor or very poor. 51 In addition, around one-third of motorway bridges were deemed to be in need of modernisation or reinforcement. 52  Against this background, central government launched a programme back in 2022 to modernise critical motorway bridges, targeting the worst structures, by 2032. In 2025, however, the Federal Court of Auditors criticised the sluggish pace at which the programme was being put into action. 53 DB InfraGo’s 2024 status report on the rail network and train stations points to an urgent need for modernisation in these areas. 54  Looking at waterways, too, a review by the Federal Court of Auditors found that insufficient funds had been invested in recent years for the maintenance and upgrade of dilapidated infrastructure. As a result, they have fallen into worse condition. 55  

Consistent with this, multiple studies show that substantial infrastructure investment is needed. 56 Dullien et al. (2024), for example, update the original estimation by Bardt et al. (2019) to calculate additional expenditure requirements for infrastructure and decarbonisation that are not covered by current budget funds or regular budget planning. For the 2025‑34 period, they estimate such general government needs to run to just under €60 billion per year on average (almost 1½ % of current GDP). 57 The OECD (2025) states that Germany requires additional investment of around €40 billion to €60 billion per year up to 2035 (around 1 % to 1½ % of GDP). This figure also includes investment to accelerate the green transformation and strengthen energy security. Separate studies also show that local governments, in particular, are suffering from considerable underinvestment. 58 Overall, the studies consistently indicate that Germany needs to invest more in public infrastructure in the coming years. 
 

4 List of references

Agora Verkehrswende and Dezernat Zukunft (2025), Eckpunkte für die Finanzierung eines zukunftsfähigen Verkehrssystems – Abschlussbericht mit Empfehlungen des Sachverständigenrats für die Finanzierung eines zukunftsfähigen Verkehrssystems, study, November 2025.

Arndt, W.-H. and S. Schneider (2023), Investitionsbedarfe für ein nachhaltiges Verkehrssystem: Schwerpunkt kommunale Netze, Impulse 7/23, German Institute of Urban Affairs.

Association for European Inland Navigation and Waterways (2022), Kurz vor dem Systemkollaps! Zum Zustand und den Handlungsnotwendigkeiten an Schleusen und Wehren an Bundeswasserstraßen, March 2022.

Bardt H., S. Dullien, M. Hüther and K. Rietzler (2020), Für eine solide Finanzpolitik: Investitionen ermöglichen!, IW-Policy Paper 10/19, November 2019, pp. 1‑23.

DB InfraGo AG (2025), InfraGO-Zustandsbericht: Netz und Personenbahnhöfe 2024, April 2025, pp. 1‑31. 

Deutsch, K. G., K. Frisse, R. Kalvelage, P. Mair, U. M. Pfeiffer, P. Richter, C. Rolle and W. Specht (2024), Standort D mit Investitionen stärken, Federation of German Industries, June 2024.

Deutsche Bundesbank (2025a), Forecast for Germany: Economy gradually returns to recovery path, Monthly Report, December 2025. 

Deutsche Bundesbank (2025b), Impact of additional government expenditure on infrastructure on German potential output, Monthly Report, December 2025. 

Deutsche Bundesbank (2025c), Sound public finances, stronger investment: a proposal to reform the debt brake, Monthly Report, March 2025.

Deutsche Bundesbank (2025d), Public finances, Monthly Report, May 2025.

Deutsche Bundesbank (2025e), How the debt brake could be developed further, November 2025.

Deutsche Bundesbank (2025f), Further development of the debt brake – a Bundesbank contribution to the reform debate.

Deutsche Bundesbank (2024), The German economy, Monthly Report, May 2024.

Deutsche Bundesbank (2016), Local government finances: Development and selected aspects, Monthly Report, October 2016, pp. 13‑36.

Deutsche Bundesbank (2010), Germany in the financial and economic crisis: Fiscal policy, Monthly Report, October 2010.

Deutsche Bundesbank (2009), The development of government investment, Monthly Report, October 2009, pp. 15‑34.

Dullien S., S. G. Iglesias, M. Hüther and K. Rietzler (2024), Herausforderungen für die Schuldenbremse, Investitionsbedarfe in der Infrastruktur und für die Transformation, IW-Policy Paper 2/2024, May 2024.

Dullien, S. and K. Rietzler (2019), Betrachtung des Bruttokapitalstocks mit massiven Schwierigkeiten behaftet – eine Replik, Wirtschaftsdienst 4/2019, pp. 286‑294.

European Commission (2024), Digital Decade 2024: eGovernment Benchmark, Insight Report, Directorate-General for Communications Networks, Content and Technology, July 2024.

Federal Court of Auditors (2025a), Information über die Entwicklung des Einzelplans 12 (Bundesministerium für Verkehr) für die Beratungen zum Bundeshaushalt 2025, report pursuant to Section 88(2) of the Federal Budget Code, July 2025.

Federal Court of Auditors (2025b), Slow refurbishment of dilapidated federal trunk road bridges, special report, April 2025.

Federal Court of Auditors (2025c), Priorisierung falsch: BMDV riskiert Ausfall von Wasserstraßen, report 25/2025.

Federal Government (2025a), Kabinett beschließt Infrastruktur-Zukunftsgesetz.

Federal Government (2025b), Föderale Modernisierungsagenda.

Federal Highway and Transport Research Institute (2025), Bundesinformationssystem Straße.

Federal Ministry for Digital and Transport (2025), Verkehrsinvestitionsbericht für das Berichtsjahr 2023, April 2025.

Federal Ministry for Digital and Transport (2022), Brücken an Bundesfernstraßen – Bilanz und Ausblick.

Federal Ministry of Transport (2025), Zustand/Netzqualität der Fahrbahnen.

Federal Ministry of Transport and Digital Infrastructure (2016), Bundesverkehrswegeplan 2030

Grömling, M., M. Hüther and M. Jung (2019), Verzehrt Deutschland seinen staatlichen Kapitalstock?, Wirtschaftsdienst 1/2019, pp. 25‑31.

German Council of Economic Experts (2024), Addressing shortfalls, modernising resolutely, Annual Report 2024/25, December 2024.

German Council of Economic Experts (2025), Perspektiven für morgen schaffen – Chancen nicht verspielen, Jahresgutachten 2025/26, November 2025.

Gühler, N. and O. Schmalwasser (2020), Anlagevermögen, Abschreibungen und Abgänge in den Volkswirtschaftlichen Gesamtrechnungen, WISTA 3/2020, pp. 76‑88.

Heilmann, F., N. Gerresheim, L. Henze, V. Huwe, A. Kölschbach Ortego, M. Krahé, C. Mölling, S. Schulte, S. Schulz, F. Schuster, P. Sigl-Glöckner, J. Steinwart and J. Steitz (2024), Was kostet eine sichere, lebenswerte und nachhaltige Zukunft?, Öffentliche Finanzbedarfe für die Modernisierung Deutschlands, Dezernat Zukunft, September 2024. 

IMD World Competitiveness Center (2025), IMD World Competitiveness Ranking 2025, June 2025. 

IMD World Competitiveness Center (2020), IMD World Competitiveness ranking 2020: Factors Ranking.

KfW Research (2025), KfW-Kommunalpanel 2025, July 2025.

OECD (2025), OECD Economic Surveys: Germany 2025, Vol. 2025/15, June 2025, pp. 1‑146.

Puls, T. and E. Schmitz (2025), Wie stark beeinträchtigt der Zustand der Verkehrsinfrastruktur die Unternehmen in Deutschland?,IW-Trends, Vol. 52, No 3, pp. 81‑100.

Schmalwasser, O. and M. Schidlowski (2006), Kapitalstockrechnung in Deutschland, Statistisches Bundesamt, Wirtschaft und Statistik 11/2006, pp. 1107‑1123.

World Bank (2023), Connecting to Compete 2023: Trade Logistics in an Uncertain Global Economy – The Logistics Performance Index and its Indicators, April 2023.

Has this page helped you?