4.1 Methodology for decomposing German loan growth into supply-side and demand-side factors
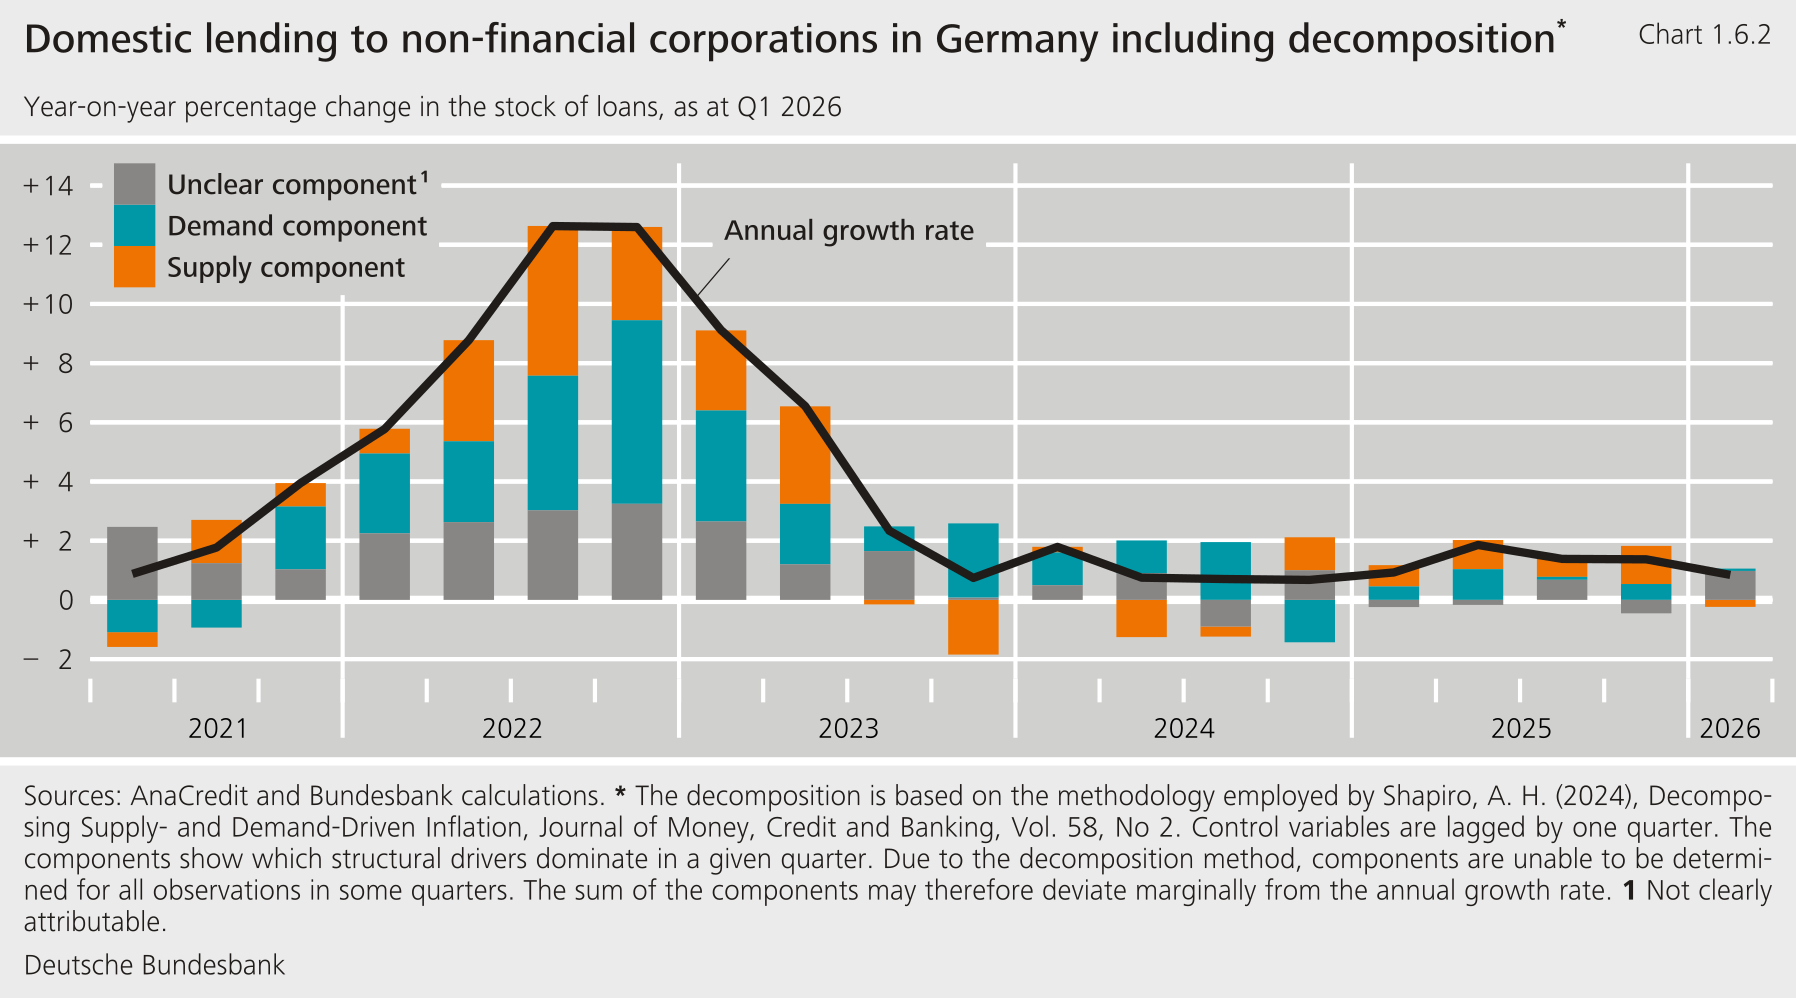
This microeconometric method enables the underlying drivers of aggregate credit dynamics to be easily identified. It is based on the bottom-up approach in Shapiro (2024) applied to granular credit data from the Analytical Credit Dataset (AnaCredit). To this end, interest rates and loan volumes are used to decompose aggregate loan growth into supply and demand components. Observations of loan growth at the disaggregated level are categorised according to whether they are predominantly dominated by supply or demand factors. Aggregating the granular observations provides insight into the relative impact of supply and demand dynamics on aggregate loan growth.
The dataset is a panel of loan-level credit data aggregated at the banking group sector level. The dataset is based on AnaCredit data for the period from January 2020 to June 2026 and focuses on loans to non-financial corporations (NFCs) in Germany. The data are aggregated at the level of banking groups’ lending to economic sectors, resulting in 98 banking group-sector pairs (categories\( i \) below). Aggregation at category level is necessary to avoid gaps in the data that arise due to their granular nature. The categories were left as granular as possible to maintain heterogeneity within the data. Monthly data are also aggregated on a quarterly unweighted basis. Due to the calculation of annual growth rates and the inclusion of variable lags, the estimation results are available from the second quarter of 2021.
The estimation consists of a quantity equation and a price equation that control for trends and aggregate developments. The annual growth rate of NFC loans at the category level, - Formel -, is the “quantity” and the unweighted average NFC lending rate on new loans at the category level, - Formel -, is the “price”. In the first step, two separate quantity \( (q) \) and price regressions \( (p) \) are carried out, each estimated over the entire dataset:
$$ \begin{align} q:\Delta loans_{i,t} & = \beta_0^q+\beta_1^q\Delta loans_{i,t-1}+\beta_2^q\Delta loans_{t-1}\\&+\beta_3^q\Delta interest_{i,t-1}+\beta_4^q\Delta reference rate_{i,t-1}+\epsilon_t^q \tag{1} \end{align} $$
$$ \begin{align} p:interest_{i,t} & = \beta_0^p+\beta_1^p\Delta loans_{i,t-1}+\beta_2^p\Delta loans_{t-1}\\&+\beta_3^p\Delta interest_{i,t-1}+\beta_4^p\Delta reference rate_{i,t-1}+\epsilon_t^p \tag{2} \end{align} $$
All regressors have a lag of one quarter. The regressors in both equations are the annual growth rate of NFC loans at the category level, - Formel -, the annual aggregate growth rate of NFC loans in Germany, - Formel -, the unweighted average lending rate at category level, - Formel -, and a maturity-adjusted reference rate based on German Federal bonds at category level, - Formel - . The error terms are - Formel - and - Formel -.
The methodology uses sign restrictions to assign each price-quantity data point to a category that reflects the dominant structural driver. Starting from an upward sloping supply curve and a downward sloping demand curve, a shift in the axis section of the supply curve is referred to as a supply shock and a shift in the axis section of the demand curve as a demand shock. In order to apply this concept empirically, sign restrictions are used. The combination of signs of the residuals of the reduced form allows the observed innovations to be classified as positive or negative supply or demand shocks:
$$ positive demand shock: \upsilon_{i,t}^q>0, \upsilon_{i,t}^p>0→\varepsilon_{i,t}^d>0 \tag{3} $$
$$ negative demand shock: \upsilon_{i,t}^q<0, \upsilon_{i,t}^p<0→\varepsilon_{i,t}^d<0 \tag{4} $$
$$ positive supply shock: \upsilon_{i,t}^q>0, \upsilon_{i,t}^p<0→\varepsilon_{i,t}^s>0 \tag{5} $$
$$ negative supply shock: \upsilon_{i,t}^q<0, \upsilon_{i,t}^p>0→\varepsilon_{i,t}^s<0 \tag{6} $$
If the price and quantity residuals have the same sign, the observation is interpreted as demand-driven, as demand shocks move price and quantity in the same direction. By contrast, if the residuals have opposite signs, the observation is interpreted as supply-driven, as supply shocks move price and quantity in opposite directions. Observations where the residual is close to zero are referred to as “unclear”. These classifications decompose aggregate loan growth into contributions from observations dominated by demand and supply shocks:
$$ \mathbf{1}_{i\in\mathrm{demand}(+),t} = \begin{cases} 1 &\text{if } \upsilon_{i,t}^q>0, \upsilon_{i,t}^{p}> 0\\ & \text{otherwise } 0 \end{cases} \tag{7} $$
$$ \mathbf{1}_{i\in\mathrm{demand}(-),t} = \begin{cases} 1 &\text{if } \upsilon_{i,t}^q<0, \upsilon_{i,t}^{p}< 0\\ & \text{otherwise } 0 \end{cases} \tag{8}$$
$$ \mathbf{1}_{i\in\mathrm{supply}(+),t} = \begin{cases} 1 &\text{if } \upsilon_{i,t}^q>0, \upsilon_{i,t}^{p}< 0\\ & \text{otherwise } 0 \end{cases} \tag{9} $$
$$ \mathbf{1}_{i\in\mathrm{supply}(-),t} = \begin{cases} 1 &\text{if } \upsilon_{i,t}^q<0, \upsilon_{i,t}^{p}> 0\\ & \text{otherwise} 0 \end{cases} \tag{10} $$
The aggregate annual loan growth - Formel - is the sum of the loan growth of the individual categories - Formel -, weighted by their loan portfolio share from the previous year, - Formel - :
$$ \begin{align} \Delta loans_{t} = \sum_{i=1}^{n} \mathbf{1}_{i\in\mathrm{demand}(+),t} \times w_{i,t-4} \times \Delta loans_{i,t} \\+\sum_{i=1}^{n} \mathbf{1}_{i\in\mathrm{demand}(-),t} \times w_{i,t-4} \times \Delta loans_{i,t}\\+\sum_{i=1}^{n} \mathbf{1}_{i\in\mathrm{supply}(+),t} \times w_{i,t-4} \times \Delta loans_{i,t} \\+\sum_{i=1}^{n} \mathbf{1}_{i\in\mathrm{supply}(-),t} \times w_{i,t-4} \times \Delta loans_{i,t} \\+\sum_{i=1}^{n} \mathbf{1}_{i\in\mathrm{unclear},t} \times w_{i,t-4} \times \Delta loans_{i,t} \tag{11} \end{align} $$
The approach does not reveal the relative magnitude of structural shocks and captures a wide range of price and quantity shifts. One limitation of using this approach with sign restrictions is that it can only determine whether an observation over a given period was dominated mainly by demand-driven or supply-driven contributions, but not the extent of the impact of each contribution. The decomposition should therefore be interpreted as the categorisation of components as being predominantly demand or supply driven. Further constraints on the underlying parameters would be needed to disclose the relative size of the structural shocks, but this would increase the complexity of the proposed framework. In addition, the shifts in supply and demand cover a wide range of structural shocks that move prices and quantities in a certain direction, i.e. supply shocks are at the very least a combination of monetary policy shocks and credit supply shocks.