State and local government finances in 2025: local government finances still in critical shape Monthly Report – October 2026
Published on
State and local government finances in 2025: local government finances still in critical shape Monthly Report – October 2026
Monthly Report Published on
State government finances are in robust shape overall. They improved again somewhat last year. Meanwhile, the financial imbalances at the local government level worsened further. In structural terms, state governments as a whole roughly balanced their budgets, while local governments posted a deficit of €23 billion. State governments (including their local governments) once again found themselves in very different financial situations. Differences are also evident between each state’s rules and challenges under their respective debt brakes and also as regards state governments’ reserves.
Overall, the underlying fiscal positions of state and local governments are unlikely to change much this year. It is, however, possible that the local government deficit will decline and the state government deficit will increase.Some state governments will probably make greater use of their expanded structural scope for borrowing as a means of easing the burden on their local governments to some degree.Furthermore, additional central government funds are accruing from the Infrastructure and Climate Neutrality Fund. Those financial resources will probably be used by state and local governments not least to ease the strain on their budgets.
Budget consolidation is primarily a matter for local governments themselves to address. Budgetary oversight bodies at the state government level have the task of imposing conditions as and when necessary. If state governments assess that local governments have done all they can to consolidate their finances, it is then up to the state governments to ensure that their local governments are adequately funded.They can do this by strengthening local government finances across the board and also as and when necessary.Another option for state governments is to participate in local government spending by providing refunds or lump-sum payments. And they can give their local governments greater assistance in performing tasks in areas where it is efficient to pool expertise or public services across the federal state. It would seem less promising, meanwhile, to count on higher central government funding for local government budgets given that, going forward, central government finances look set to be saddled with very high deficits and a backlog of unresolved items.
One reform proposal put forward by the Bundesbank would see state governments addressing imbalances in local governments’ budgets at an early stage. Specifically, it could be stipulated that local governments may only take out multi-year cash advances from their federal state. At the state government level, borrowing to fund those cash advances would reduce the scope for borrowing under the debt brake by the amount in question. This takes account of the responsibility of the federal states. In addition, the Bundesbank backs proposals aimed at stabilising local governments’ revenue.
Financial resources from the Infrastructure and Climate Neutrality Fund should not be used by state and local governments to plug holes in their budgets, even if the requirements for using those resources are weak. Rather, those resources should go towards additional fixed asset formation so that Germany’s infrastructure can be fundamentally upgraded, which is the Fund’s intention.
1 Overall financial situation: robust for state governments, very tight for local governments 1
1.1 Unadjusted deficit overall
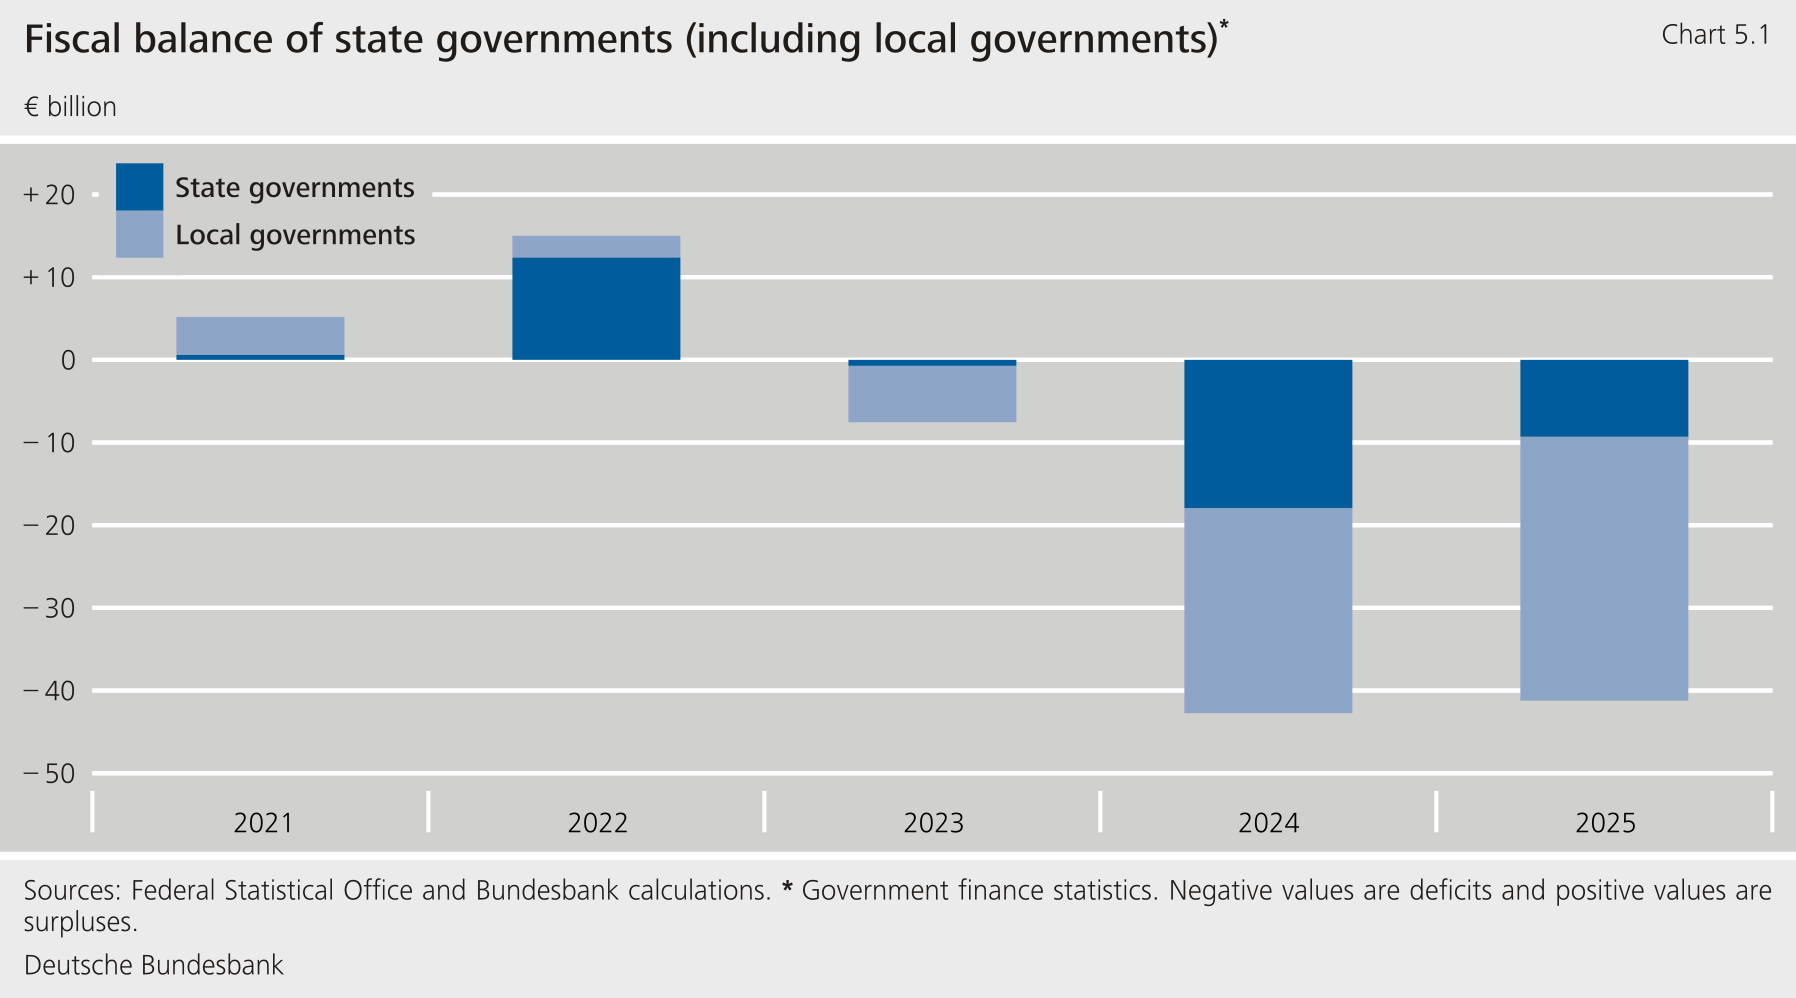
State and local governments overall reported a large unadjusted deficit of €41 billion (0.9 % of GDP) in 2025. State governments accounted for €9 billion, and local governments (of the non-city states) for €32 billion of that amount (Table 5.1, item 1, and Chart 5.1).
This meant the unadjusted deficit of state and local governments was roughly as high as it had been in the previous year. At 4 %, expenditure grew almost as strongly as revenue in 2025. Personnel expenditure, a major expenditure item, saw above average growth of 6 %. That was due to wage increases as well as a further rise in staffing levels. Other operating expenditure, meanwhile, rose by a below average 3 %. Growth in fixed asset formation was somewhat more subdued, at 2½ %. Tax revenue climbed by 4½ %. Just over 1 percentage point of that was due to the expiry of the tax-free inflation compensation bonus. Introduced in response to the energy price crisis at the end of 2022, that instrument could be used for the last time in 2024. Local governments saw receipts from local business tax, which is a key source of revenue, stagnate for the second year in succession.
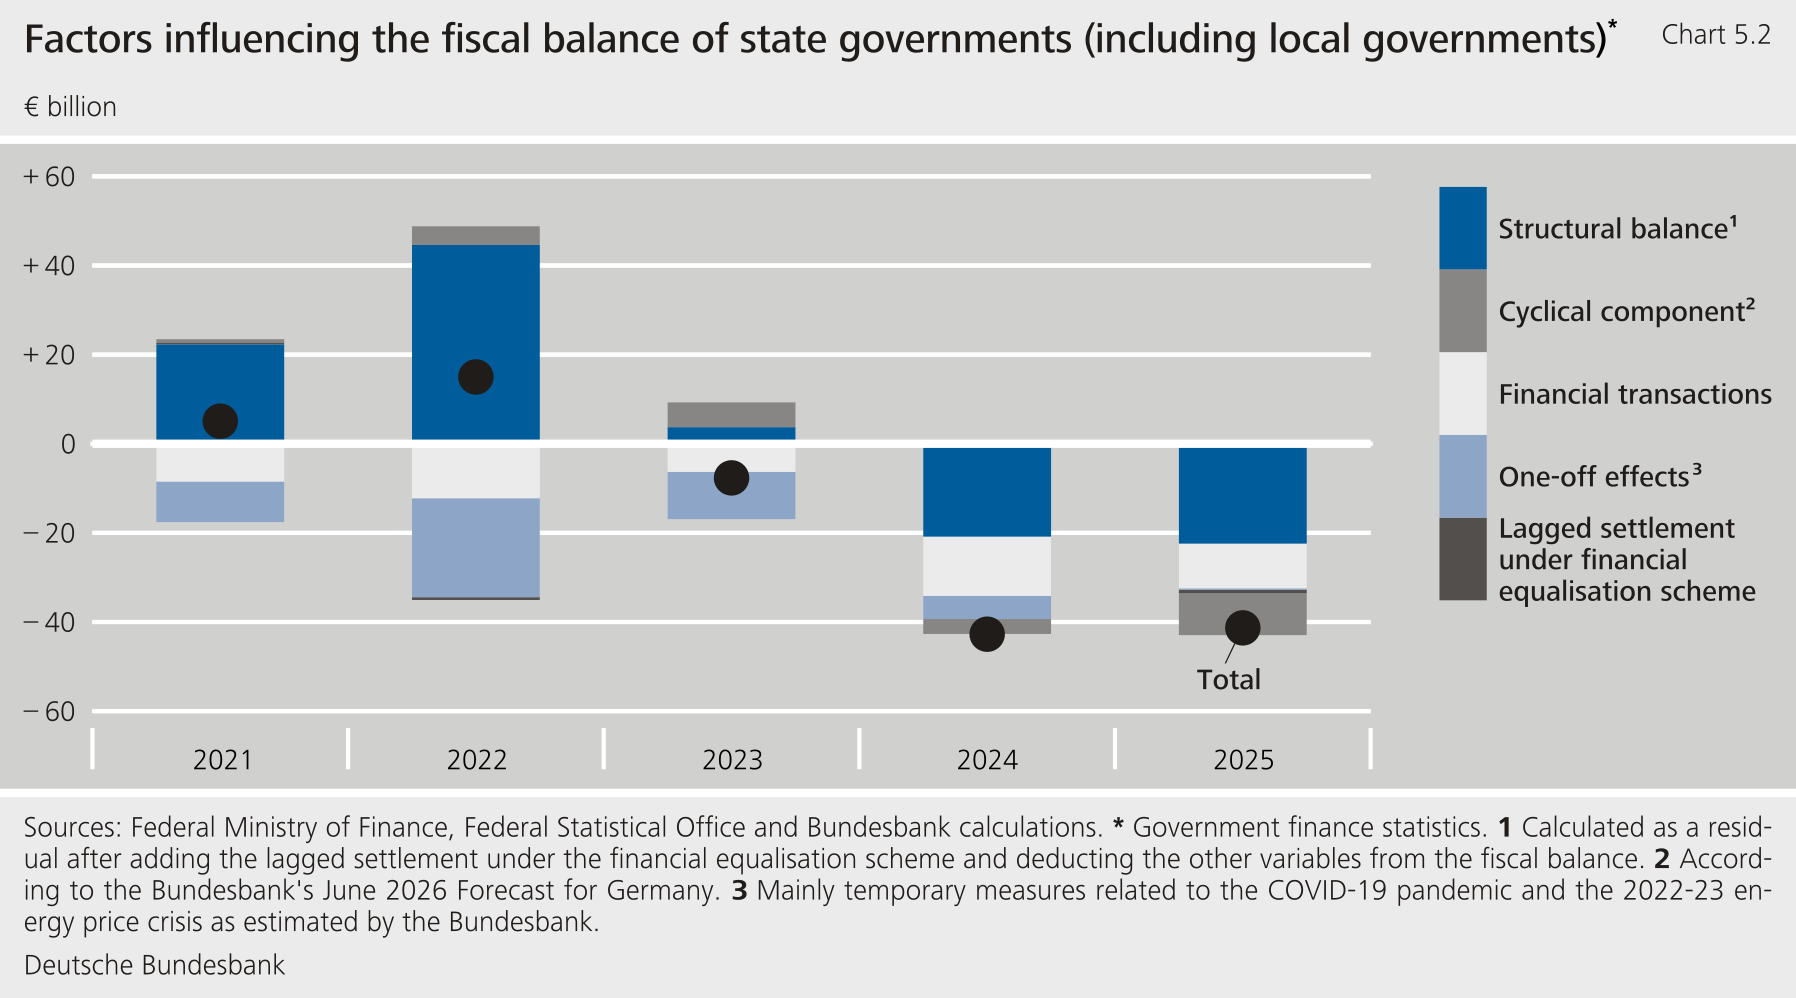
Table 5.1: Budgetary figures for state governments (including local governments)
€ billion
Item
Item no
2022
2023
2024
2025
Fiscal balance
1
15.0
– 7.7
– 42.7
– 41.3
Financial transactions (net)
2
− 12.2
– 6.3
– 13.3
– 10.0
Settlement of payments under state government financial equalisation scheme
3
– 0.6
0.0
0.0
– 0.8
Cyclical component1
4
4.2
5.6
– 3.4
– 9.4
One-off effects2
5
– 22.2
– 10.6
– 5.2
– 0.3
Structural balance
6=1-2+3-4-5
44.6
3.7
– 20.8
– 22.4
Net interest burden
7
9.6
9.1
8.9
10.5
Structural primary balance
8=6+7
54.2
12.8
– 11.9
– 11.9
Sources: Federal Statistical Office and Bundesbank calculations. 1 Cyclical component according to the Bundesbank’s June 2026 Forecast for Germany. 2 Until 2024, mainly COVID‑19 or energy measures, including various other minor one-off effects.
1.2 Structural deficit overall
The structural deficit came to €23 billion (Table 5.1, items 2 to 6). 2 Two factors explain why the unadjusted deficit was considerably higher than the structural one: First, financial transactions (such as equity acquisitions) widened the unadjusted deficit by €10 billion. 3 Second, cyclical factors placed a distinct strain on state and local government budgets last year (just over €9 billion). These two effects were observed in roughly equal measure at the state and local government levels.
1.3 Looking at state and local government levels separately
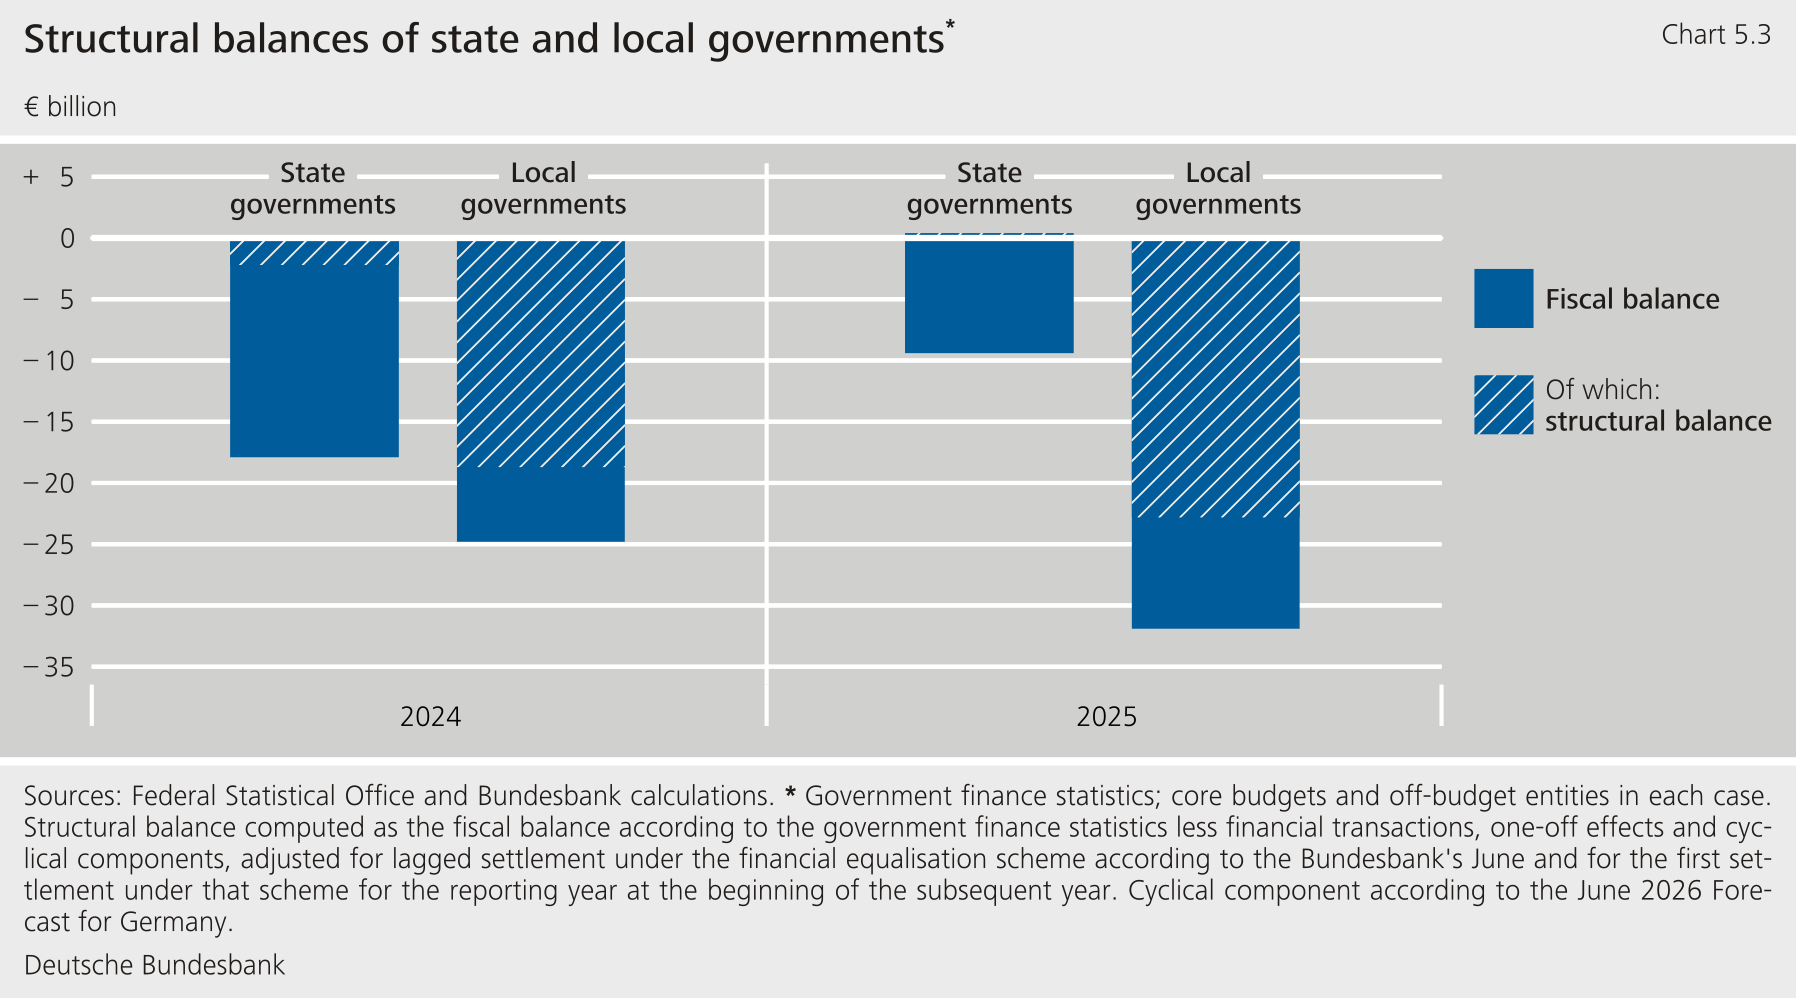
State governments balanced their budgets in structural terms. The structural deficit was attributable to local governments (€23 billion).Their financial situationdeteriorated further(Chart 5.3). 4 Financially sound local governments are permitted to run debt-financed deficits for net investment (that is, investment less write-downs) and are then also able to bear such deficits for longer. However, a large part of the deficits is probably not matched by investment activity. 5 The deficits went up mainly as a result of higher spending on social benefits and personnel. Local governments normally have to finance such deficits out of their reserves. 6 However, the latter only ever suffice for a limited period of time.
The significant growth in cash advances and, apparently, also the sharp upturn in other borrowing are signs of tightness in local government finances. Other gaps are being plugged with liquid reserves. Stocks of cash advances saw robust growth across Germany as a whole, increasing by €7 billion to €37 billion in 2025. 7 The stock of budgetary loans, at €19 billion, rose far more strongly still, and this borrowing is also likely to have been used in part to cover structural gaps in the budget. 8 In addition, the – prospectively finite – stocks of liquid reserves were yet again used to finance the deficit.
1.4 Outlook for the current year
Taken together, the deficit of state and local governments this year might change slightly on the year. Macroeconomic developments and adjustments to tax law imply only weak growth in tax revenue. As funds begin to be drawn down from central government’s Infrastructure and Climate Neutrality Fund, state and local governments might see their non-tax revenue rise sharply (Chapter 4.2).
This could widen state government deficits. Spending might grow at a noticeably stronger pace than revenue, mainly as a result of higher allocations to local governments and personnel expenditure (see the supplementary information entitled “Potential additional burden on state governments from the need to reform civil servant pay”). The debt brake ceilings still offer some scope for higher deficits in some federal states.
Supplementary information
Potential additional burden on state governments from the need to reform civil servant pay
The Federal Constitutional Courthas ruled that the state of Berlin’s pay scale for civil servants is broadly unconstitutional. 1 The criteria for the ruling ultimately apply to all civil servants throughout Germany. The court found that for certain family constellations in some salary groups, pay was in danger of falling below the minimum level required for civil servants. If the ruling requires an increase in civil servant pay, this could also affect higher salary groups, where pay may no longer adequately reflect the higher office. In principle, a retroactive adjustment is only required if the affected parties have lodged an appeal and the case remains open. Overall, significant additional burdens on government budgets appear likely. 2
The financial impact on the federal states is difficult to gauge and will probably vary from state to state. 3 The impact will depend on the extent to which civil servant pay has already been brought into line with the new standards. They are linked to reference incomes for the respective family structures, and these reference incomes differ from state to state. 4
A Bundesbank survey among the federal states revealed that eleven states are planning to adjust civil servant pay based on the ruling. 5 Seven federal states had already prepared draft legislation or were in the process of doing so. However, most state governments were not yet able to accurately quantify the additional expenditure (including back payments) for the current year. Based on Schleswig-Holstein’s draft legislation, the permanent additional burdens on the state government budget arising from the ruling could amount to just over €100 per capita from 2027 onwards. 6 Nonetheless, these burdens could be notably smaller for the other states that reported a need for adjustment. Expenditure on active staff per capita was particularly low in Schleswig-Holstein (including local governments). This can only be partially explained by lower staff headcount in Schleswig-Holstein.
Local governments’ deficit could decrease this year. Above all, larger transfers of funds from state governments are expected, including in connection with central government’s Infrastructure and Climate Neutrality Fund. Developments so far in the first half-year suggest that growth in tax revenue will remain fairly sluggish, while fee receipts will rise steeply. On the expenditure side, those developments indicate that spending on personnel, operating expenditure and social benefits will rise significantly. As regards the latter item, local governments are once again budgeting for significantly higher spending on integration assistance in particular (further details on this topic can also be found in the Annex entitled “Integration assistance and local government finances”). Growth in fixed asset formation, meanwhile, is likely to be fairly weak, and it actually declined in the first half-year (down 4½ %). Hence, the expected brisker growth in investment transfers by state governments is likely to be used to a large extent to limit the deficit, and not for additional investment. The first half-year saw investment transfers by state governments grow by 8½ %.
Local government cash advances are likely to rise further. These were down slightly at mid-year, but it should be borne in mind here that North Rhine-Westphalia assumed around €9 billion of its local governments’ debt. 9 Disregarding that debt relief, stocks have already increased by more in the year to date than they did in full-year 2025 (see Chapter 4.1 for some ideas to fundamentally improve local government finances).
2 The situation from state to state: big differences in financial situation 10
2.1 Unadjusted deficit
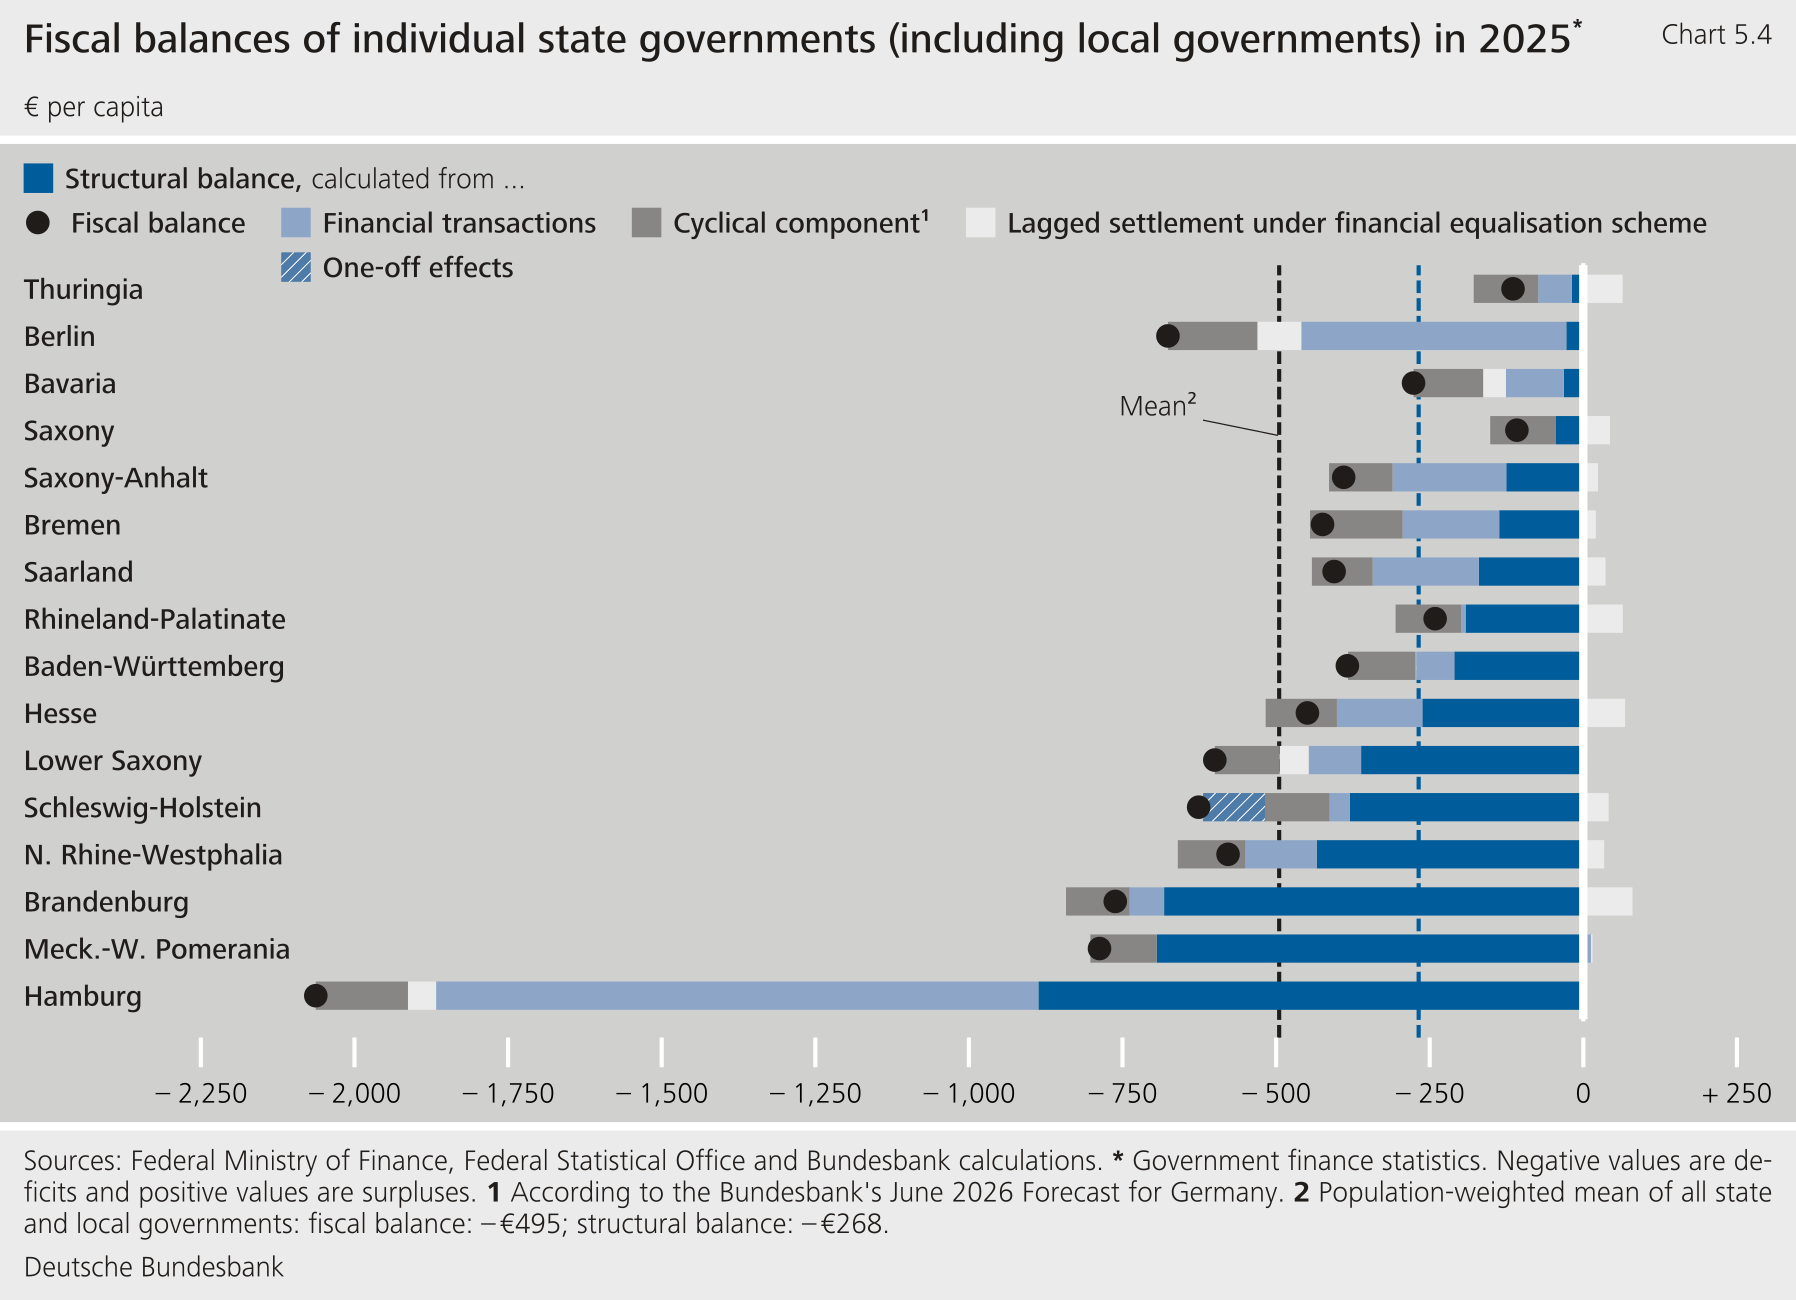
All the state governments (including their respective local governments) recorded an unadjusted deficit in 2025. As in the previous year, the per capita results were very wide-ranging. Saxony and Thuringia posted the smallest per capita deficits (€110). Among the non-city states, Mecklenburg-West Pomerania and Brandenburg recorded the highest per capita deficits (€790 and €760, respectively). By far the biggest deficit in Germany as a whole was recorded by Hamburg, at €2,100. In part, this came about due to extremely extensive spending on financial transactions. 11
2.2 Structural deficit
The structural deficit was lower than the unadjusted one in all the federal states (including their respective local governments). The disparity between state governments was considerably smaller (Table 5.2, item 6, in the downloadable Appendix). Averaged 12 across all the state governments, the structural per capita deficit came to €270. Hamburg also recorded the highest deficit in this regard (€890), followed by Mecklenburg-West Pomerania and Brandenburg. The structural deficit was lowest in Thuringia, Berlin, Bavaria and Saxony (each at less than €50 per capita).
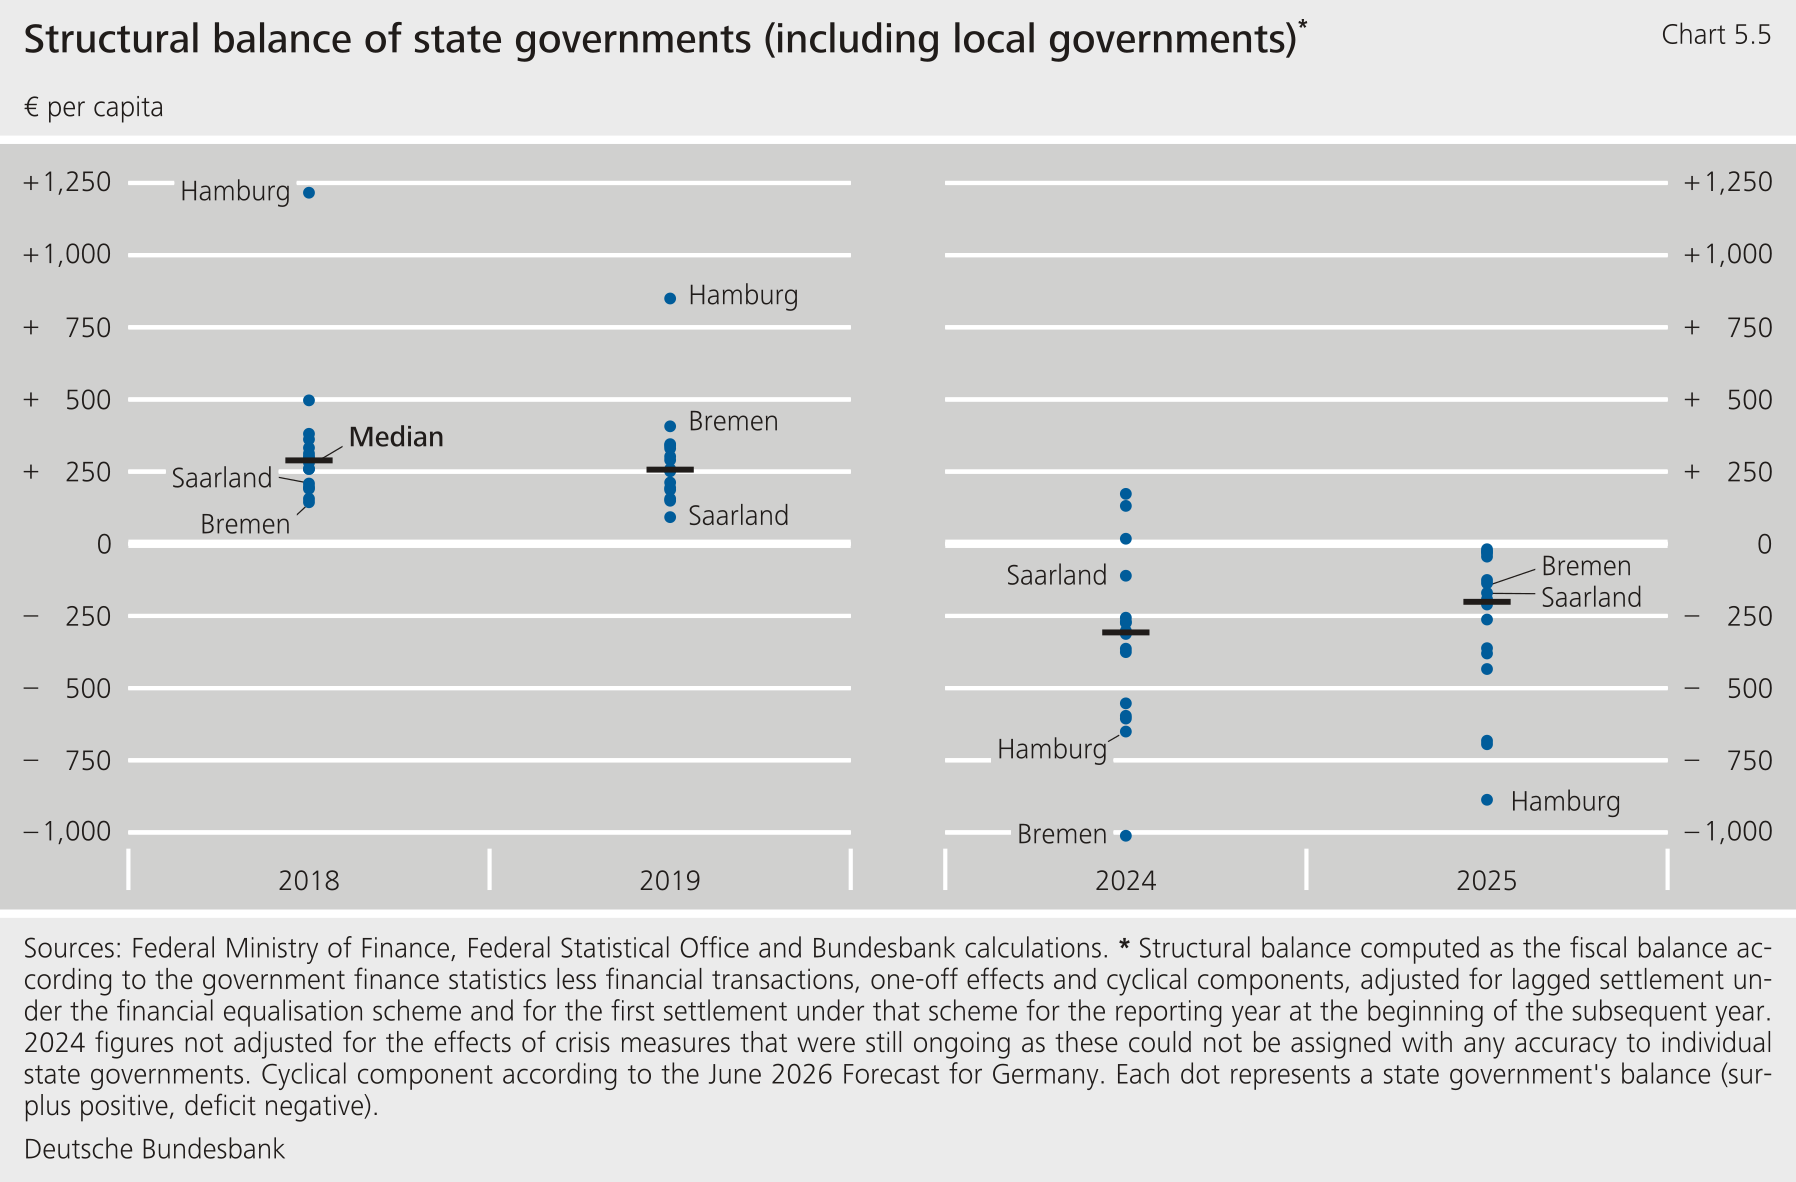
State governments’ structural balances are more widely dispersed than they were in the pre-COVID 19 period. In the run-up to the new debt brake, the structural results 13 for all the state governments in 2018 and 2019 were positive and within a narrow range. The period since then, meanwhile, has mainly seen negative structural balances and a wider range of results (Chart 5.5). Bremen and Saarland, both recipients of budgetary recovery assistance, recorded above average results in 2025, albeit only thanks to the extensive recovery assistance provided by central government.
Per capita tax revenue of state governments (including local governments) is still highly dispersed. 15 Among the non-city states alone, 16 the difference from highest to lowest was almost €900. The highest figure – Hesse’s €6,900 – was 14 % higher than those of last-placed Brandenburg and Mecklenburg-West Pomerania (Table 5.2, item 19, in the downloadable Appendix). These figures already account for the effects of the state government financial equalisation scheme. That scheme saw Hesse transfer more than €600 per capita and Mecklenburg-West Pomerania receive over €1,500 per capita (including all supplementary central government transfers). The financial equalisation scheme does, however, leave some differences, and it does not fully account for tax revenue at the local government level. In addition, the multipliers for local business tax and real estate tax were higher in Hesse, which roughly explains a difference of €100 per capita in tax revenue. 17
2.4 Debt and interest burdens
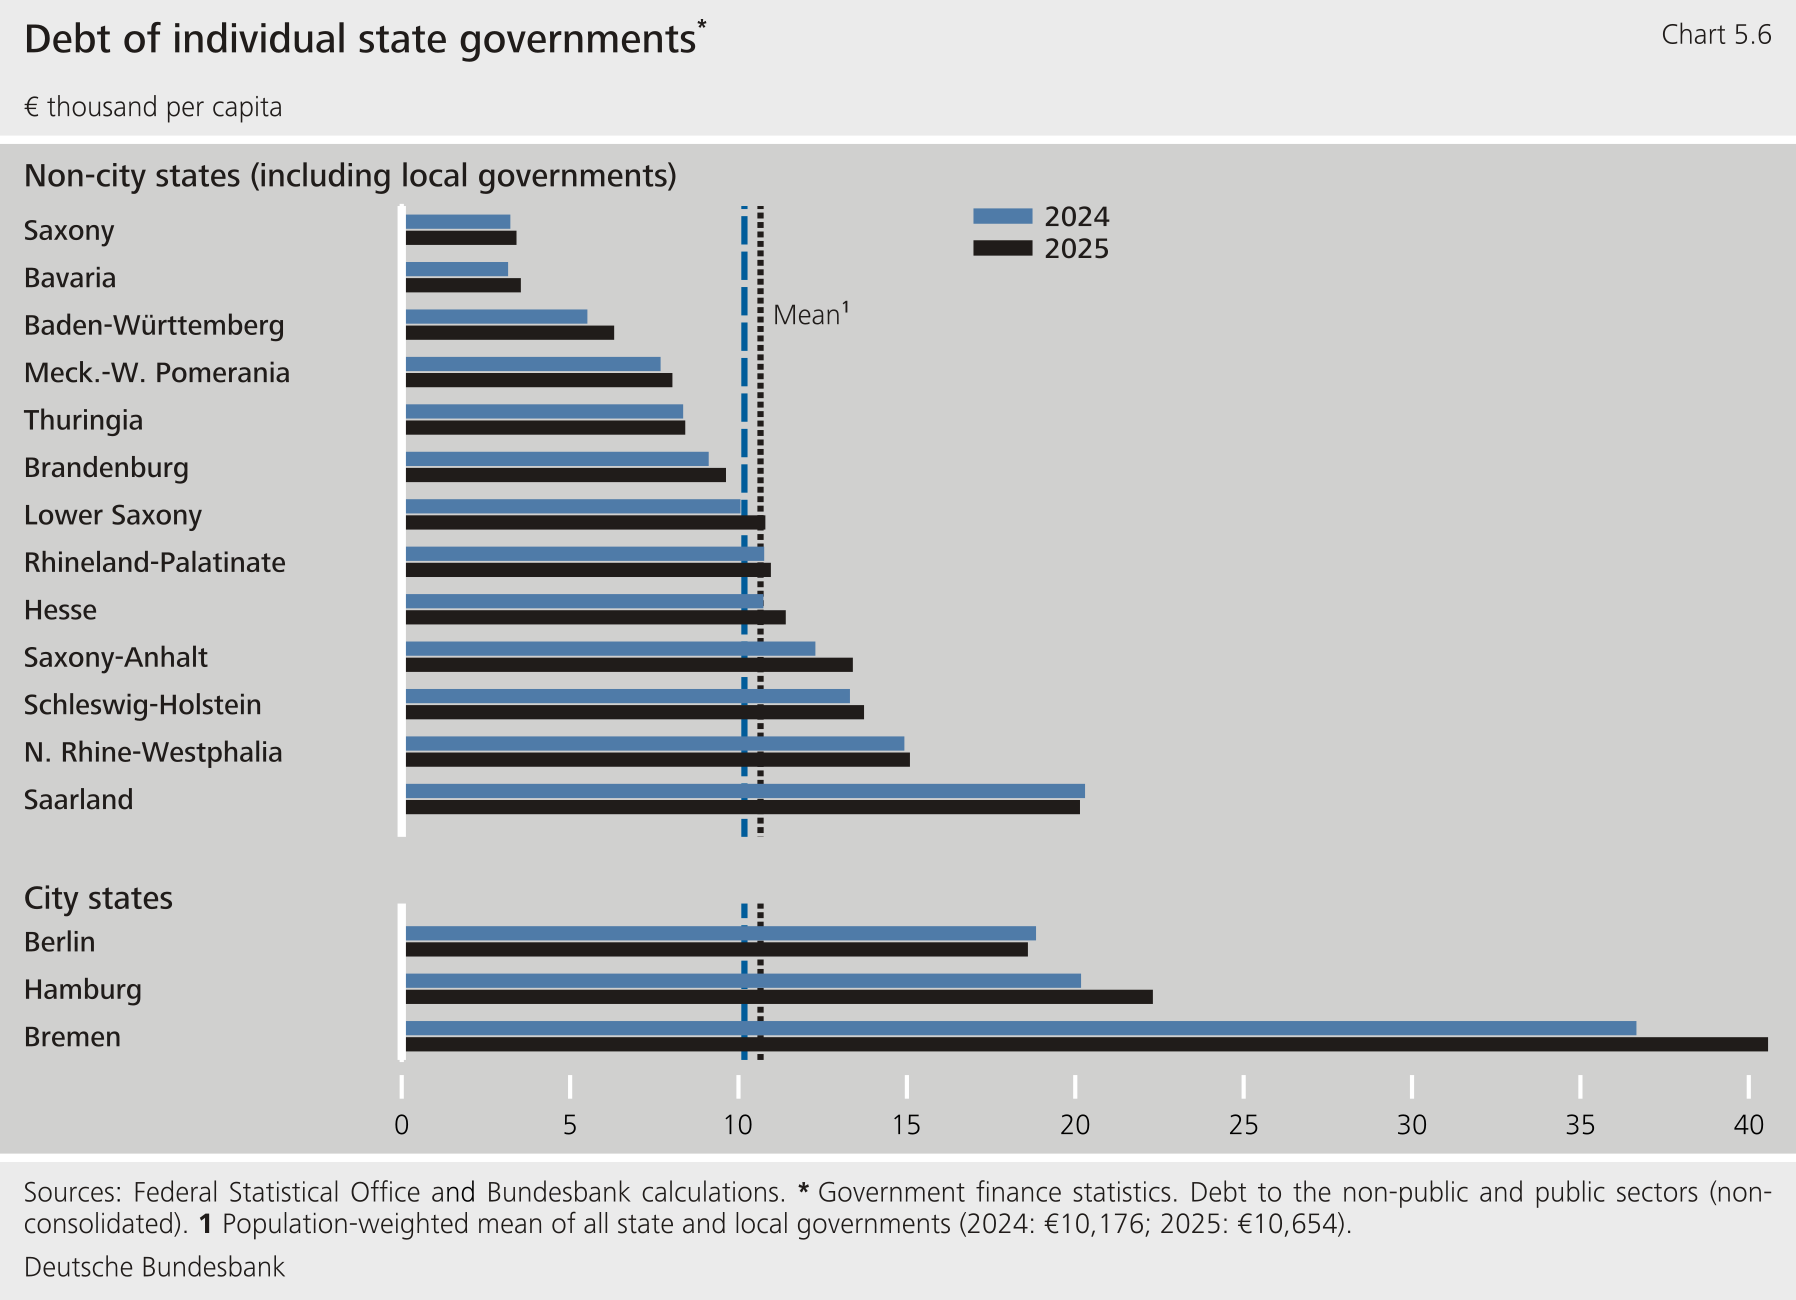
State and local government debt stood at €890 billion (around €10,700 per capita) in Germany as a whole.Per capita debt levels continue to differ very widely across state governments (including their local governments). By far the highest per capita figure was recorded in Bremen, at €40,600, followed by Hamburg with €22,300 and Saarland with €20,100 (Table 5.2, item 23, in the downloadable Appendix). 18 Saxony and Bavaria reported the lowest figures (€3,400 and €3,500, per capita in each case). Per capita debt in 2025 rose particularly sharply in Bremen (+ €3,900). Lagging far behind were Hamburg (+ €2,100) and Saxony-Anhalt (+ €1,100). The deficit in Bremen was below average, but its debt level saw considerably stronger growth because the market value of its extensive interest rate hedges increased significantly. 19
The average interest rate payable on state and local government debt rose on the year across Germany, but remains moderate. It went up by 0.1 percentage points to 2.0 % (item 24 of Tables 5.2 and 5.3 in the downloadable Appendix). On aggregate, then, the average interest rate is still considerably below current financing conditions. Over time, those less favourable conditions will gradually feed through into the average rate of interest, pushing it higher. That means the highly indebted state and local governments, in particular, will come under greater pressure on the interest expenditure side, unless they have used derivatives to hedge their exposures.
The range of average interest rates paid by state governments narrowed. That range was just over 1.1 percentage points, noticeably less than the previous year’s 1.4 percentage points. Given similar conditions in capital markets, those differences are due to differently structured borrowing arrangements (time of borrowing, interest rate fixation periods, interest rate hedges). The highest average interest rate in 2025 was recorded for Hesse. At 2.6 %, it was also 0.3 percentage points up on the previous year. This is due, inter alia, to particularly extensive gross borrowing (that is, including refinancing) under the state budget in 2024 of more than €10 billion (around one-sixth of the total debt of state and local governments) at a market average interest rate of over 2.6 %. Interest expenditure in the following year was correspondingly higher. In 2024, Bremen was the federal state with the highest average interest rate. That rate declined particularly strongly (by 0.5 percentage points) in 2025. Judging by Bremen’s budget plan, this is likely to have been mainly due to declining discounts and lower current payments on derivatives used to hedge interest rates. The lowest average interest rates were calculated for Thuringia (unchanged at 1.5 %).
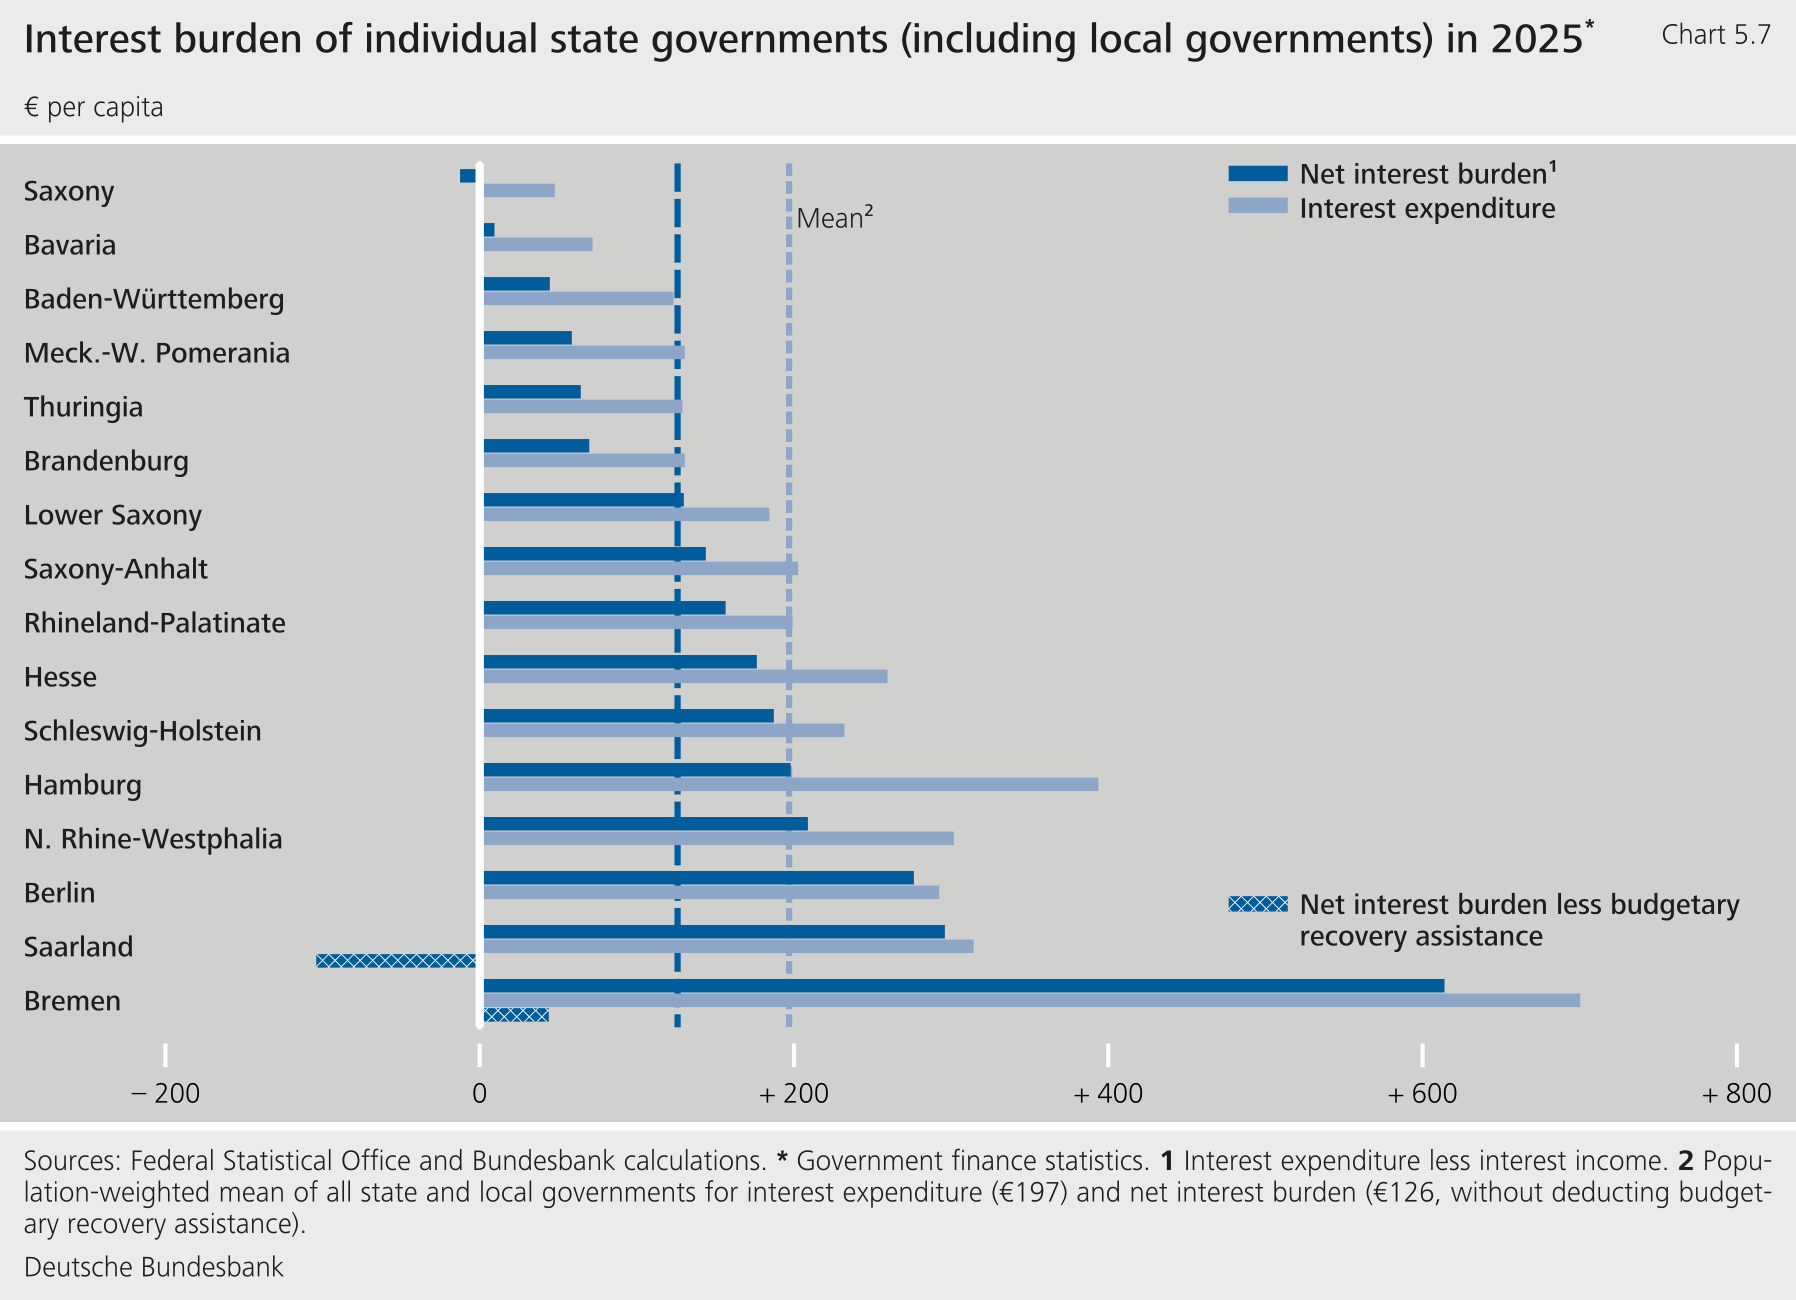
Net interest burdens – that is, interest expenditure less interest income 20 – rose distinctly in 11 federal states. The state governments not only hold debt but also, in some cases, sizeable stocks of financial assets as well. Looking at interest burdens in net terms allows the interest income these assets generate to be taken into account. The largest increase in net interest burdens was recorded in Berlin (+ €80 per capita; Table 5.3, item 7, in the downloadable Appendix). Net interest burdens remained more or less unchanged in Saxony-Anhalt, Saxony and Schleswig-Holstein, while they declined in Hamburg (− €20) and Bremen (− €170, mainly, it would appear, as a result of interest rate hedges 21 ). Bremen once again recorded by far the highest net interest burdens per capita (€610), followed by Saarland (€300). These two states each receive €400 million in budgetary recovery assistance from central government every year. This assistance means that the additional interest burden resulting from the above average debt is significantly more than offset (Chart 5.7).
3 State government debt brakes: new scope for borrowing only partially used
Chapter 3 focuses on state government finances in the narrow sense, with local governments of non-city states being excluded.
3.1 Net borrowing under the debt brake
State governments as a whole reported net borrowing of €6 billion for 2025 under their debt brakes. That means they financed their total deficit of €9 billion in 2025 (Chapter 1.1) largely via net borrowing under the debt brake. They drew on various reserves as well. 22 In addition, they borrowed in off-budget entities that fall outside the scope of the debt brake.
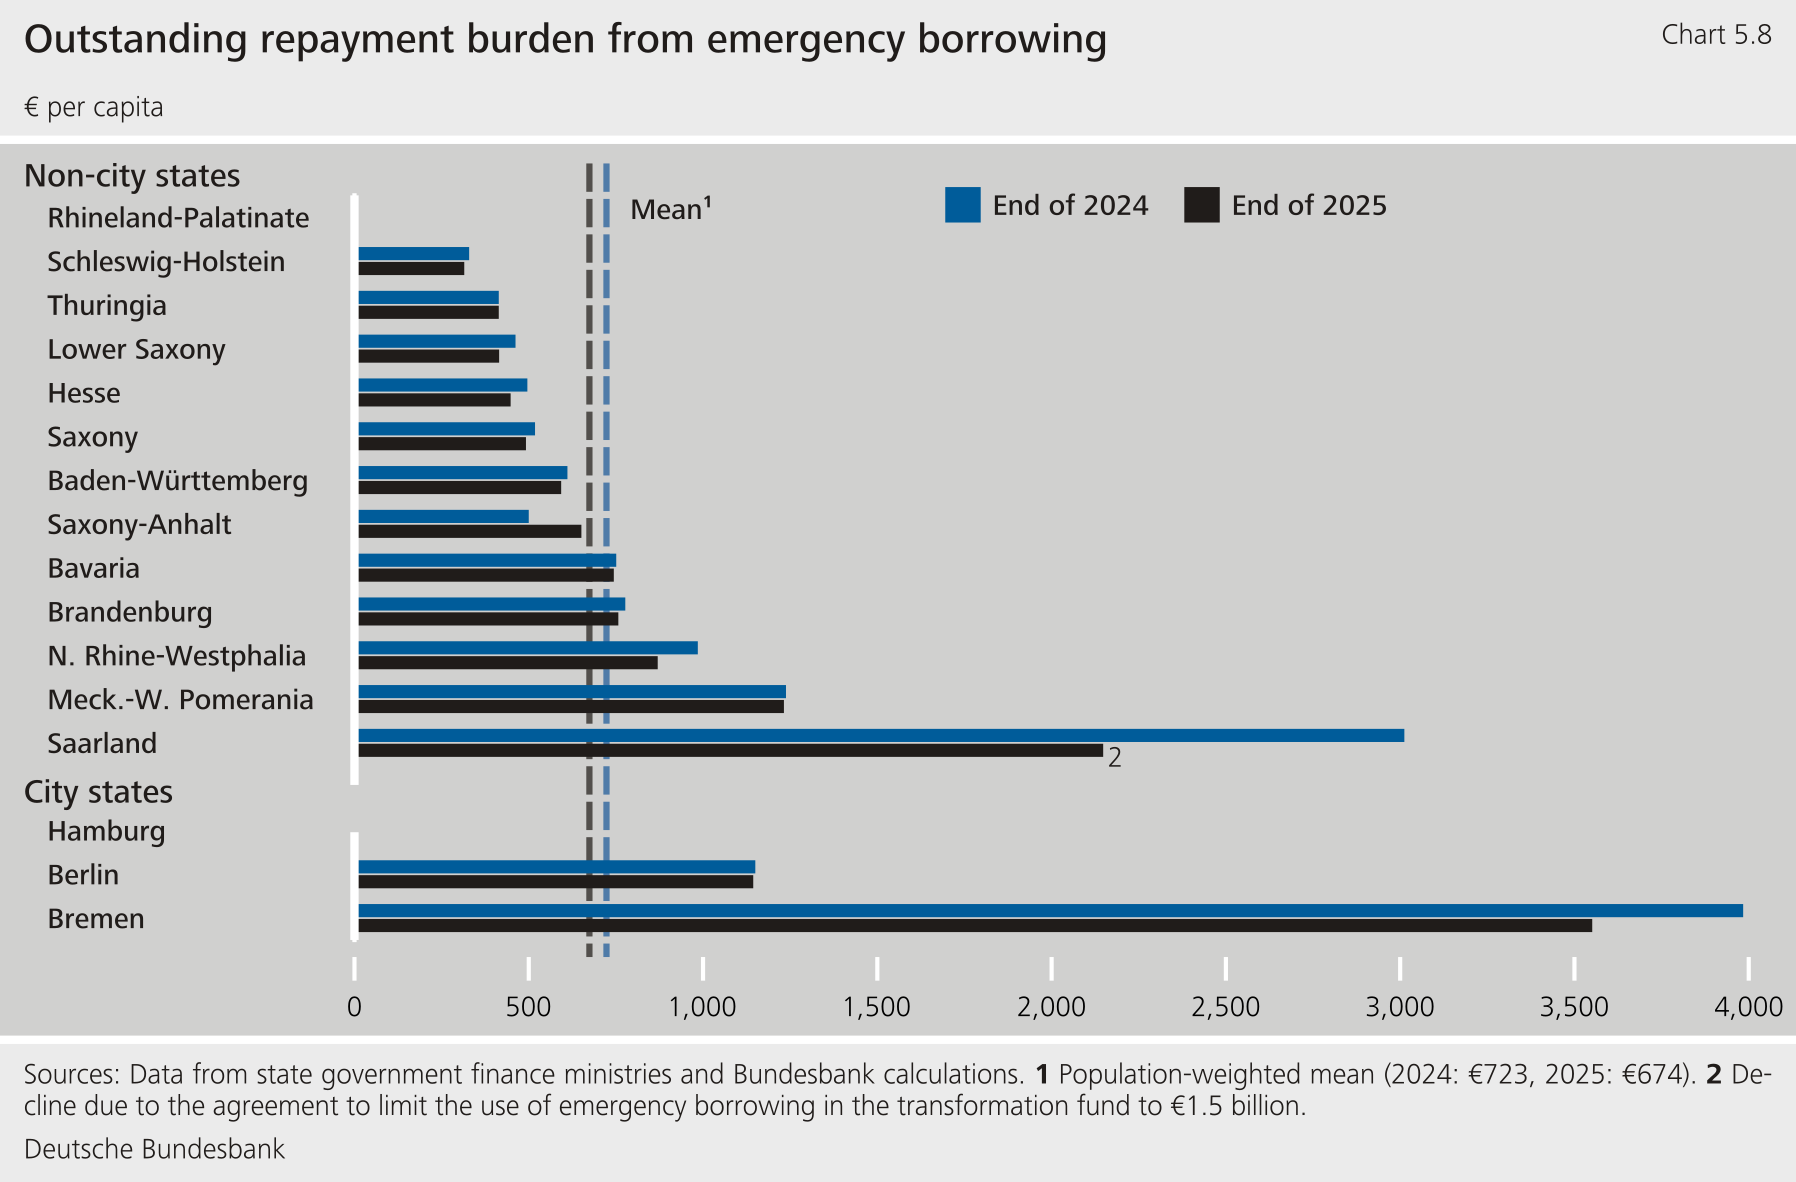
State governments reported structural net borrowing of €4 billion under their debt brakes. That means they did not make full use of the new scope for borrowing of €15 billion (0.35 % of GDP) by a significant margin. Baden-Württemberg, Bavaria, Mecklenburg-West Pomerania, North Rhine-Westphalia, Rhineland-Palatinate, Saarland, Saxony and Thuringia refrained altogether from utilising that new fiscal leeway. Schleswig-Holstein exercised the structural new borrowing option not to finance expenditure but to lower the balance on the control account. That was where the state government had posted the emergency borrowing in 2024, which was declared void. 23 Mecklenburg-West Pomerania, Thuringia and Rhineland-Palatinate mobilised fairly sizeable reserves in order to comply with their respective borrowing thresholds. For their budgets, they apply stricter ceilings than are required under the reformed debt brake of the Basic Law (Grundgesetz). Brandenburg, Bremen, Berlin, Hamburg, Hesse, Lower Saxony and Saxony-Anhalt made use of the expanded scope for borrowing under federal law. Hesse used that leeway in full. In addition, Hesse is reporting higher net borrowing of just over €½ billion in order to build up a reserve to provide for forthcoming lagged transfers under the financial equalisation scheme based on financial capacity out of the additional tax revenue in 2025. To fully reflect the cyclical influences on the cyclical control account, it would be logical for the lagged transfers under the financial equalisation scheme based on financial capacity to be accounted for as a negative cyclical component in the implementation of the 2026 budget. Saxony-Anhalt made full use of the expanded scope for borrowing in the amount of almost €½ billion. 24 In addition, it took out almost €½ billion in emergency borrowing for expenditure in the COVID‑19 special fund. Saarland likewise declared a state of emergency, which enabled it to access emergency borrowing for its transformation fund. Overall, however, the stock of emergency borrowing still to be repaid fell significantly. Ultimately, this was due to an agreement to limit expenditure under the transformation fund that the state is permitted to finance out of emergency borrowing. Borrowing under Saarland’s state budget – which is crucial for the recovery assistance it receives from central government – was limited by significantly lowering its transfers to the state office for social affairs and the latter using funds that had been set aside in previous years. 25 Hamburg remained well within the constraints of its debt brake, which meant it was able to stock up its general reserve as a provision for expected budgetary tightness. At the same time, however, large deficits were incurred in off-budget entities outside the debt brake (almost €2½ billion), which were financed in part via net borrowing outside the debt brake. In addition, under the otherwise customary single-entry bookkeeping treatment of revenue and expenditure, structural net borrowing under the debt brake would have been around €1 billion higher than allowed. It would appear that Hamburg is, in particular, using options in its accounting to improve the result, or ease its budget, by assigning fewer spending and borrowing authorisations into future years than it assumed from previous years. Such measures provide only temporary relief, however. Prudent fiscal policy is therefore particularly important.
Data reported by the federal states point to burdens of around €2 billion from cyclical effects and around €2 billion from the acquisition of financial assets. 26 These burdens are not fully reflected in the net borrowing mentioned above. Cyclical burdens, for example, can also be offset by withdrawals from cyclical offset reserves. Also, it is possible to acquire financial assets without borrowing. However, the cyclical burden in the settlement of the debt brakes was in any case comparatively low because some state governments either did not report any cyclical burden at all or offset it against unexpected additional revenue (for more details, see the supplementary information entitled “Cyclical adjustment: individual changes to procedures and continued wide variation in cyclical effects across state goverments”). 27
State governments also operate off-budget entities that borrow outside the scope of the debt brake. The figures above on the debt brakes do not include their net borrowing. There is no set of national statistics that provides a transparent account of those off-budget entities.
Supplementary information
Cyclical adjustment: individual changes to procedures and continued wide variation in cyclical effects across state governments 1
Brandenburg and Thuringia modified their cyclical adjustment procedures in 2025. 2 In future, both federal states will be able to take account of a local government cyclical component. However, this only makes sense if they also use state government funds to offset the relevant cyclical burdens at the local government level. Thuringia will now, in principle, follow central government`s cyclical adjustment procedure to prepare its budget instead of the restrictive tax level procedure it previously applied. On balance, this would have created cyclical borrowing scope of €270 million in 2025. However, Thuringia did not apply this in its 2025 budget account. Brandenburg will now take account of estimates of potential output from the preceding ten years instead of just the latest estimate. This will include estimates of potential output from the years before the COVID‑19 pandemic and the energy crisis. This will increase the calculated cyclical burdens at the current end and thus also the scope for borrowing. 3 Accordingly, Brandenburg included an ex ante cyclical burden of €950 million in its 2025 budget, compared with €370 million under the old procedure. 4 However, given the favourable tax developments in 2025, the state only accounted for a cyclical burden of €250 million ex post.
Seven state governments accounted for cyclical burdens for 2025 under their debt brakes. Four states recorded relief,mostly on a minor scale. The state government procedures still differ greatly, and the results vary widely. Most procedures also classify unexpected tax developments in the accounting year as cyclical (with reference dates for expected revenue sometimes differing). In 2025, an unexpected major inheritance tax case in Bavaria was particularly significant for such procedures. It led to more favourable cyclical effects through the financial equalisation scheme. Combined with very favourable tax revenue, this led the state of Hesse to report a distinctly easing cyclical effect (€100 per capita). At the beginning of 2026, Hesse had to transfer most of this amount to other federal states under the lagged financial equalisation scheme. In many states, however, the calculated cyclical effects remained negative. Bremen had the largest cyclical burden (€340 per capita). This was mainly because Bremen’s tax revenue turned out to be much lower than the relevant estimate from spring 2024. 5 Bavaria still does not apply cyclical adjustment. In addition, Mecklenburg-West Pomerania and Saxony did not report any cyclical effects either under their tax level procedures. Thuringia also did not claim a cyclical burden after budget implementation (see above).
The significant differences in cyclical effects are striking. Economic developments are generally similar, and any remaining differences are usually limited by the financial equalisation scheme. The actual structural scope for borrowing under the debt brakes varies greatly across individual federal states and years because of peculiarities in their cyclical adjustment procedures. Economically speaking, this does not seem plausible. Moreover, the numerous procedures and repeated modifications make it very difficult to comprehend developments concerning the debt brakes. As before, it would be very welcome if state governments followed a standardised, transparent approach to cyclical adjustment and the debt brake as a whole. This would prevent individual states from changing their procedures specifically to delay efforts to consolidate their budgets.
3.2 Emergency borrowing
In 2025, state governments repaid emergency borrowing of €4 billion on balance, largely by using reserves. This left an outstanding sum of €56 billion in emergency borrowing at the end of 2025. This emergency borrowing by the federal states had been prompted in particular by the COVID‑19 pandemic. All of the federal states were able to meet their repayment obligations last year. The new structural net borrowing scope (0.35 % of GDP) makes this easier, as state governments can also use it to repay emergency borrowing. 28 Emergency borrowing can also be repaid from reserves. The reserves are mostly the product of funds from past borrowing not having been completely used up or of borrowing authorisations still being available elsewhere. In the latter case, as in the case of offsetting against the new structural scope for borrowing, repayment of emergency borrowing does not bring down the federal state’s debt level in the government finance statistics. Repayments of emergency borrowing by recourse to reserves were recorded especially in North Rhine-Westphalia (€2 billion). In Saarland, an agreement to limit the emergency borrowing of its transformation fund provided relief (almost €1 billion).
It appears that the federal states still have sizeable reserves. In principle, they can use these to comply with the debt brake or to repay emergency borrowing. Where federal states have specific provisions governing how reserves are to be used, the state legislator in question can override them in cases of particular need. There are no known contractual budgetary commitments. Comprehensive overviews on federal states’ reserves are not available. Judging by the Bundesbank’s survey, reserve holdings at the end of 2025 were moderately lower than at the end of 2024, totalling around €130 billion (just under €1,600 per capita). 30
Provisions for future pension burdens make up over one-half of the reserves. Although reserves were up on their 2024 levels overall, some federal states relieved strain on their core budget by making smaller (net) transfers into them. This was true of Baden-Württemberg, for example. 31 Per capita figures vary widely between federal states. Saxony, for example, continues to have very high and rising pension reserves. By contrast, Saarland’s pension reserves are now largely used up. Bremen, too, is now making appreciable use of its pension reserves. This is making it easier for the city state to comply with the conditions attached to budgetary recovery assistance. In future, however, both federal states are set to face considerable pension burdens, which ought – in actual fact – to be cushioned by using the reserves.
There are also large differences between the federal states when it comes to reserves for general purposes. In some federal states, they have already been used up. At the end of 2025, general reserves totalled around €33 billion (just under €400 per capita) across Germany as a whole. Hamburg and Bavaria continued to significantly bulk up their already high general reserves. By contrast, general reserves per capita declined sharply in Mecklenburg-West Pomerania and Thuringia in particular, closing 2025 at €550 and €240, respectively. In Brandenburg, too, general reserves continued to contract. 32 If the three federal states were to carry on using their general reserves to the same extent as in 2025, they would, in arithmetical terms, be exhausted before the end of 2027. Schleswig-Holstein, Saarland, Berlin, Bremen and North Rhine-Westphalia already no longer had any significant general reserves left in 2025.However, all federal states still have other reserves that they can draw on if necessary.
4 Challenges: restore local government finances to a sound footing, increase spending on infrastructure
4.1 Sound local government finances as a task for the federal states
Local government finances are in poor shape overall, and local government efforts alone are unlikely going to be enough to radically improve matters. Overall, the very high deficits in local government budgets, coupled with low net investment and rising cash advances, suggest that local government budgets are severely strained. 33 Restoring their budgets to solid ground is, first and foremost, a matter for local governments themselves. State governments can press home efforts made at local government level through their budgetary oversight. With the deficits very high and many local governments having had to demonstrate greater efforts of their own over a number of years already, local governments’ own efforts will probably need to be just one building block of a much larger package.
Federal states are constitutionally required to ensure that their local governments have adequate financial resources. Some state governments appear to be planning to expand their allocations of funds on a discretionary basis. According to the Bundesbank’s survey, they are providing for additional resources for 2026 in a number of cases (see the supplementary information entitled “Selected measures by state governments to further ease the burden on local governments” for more details on specific federal states). Overall, additional leeway to support local governments ought to still be available: in 2025, many federal states were far from fully exhausting the scope for borrowing under the debt brake (which was expanded last year). It appears that some scope remains this year, too.
State governments could also ease some of the burden on local governments in terms of the volume of tasks delegated to them and how they are performed. They can re-examine how far they can relieve their local governments of tasks or at least help them with them. For example, they could aid in digitalising administrative services. Adopting a coordinated, nationwide approach may be useful here (for example, to facilitate data exchange, to enable supralocal deployment of staff with specific expertise, and to guarantee uniformly high standards of IT security).
Banking on higher central government funding for local government budgets, as in the past, does not seem a promising option. The clear allocation of tasks to the federal states is one argument against it. Central government’s financial situation is another. Under the current fiscal planning up to 2030, central government deficit is set to rise exceptionally sharply. From 2028 onwards, it also incorporates additional extensive and rapidly growing outstanding need for action.
Supplementary information
Selected measures by state governments to further ease the burden on local governments
In 2025, only a few state governments launched special programmes to support their local governments. At the end of 2025, Hesse launched an immediate programme worth €300 million using its new structural borrowing scope. While this only reduced its state-wide local government deficit in the cash statistics by just under one-tenth, it still improved the result in the profit and loss account by one-fifth. The number of local governments with cash advances rose significantly, nonetheless. However, 87 % of Hesse’s local governments still had no cash advances due in following budget years. 1 North Rhine-Westphalia, whose local governments have taken on particularly substantial debt in the form of cash advances, has made €250 million available annually since 2025 to service their legacy debt. The state has now largely implemented its plan to take on cash advances totalling €9 billion from highly indebted local governments. This assumption of debt covers roughly half of the amounts accumulated up to 2023. Baden-Württemberg not only brought forward payments of around €2 billion over the year but also paid an additional €½ billion as an initial step. Even so, the stock of local government cash advances in Baden-Württemberg rose by just over €½ billion on the year at the end of 2025, albeit from a very low level.
Additional relief is planned for 2026 according to a Bundesbank survey. Seven state governments said they would raise payments to their local governments beyond the increase usually budgeted for. Five of these states increased their payments under the local government financial equalisation scheme by a total of €2 billion. 2 Saarland is currently working to reform its local government financial equalisation scheme. Six of these state governments are increasing transfers and reimbursements to local governments in other areas on a discretionary basis. Payments of €3 billion can be clearly quantified for 2026. North Rhine-Westphalia is planning to increase the share of state government tax revenue under the financial equalisation scheme by ½ percentage point to 23½ % for 2027. 3 That share had previously remained unchanged for many years. Roughly speaking, the increase will give local governments in North Rhine-Westphalia relief equal to just over 3 % of their 2025 deficit.
The amount of additional support that state governments are providing to their local governments this year does not appear to depend primarily on local governments' deficits in 2025. A simple comparison shows no systematic correlation between the local governments' per capita deficits in 2025 and the additional support provided by state governments in 2026.
One reform proposal put forward by the Bundesbank would see state governments addressing imbalances in local governments’ budgets at an early stage. 34 It appears that fresh local government budget imbalances have arisen recently, and most federal states have failed to make prompt use of the options at their disposal to mitigate them. Developments like this are an argument for anchoring federal states’ responsibility for local government finances more firmly. The Bundesbank proposes that local governments be permitted to take out cash advances with a maturity beyond the end of the year from their state government only. If the federal state resorts to borrowing as a way of financing lending to its local governments, it should have to count that towards its own scope for borrowing under its debt brake. Such an arrangement would take away the incentive for federal states to put off tackling local government problems until future legislative periods. After all, budgetary imbalances at local government level would then have a direct impact on the state government budget in question.
Further reform of local government finances is also advisable. Such reform should stabilise local government revenue and help to curb local government deficits. 35 Revenue from local business tax and transfers from state government are of great importance for local government finances and fluctuate strongly in some cases. Steadier revenue would help local governments better assess how much scope for spending they have and gear their projects accordingly. State government payments under the local government financial equalisation scheme could be based on the trend trajectory of tax developments and stagger adjustment for revisions in this regard over time. This would also better suit the widespread approach of not cutting a federal state’s cyclical component by the funds passed on to their local governments under the financial equalisation scheme. At present, these payments are mostly based on estimated tax developments. This is supplemented by a settlement to account for estimation errors from the last year to have undergone settlement. As a complementary measure, it appears advisable to move more towards a system where transfer amounts are closely based on what local governments operating on a solid fiscal footing are currently requiring to perform the tasks delegated to them. This should also help to bring down local government deficits.
4.2 Use central government funds for additional spending on infrastructure
The Basic Law grants state and local governments €100 billion from the debt-financed Infrastructure and Climate Neutrality Fund for investment in their infrastructure. This was agreed as part of the March 2025 amendment to the Basic Law (Grundgesetz). There are no limits on how much funding can be drawn down each year. Nor is there anything anchoring the idea that this portion of the special fund should be used to fund actual additional investment compared with an appropriate reference year.
As things currently stand, barely any funds have been disbursed from the Infrastructure and Climate Neutrality Fund. In their responses to the Bundesbank survey, the federal states reported high withdrawals for the year 2026 as a whole, though. In 2025, the federal states did not request any funds, and it seems that they are planning only limited retroactive recourse for investments made in 2025. The first half of 2026 saw outflows of just €½ billion. For 2026 as a whole, however, the federal states reported planned drawdowns of €8½ billion, with Bavaria accounting for the bulk of that sum. Around two-thirds of the total amount is planned to go to local governments. It is possible that state governments might take out significantly more funds overall: some federal states did not provide any information on planned withdrawals – including the populous North Rhine-Westphalia and Baden-Württemberg. On the other hand, federal states could end up drawing down less than planned, as has been the case with past central government aid initiatives. For instance, the figures for local government drawdowns could include buffers, or investments might get delayed.
However, regional and local infrastructure is likely to only be improved if state and local governments actually use their funds from the Infrastructure and Climate Neutrality Fund for additional investment. In light of the existing budgetary problems and the political difficulties often involved in consolidation, it is to be expected that they will use a large part of the funds to plug budgetary gaps. But given that the funds are limited, they can only serve to bridge the gaps in budgets on a temporary basis at most. Local governments’ structural deficits should therefore be scaled back by means of fiscally sustainable measures from the outset. And state and local governments should use the funds from the Infrastructure and Climate Neutrality Fund to finance additional infrastructure investment which will actually address the identified infrastructural shortcomings.
Annex: Integration assistance and local government finances
Cross-state perspective
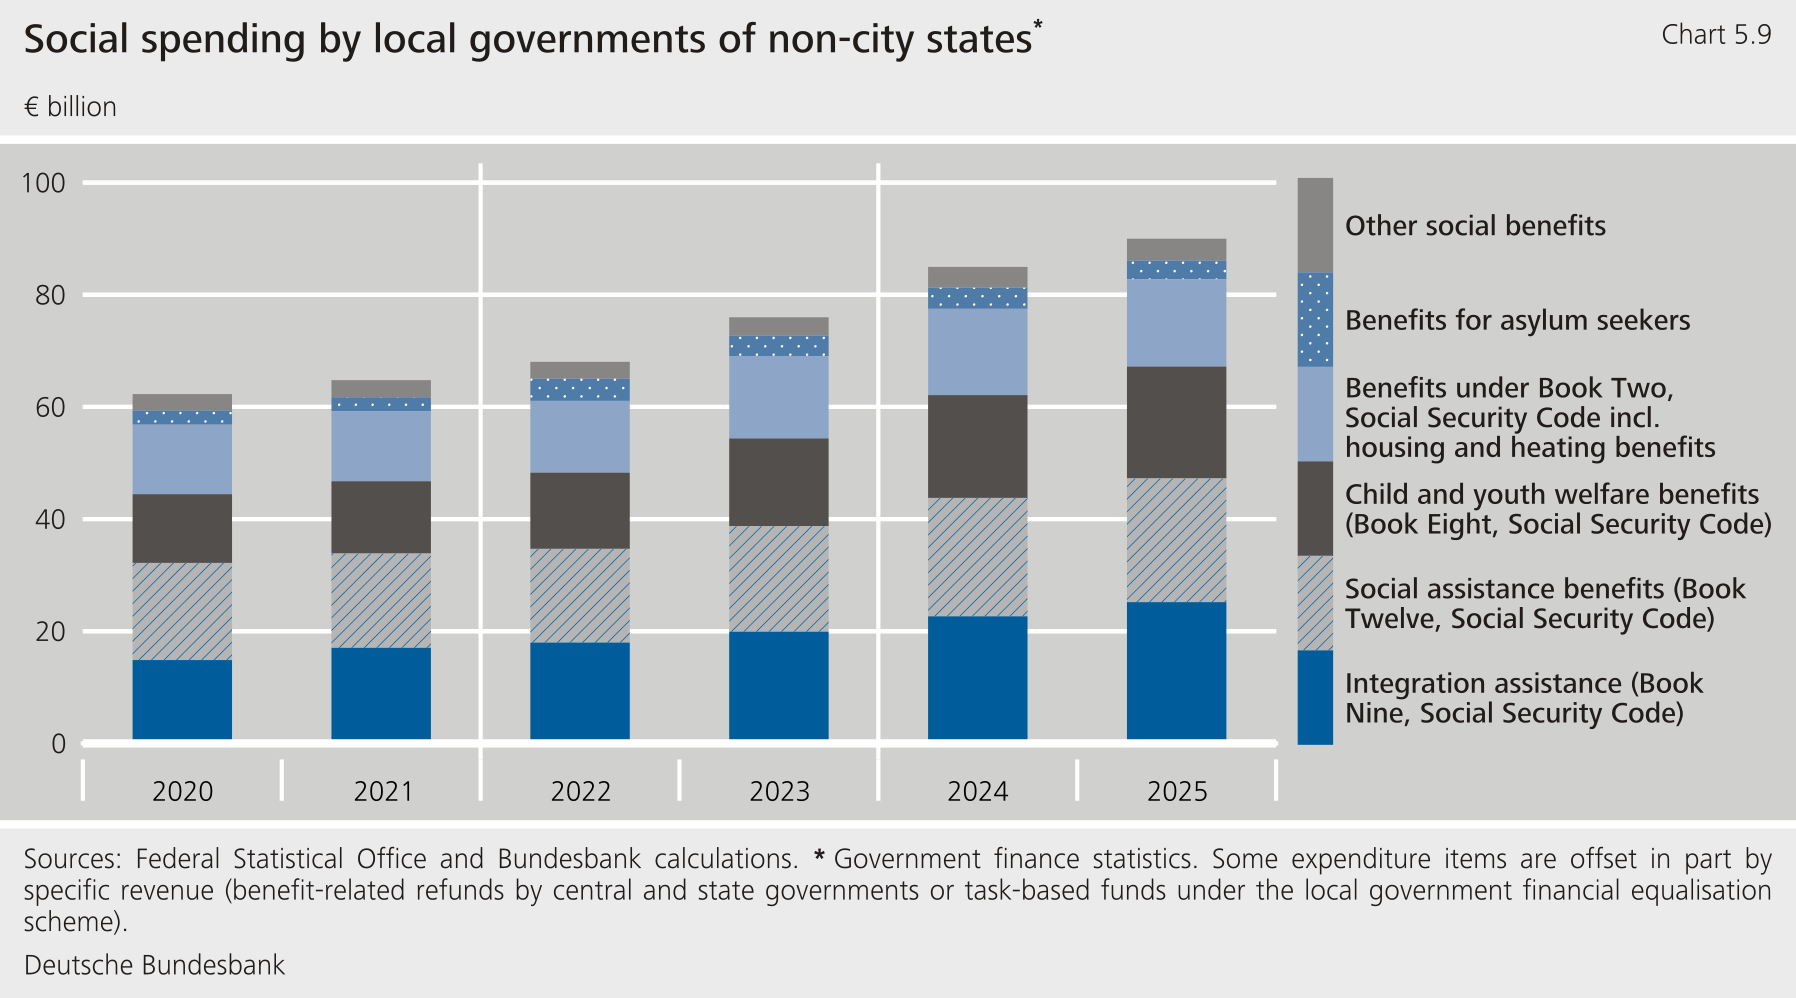
Rising social spending is increasingly weighing on local government finances, not least in the form of integration assistance. Between 2019 and 2025 social spending by local governments in the non-city states went up from €61 billion to €90 billion (according to the cash statistics). This corresponds to annual average growth of 6.8 % – twice as high as nominal GDP growth. Integration assistance under Book Nine of the Social Security Code was one of the contributing factors. Integration assistance is intended to enable people with disabilities to participate fully and equally in society, work and education. Expenditure on integration assistance now accounts for just over one-quarter of local government social spending. At the same time, there are wide differences between federal states in terms of the costs involved. Integration assistance thus serves as an illustrative example for the fact that spending pressures on local governments have increased and that the situation differs from federal state to federal state.
Expenditure on integration assistance saw particularly rapid growth. Separate figures for this type of expenditure are available from 2020 onwards. Between 2020 and 2025, it rose by an average of 11 % per year. In 2025, around 1 million persons were in receipt of integration assistance throughout Germany.
Rising per-case costs are likely to have been one of the main factors driving the vigorous growth in spending on integration assistance since 2020, with personnel expenditure playing a particularly big part in those. Staff costs are estimated to account for around 80 % of expenditure on integration assistance. 36 Demographic developments can also contribute to rising expenditure, for example through longer life expectancy and the fact that support needs systematically increase as people get older. 37 According to the integration statistics, which also include pure state government expenditure and the city states, the number of cases rose by just over 2 % per year between 2020 and 2025. In addition to cost increases, the rise in expenditure per person is likely to be due, at least in part, to changes in the scope of benefits. The gradual implementation of the Federal Participation Act (Bundesteilhabegesetz), which was adopted in 2016, is likely to be playing a part there. 38
State and local governments’ shares of expenditure financing
Local governments probably bear the bulk of expenditure on integration assistance themselves. In 2024, local governments’ revenue directly attributed to integration assistance covered only one-quarter of their corresponding expenditure. 39 There are significant differences in the shares of costs that federal states shoulder for specific tasks under legally defined cost responsibility arrangements. They range from full coverage, as in Saarland – where the state itself is the provider of integration assistance – to no direct contribution to costs – as in Hesse, where it is only local governments that are the responsible providers. 40 That said, these shares should be interpreted with caution. This is because instead of carrying a higher proportion of costs, each state can also provide additional general funds to local governments as part of the local government financial equalisation scheme. It is often not possible to assign a specific part of the financial equalisation payments to integration assistance. Greater transparency about payment flows would be needed to derive figures for the actual net burden on local governments stemming from integration assistance.
State-by-state perspective
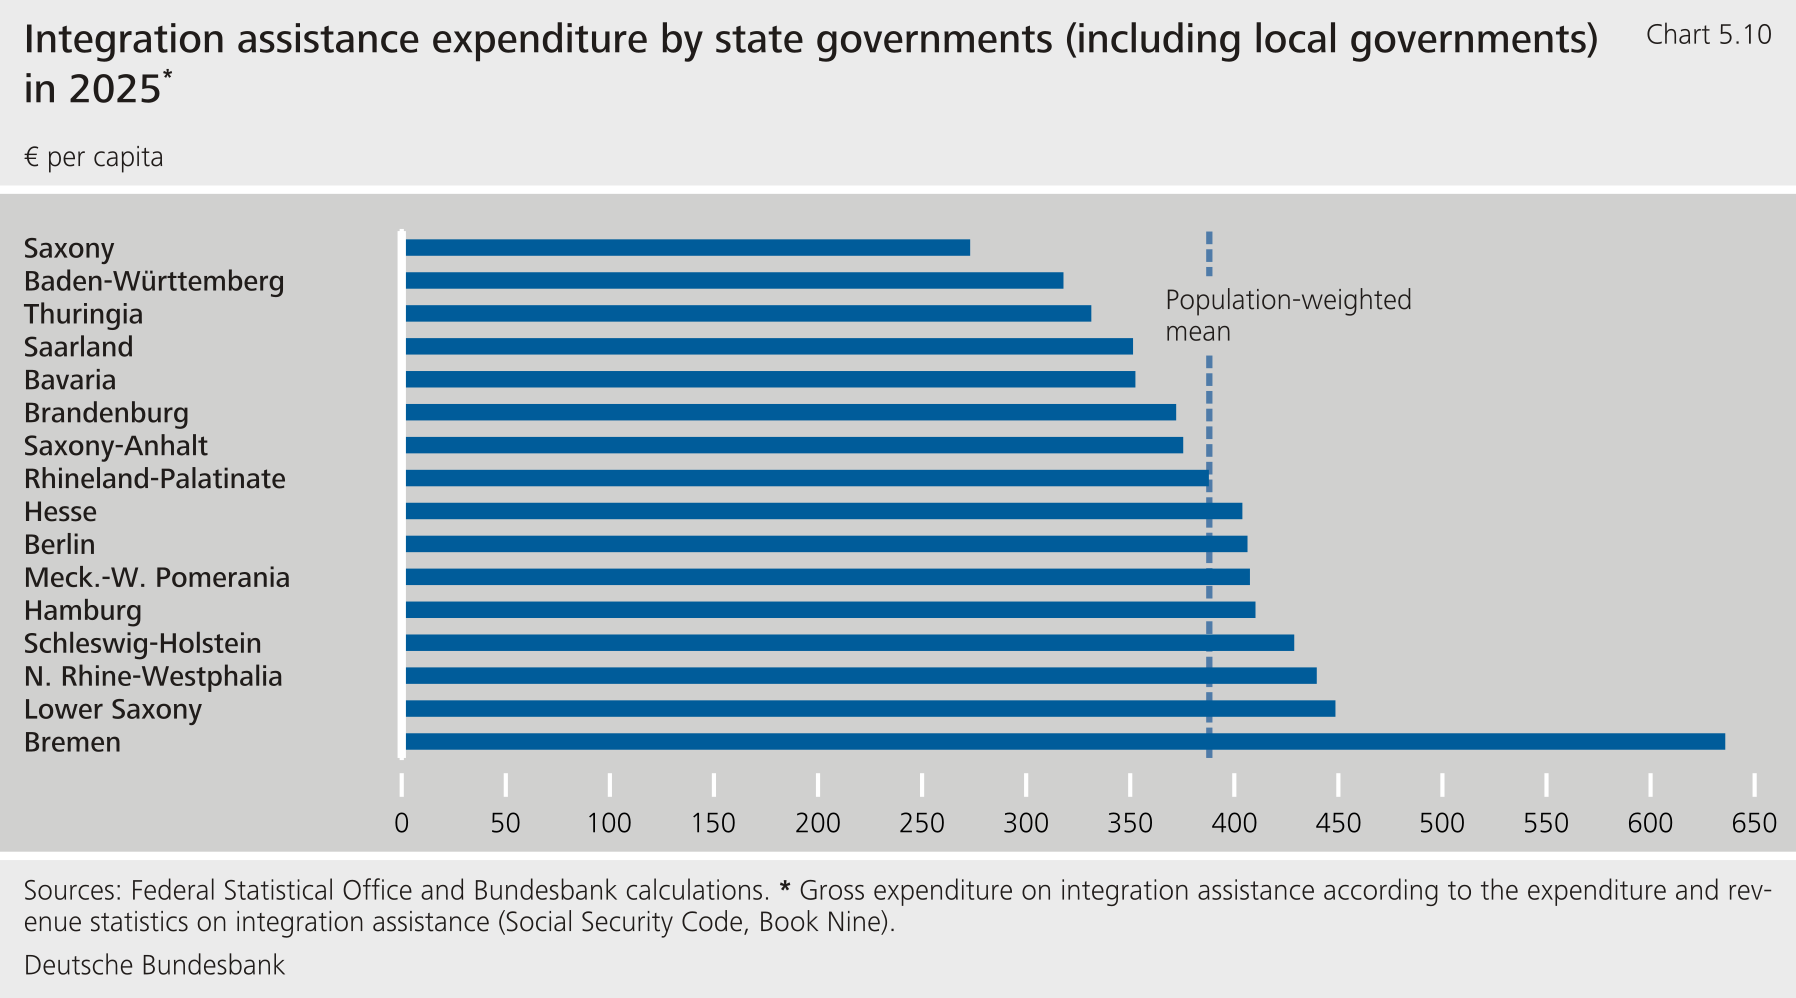
When aggregated at federal state level,gross expenditure on integration assistance differs considerably between the states. Per capita, the federal states (including local governments) spanned a range from €270 in Saxony to €640 in Bremen in 2025 (Chart 5.10). 41 It is thus almost 140 % higher in Bremen than in Saxony. 42 But, this comparison should be interpreted with caution as well. This is because the federal states ascribe certain integration benefits to different benefit systems in some cases. 43
Structural factors as well as differing policy decisions and preferences in the federal states (within the scope of federal benefit entitlements) are likely to have a considerable impact on expenditure on integration assistance:
Demographic factors can influence how many benefit recipients there are (case numbers). The age structure is one example. However, it is not possible to infer sizeable differences between the federal states in terms of numbers of recipients per capita of the population by looking at how many people fall into which age group.
Different costs, such as for staff or building use, can influence per-case costs. Remuneration of staff is a major cost item but that varies only relatively moderately from one federal state to the next. As such, it can only go so far in explaining differences.
State and local governments can set up, provide and approve benefits in different ways. The federal legal framework contained in Book Nine of the Social Security Code provides for a certain degree of discretionary scope here. Decisions of this nature are likely to have an impact on per-case costs, too. One example would be different proportions of housing-related benefits and assistance benefits. There may also be cross-state variation between providers where administrative practices are concerned – for example, with regard to how needs are assessed. Analyses of the importance of this aspect do not appear to have been carried out.
Reform proposals currently under discussion
Reforms that could rein in overall expenditure on integration assistance are currently under discussion. There are also proposals to modify how integration assistance tasks and financing are distributed with a view to relieving the burden on local government finances. One example are the reforms for greater efficiency formulated by the central and state government working group on “Efficient use of resources under benefit laws”. 44 The proposals put forward include using a simpler procedure to ascertain needs, expanding flat-rate cash benefits and reducing reporting requirements. The working group also recommended bundling services to a greater extent or running them in a more cost-efficient manner, for example by revising staffing mix quotas to require fewer specialised personnel or pooling provision of assistance services. Bertelsmann Stiftung convened a Council of Experts around the topic of “strengthening local government’s capacity to act”. Their contrasting proposal was to relocate responsibility and funding for supralocal integration assistance to the state government level. The idea would be to remove some of the financial burden on local governments. 45
If it proves possible to unlock efficiency reserves where integration assistance is concerned while maintaining an appropriate standard of benefit provision it will be a welcome step. This has the potential to ease the burden on local government finances, provided state governments do not make cuts to other transfers in return. Details regarding the design and possible harmonisation of benefits are ultimately a matter for policymakers to decide. Costs should also be taken into account as part of the usual process of priority setting. There is no reason why individual federal states should not offer differently structured integration assistance benefits within the framework provided by law. After all, even in the case of federal benefit entitlements and standards, state or local governments can have different service set-ups and provide benefits in different ways. However, higher benefit amounts would then also have to be reliably offset elsewhere in the budget.
Gase, A. (2026), Länderbericht Bremen 2025, in: Junkernheinrich et al. (eds., 2026), Jahrbuch für öffentliche Finanzen (Journal of Public Finance and Fiscal Federalism), Vol. 2, June 2026, No 1, pp. 165‑170.
Jethon, A. (2024), Warum kein „dynamisches Drittel“ für alle?, der gemeindehaushalt, Vol. 6/2024.
Joint central government-state government working group on “Veranlassungskonnexität”, "Effizienter Ressourceneinsatz bei Leistungsgesetzen", Anlage zu Beschlussvorschlag TOP 3.1 – Bund-Länder-AG Veranlassungskonnexität, June 2026.
Krönert, E. (2026), Länderbericht Thüringen 2025, in: Junkernheinrich et al. (eds., 2026), Jahrbuch für öffentliche Finanzen (Journal of Public Finance and Fiscal Federalism), Vol. 2, June 2026, No 1, pp. 284‑292.
Ministry of Finance for the State of Schleswig-Holstein (2026), Unterrichtung über den vorläufigen Jahresabschluss 2025, Umdruck 20/06199.
Ministry of the Interior, Safety and Domestic Security for the State of Hesse (2026), Kommunale Finanzplanung und Haushaltsungs- und Wirtschaftsführung bis 2030, Official Gazette of Hesse No 39/2026, pp. 890‑894.
Schirwitz, B. (2026), Länderfinanzbericht Brandenburg 2025, in: Junkernheinrich et al. (eds., 2026), Jahrbuch für öffentliche Finanzen (Journal of Public Finance and Fiscal Federalism), Vol. 2, June 2026, No 1, pp. 157‑164.